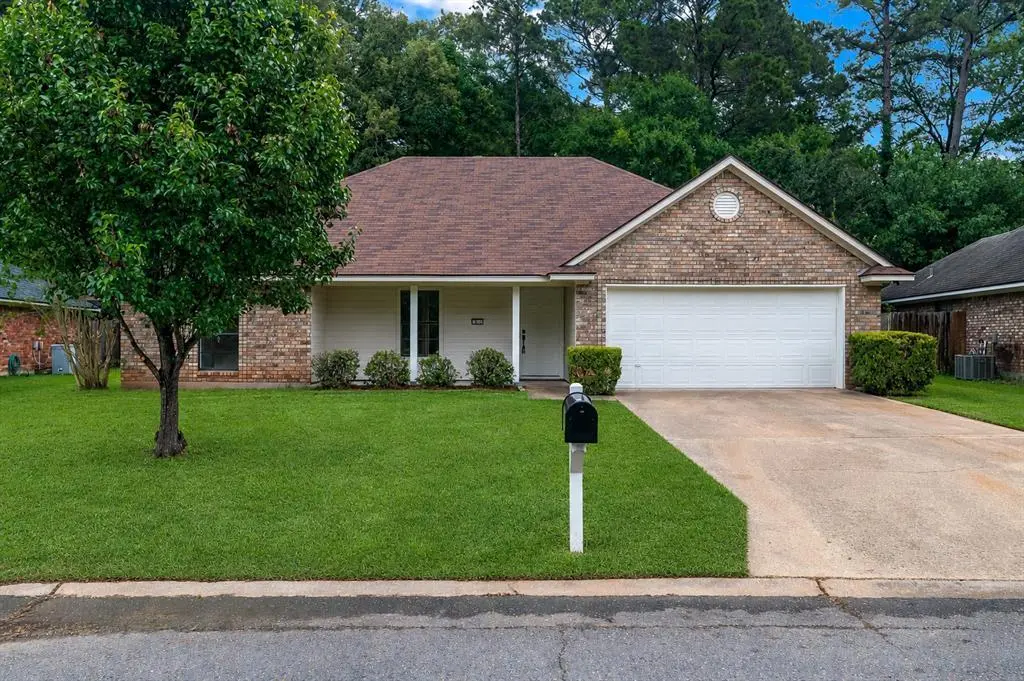
3816 Shadow Bend Dr · Red Chute, LA
Flood risk 1/10 · Minimal
- FEMA flood zone
- X (unshaded)
- Chance of flooding over 30 yrs
- 0.0%
- Est. flood insurance / yr
- $507 – $1,088
Fire risk 4/10 · Minor
- Est. fire insurance / yr
- $1,269 – $2,357
Heat risk 7/10 · Major
- Hot days now (above 110°F)
- 7 days/yr
- Hot days in 30 yrs
- 22 days/yr
Wind risk 6/10 · Moderate
- Chance of severe wind over 30 yrs
- 61.0%
Air-quality risk 2/10 · Minimal
- Unhealthy air days now
- 1 days/yr
- Unhealthy air days in 30 yrs
- 1 days/yr
Risk factors via First Street. Map © Google.
Why this score? — see what drove the D grade
The composite is a weighted blend of 9 inputs, each scored 0–100. Each bar is that input's sub-score; the figure is the points it added to the 100-point composite (weight × sub-score).
- Cash flow +15.7/30.0
- ARV discount +7.2/15.0
- DSCR +4.9/10.0
- Schools +3.8/10.0
- 1% rule +3.3/10.0
- Livability +2.9/5.0
- Rent growth +2.5/5.0
- Condition / age +2.5/5.0
- Appreciation +0.0/10.0
$226,900
🖨 Deal sheet (PDF) 📄 Offer letter ✓ Due diligence
Listing remarks MLS
Dogwood SPECIAL! Are you looking for your next project. Look no further. This house is ready for some TLC. Located on a dead end, snuggled in Dogwood Place. Perfect for an investor or a first time home buyer that is not afraid to roll up their sleeves.
Key facts
- Fully renovated
- Peaceful wooded view
- 0.26 acre lot
Tags
Property features AI
Finance
- Other: Subdivision: Dogwood Park Unit 19; Municipal utility district: No
- Financial info: Accepts Cash, Conventional, FHA, VA financing; Second mortgage: No; Loan type: Treat As Clear
- HOA & community: Voluntary homeowners association (Dogwood HOA); HOA management phone: 318-949-1033
Exterior
- Parking: 2-car attached garage; Garage faces front; 2 covered parking spaces
- Security: Carbon monoxide detector(s); Fire alarm
- Utilities: City water; City sewer; Electricity available; Cable available
- Home design: Single family residence; One story; Residential property; Not attached to another property
- Construction: Brick construction; Composition roof; Slab foundation; Built in 1994
- Exterior features: Fenced yard; Covered patio/porch; Partially wooded lot
Interior
- Kitchen: Dishwasher; Gas cooktop; Microwave
- Bedrooms: 3 bedrooms; Primary bedroom on main level with walk-in closet
- Flooring: Carpet; Luxury vinyl plank
- Bathrooms: 2 full bathrooms
- Heating & cooling: Central heating; Central air
- Interior features: Built-in features; Eat-in kitchen; Granite counters; Pantry; Bay window(s)
- Laundry & utility: Utility room
Neighborhood map
What this means for you Summary
Snapshot
- This is a 3-bed/2.0-bath single-family listed at $227k.
Deal economics
- At list price, monthly cash flow is $101 ($1k/yr) — positive.
- The deal already cash-flows at list — no discount required.
- To meet the 1% rule (rent ≥ 1% of price), the offer needs to be $188k (17.2% below list).
- Recommended offer: $188k (17.2% below list) — sets the bar for 1% rule.
- Cap rate 6.8% vs local median 5.7% in Red Chute — meaningfully above typical; check what's discounted (condition, days-on-market, listing class) to confirm the premium yield is real.
Location & tenants
- Location reads 58/100 on livability (#290 in LA) — a working-class tenant base; expect higher turnover. Strengths: cost of living A+, housing A+; Watch: crime D+, employment D+, amenities F.
- Bossier Parish (urban): math 40% / reading 47% proficiency, ranked #17 of 98 in LA (top 17%) — families likely to look elsewhere, expect single-tenant / working-renter base with shorter leases.
- Zoned schools: Stockwell Place Elementary School (math 72% / reading 67%, grade A-, #27 of 646 statewide, top 5%, 594 students, 45% FRL); Cope Middle School (math 42% / reading 54%, grade C-, #35 of 218 statewide, top 16%, 836 students, 58% FRL); Airline High School (math 49% / reading 56%, grade C-, #30 of 265 statewide, top 12%, 2,021 students, 56% FRL).
- Zoned-school proficiency averages 57% at this address vs 44% district-wide (+13 pts) — the actual schools serving this property are materially stronger than the Bossier Parish average implies; a family-tenant draw the district grade alone would hide.
- Market conditions: 335 active listings in the ZIP; 3 comparable units currently listed for rent nearby; rentals lingering (median 46d on market — plan ~5-8 weeks vacancy on turnover, expect pricing pressure); 67% of comp listings sitting > 30 days — soft ceiling on asking rent; solid renter incomes; 716 units permitted in Bossier Parish in 2024 (0 in 5+ unit buildings).
Forward outlook
- Local home prices are declining (-3.0%/yr); year-one equity from $2k of loan paydown is wiped out by about $7k of value loss. Plan a longer hold.
- Bossier County population projected at +28% by 2050 — long-run rental-demand tailwind backs the buy-and-hold thesis.
Negotiation context
- Only 4 days on market — expect competitive offers; lowballing is unlikely to land.
- 2 sale attempts with the ask held roughly flat each time — persistent listings suggest the price (not the market) is what's stuck; bring a comps-based counter.
Risks & watch-outs
- Climate carrying-cost: major wind risk, 61% chance of damaging wind over 30y; extreme-heat days projected 7→22/yr by 2055 (HVAC capex compounding) — expect insurance premiums to compound above CPI over the hold.
Questions for the listing agent
- Is there a deadline driving the sale (1031 exchange, divorce, estate, relocation)? That informs how much negotiation room exists.
- Schools are F-rated, which usually means shorter tenancies and higher turnover. Who's the typical renter profile here, and what's been the actual vacancy rate?
- Crime grade is D in this area — have there been break-ins, vandalism, or insurance claims at this property in the last 3 years? What carrier currently insures it and at what premium?
- The area grade is low — what's the realistic commute time and amenity access for the typical tenant pool here? Any planned neighborhood developments (good or bad) we should know about?
- What's the average days-on-market for RENTAL listings here right now (not sales)? A rising rental-DOM trend means longer vacancies and softer asking-rent achievability than the comps imply.
- What's the recent tenant-quality profile in this submarket — average credit score on applications, eviction rate, late-payment / NSF rate, and stable-employment percentage? A property-management company in the area should have these aggregated.
- How much new for-sale + rental construction is in the pipeline within 1–3 miles? Heavy new supply typically softens prices + rents 12–24 months out; constrained supply supports both.
Investment metrics
- 1% rule
- 0.83% ✗
- Cap rate
- 6.83%
- Cash-on-cash
- 1.91%
- DSCR
- 1.09
- GRM
- 10.1
CMA / ARV
- ARV (median comp)
- $225,191
- List price
- $226,900
- Delta
- 0.76%
- Verdict
- FAIR
- Comps
- 20 within 1.0 mi
Show comp detail 12 sales within ~0.75 mi
| Address | Dist | Beds/Ba | Sqft | Sold | Price | $/sf | Match |
|---|---|---|---|---|---|---|---|
| 3816 Shadow Bend Dr | 0.00mi | 3/2.0 | 1,413 (0%) | 0mo | $226,900 | $161 | 100 |
| 3709 Shadow Bend Dr | 0.12mi | 3/2.0 | 1,490 (+5%) | 2mo | $220,000 | $148 | 84 |
| 3516 Woodvine Cir | 0.25mi | 3/2.0 | 1,347 (-5%) | 6mo | $197,000 | $146 | 76 |
| 3207 Pine Haven Ln | 0.61mi | 3/2.0 | 1,442 (+2%) | 1mo | $219,000 | $152 | 68 |
| 3514 Shadow Wood Dr | 0.26mi | 3/2.0 | 1,550 (+10%) | 6mo | $220,000 | $142 | 67 |
| 3112 Heatherbrook Dr | 0.67mi | 3/2.0 | 1,413 (0%) | 5mo | $215,000 | $152 | 65 |
| 2903 Loriwood Dr | 0.65mi | 3/2.0 | 1,450 (+3%) | 8mo | $229,000 | $158 | 59 |
| 8517 Woodhill Ln | 0.53mi | 3/2.0 | 1,500 (+6%) | 9mo | $219,500 | $146 | 58 |
| 8417 Edgewood Dr | 0.54mi | 3/2.0 | 1,450 (+3%) | 16mo | $199,900 | $138 | 57 |
| 3118 Woodhue Cir | 0.48mi | 3/2.0 | 1,583 (+12%) | 8mo | $249,900 | $158 | 51 |
| 3423 Ginger Dr | 0.49mi | 3/2.0 | 1,505 (+6%) | 19mo | $215,000 | $143 | 50 |
| 8410 Woodhill Ln | 0.51mi | 3/2.0 | 1,542 (+9%) | 16mo | $240,000 | $156 | 47 |
Match score weights: distance 35% · size 25% · config 20% · recency 20%. Top-matched comps best support the ARV.
Projected returns pro-forma
-3.0% appreciation · 3.0% rent growth · sell at horizon
- IRR
- -13.3%
- Equity multiple
- 0.52×
- Total profit
- $-30,411
- Equity at exit
- $33,832
- IRR
- -4.4%
- Equity multiple
- 0.71×
- Total profit
- $-18,533
- Equity at exit
- $19,618
Cash invested: $63,532 (down + closing). Projections, not guarantees.
Landlord ↔ Tenant lean methodology
- Overall (STATE)
- 90 Strongly Landlord-Friendly
- State Louisiana
- 90 Strongly Landlord-Friendly · R+12
- County
- — inherits STATE
- City
- — inherits STATE
ZIP-level market 71037
- Home prices YoY
- -27.8%
- Active inventory
- 335
- Price-to-rent
- 10.1×
Monthly cashflow live
- Estimated rent
- $1,879 medium interval (Pro) →
- Mortgage (P&I)
- −$1,190
- Tax from tax record
- −$99 /mo · $1,182/yr
- Insurance
- −$95
- HOA
- −$0
- Vacancy / Maint / Mgmt
- −$395
- Net cashflow
- $101
Break-even live
Sensitivity live
| Price | -10% $230 | -5% $165 | +0% $101 | +5% $37 | +10% $-27 |
|---|---|---|---|---|---|
| Rent | -10% $-47 | -5% $27 | +0% $101 | +5% $175 | +10% $250 |
| Rate | -1.0pp $215 | -0.5pp $159 | base $101 | +0.5pp $42 | +1.0pp $-17 |
UW: 25.0% down · 7.5% · 30yr · 1.5% tax · 5.0% vac · 8.0% maint · 8.0% mgmt
Financing live
Cash to close
- Down payment
- $56,725
- Closing costs
- $6,807
- Reserves months
- —
- Total cash needed
- —
Loan-product check · same deal, 3 products live
Conventional
25% down · 7.5% · 30yr
- Down + closing
- —
- Monthly P&I
- —
- Monthly cashflow
- —
- DSCR
- —
- Eligible?
- —
Personal DTI + credit; lowest rate.
DSCR
20% down · 8.5% · 30yr
- Down + closing
- —
- Monthly P&I
- —
- Monthly cashflow
- —
- DSCR
- —
- Eligible?
- —
No personal income docs; deal must DSCR.
Hard money
10% down · 12.0% · 12mo
- Down + closing
- —
- Monthly P&I
- —
- Monthly cashflow
- —
- DSCR
- —
- Eligible?
- —
Short-term bridge; refi at stabilization.
Rent comps 3 comps
| Address | Beds | Baths | Sqft | Rent | $/sqft | DOM | Units | Dist |
|---|---|---|---|---|---|---|---|---|
| 8509 Woodhill Ln Haughton, LA | 3.0 | 2.0 | 1451 | $1,650 | $1.14 | 45d | 1 | 0.51mi |
| 2523 Brookhaven Dr Bossier City, LA | 3.0 | 2.0 | 1800 | $1,950 | $1.08 | 23d | 1 | 1.07mi |
| 6021 Whitney Dr Bossier City, LA | 4.0 | 2.0 | 1780 | $2,100 | $1.18 | 45d | 1 | 1.09mi |
Listing history 8 events
-
2026-05-05status Pending 954-char remark
-
2026-05-01$226,900 Active 954-char remark
-
2026-02-26soldstatus $145,000
-
2026-02-25soldstatus Closed 252-char remark
Show marketing remark (252 chars)
Dogwood SPECIAL! Are you looking for your next project. Look no further. This house is ready for some TLC. Located on a dead end, snuggled in Dogwood Place. Perfect for an investor or a first time home buyer that is not afraid to roll up their sleeves.
-
2026-02-11status Pending 252-char remark
Show marketing remark (252 chars)
Dogwood SPECIAL! Are you looking for your next project. Look no further. This house is ready for some TLC. Located on a dead end, snuggled in Dogwood Place. Perfect for an investor or a first time home buyer that is not afraid to roll up their sleeves.
-
2026-02-09price $175,000 252-char remark
Show marketing remark (252 chars)
Dogwood SPECIAL! Are you looking for your next project. Look no further. This house is ready for some TLC. Located on a dead end, snuggled in Dogwood Place. Perfect for an investor or a first time home buyer that is not afraid to roll up their sleeves.
-
2025-12-15$180,000 Active 252-char remark
Show marketing remark (252 chars)
Dogwood SPECIAL! Are you looking for your next project. Look no further. This house is ready for some TLC. Located on a dead end, snuggled in Dogwood Place. Perfect for an investor or a first time home buyer that is not afraid to roll up their sleeves.
-
2008-02-15soldstatus $148,000
ⓘ Source: listings_history table (triggers on properties + properties_extension) + one-shot
backfill from property_details.listing_events for pre-trigger history.
Tax reassessment forecast LA · Resets to sale price
- Current annual tax
- $1,182 · $99/mo
- Projected year-2 tax
- $1,248 · $104/mo
- Expected delta
- +$66/yr (+$5/mo · 5.6%)
ⓘ Screening estimate from a state-policy table — verify with the county assessor before closing.
Climate risk First Street
- Flood 1/10 Low FEMA zone X (unshaded) · 0% chance over 30 yrs
- Wildfire 4/10 Moderate
- Heat 7/10 Severe 7 d/yr ≥110°F today · 22 d/yr by 30 yrs out
- Wind 6/10 Major 61% chance of damaging wind over 30 yrs
- Air quality 2/10 Low 1 unhealthy d/yr today · 1 by 30 yrs out
Nearby sold comps map
Loading sold comps map…
Walkable amenities ~0.75 mi
Loading nearby amenities…
Taxation est. · year 1
- Rental income
- $22,543
- − Mortgage interest
- −$12,710
- − Property taxes
- −$1,182
- − Insurance
- −$1,134
- − Repairs & maintenance
- −$1,803
- − Management
- −$1,803
- − Depreciation
- −$6,601
- Taxable loss
- −$2,691
- Est. tax savings @ 24.0%
- +$646
- After-tax cash flow
- $1,860/yr
For passive investors: Depreciation is non-cash, so a rental often shows a tax loss while cash-flowing — sheltering income. Rental losses are passive: they offset passive income freely, and up to $25,000/yr can offset ordinary (W-2) income if you actively participate and your MAGI is under $100k (phasing out to $0 by $150k); unused losses carry forward. On sale, claimed depreciation is recaptured at up to 25%, and gains may owe capital-gains tax (a 1031 exchange can defer both). Figures are a year-1 estimate at your 24.0% rate — not tax advice; consult a CPA.
Schools (NCES district)
- District
- Bossier Parish
- NCES district ID
- 2200270
- Math proficiency
- 40% ▼ -32.00%
- Reading proficiency
- 47% ▼ -28.00%
- Median HH income
- $51,326
- Composite
- 37.5/100
- National rank
- #4402
- State rank
- #17 of 98 in LA
Livability — Red Chute
- Score
- 58/100
- State rank
- #290
- US rank
- #20659
Category grades
Schools grade is shown separately in the Schools card above.
Census & demographics
- Census place
- Red Chute, LA
- County
- Bossier Parish · 98,704 people
- Metro
- Shreveport-Bossier City, LA
- Population (ZIP)
- 21,192
- Household income
- $78,571
- Rent vs Own
- Severe rent burden
- 171.0
Population outlook (Bossier County) Hauer SSP2
- Today (2025)
- 143,247 people
- By 2030
- 151,802 · +6.0%
- By 2040
- 168,194 · +17.4%
- By 2050
- 183,533 · +28.1%
- By 2075
- 217,009 · +51.5%
- By 2100
- 230,091 · +60.6%
Race, ethnicity, and origin ACS 2023
- Neighborhood character
- Predominantly White (76%)
- Race & ethnicity
- White 76% Black 15% Hispanic / Latino 6% Two or more races 3%
- Hispanic origin (detail)
- Mexican 4%
- Common ancestry
- Lithuanian 2% Italian 1% Slovak 1%
- Foreign-born
- 3% · Canada
- Languages at home
- 95% English-only · Spanish 4%
Political lean MEDSL · Bossier
- 2024 margin
- Solid R (+43.3) · D 27.7% · R 71.0% · Other 1.3%
- 2008→2024 swing
- +0.3pp no change · 2008: -43.7pp · 2024: -43.3pp
- All cycles
- 2024: R+43.3 2020: R+41.0 2016: R+45.8 2012: R+45.4 2008: R+43.7
Not yet ingested
- Civics
- —
Market trends
- HPI YoY
- ▼ -59.53%
- Current HPI
- 154.5064
- Rent YoY
- —
- Metro
- Shreveport-Bossier City, LA
- State GDP YoY
- ▲ 3.29%
- F500 in state
- 10
Industry mix (Fortune 500 HQ in LA)
| Industry | F500 HQs | Revenue |
|---|---|---|
| Telecommunications | 2 | $23B |
|
||
| Utilities | 1 | $12B |
|
||
| Wholesale / Distribution | 1 | $5B |
|
||
| Advertising | 1 | $2B |
|
||
Price history
+55.4% since first listed10 events — show timeline
- 2026-06-08 Sold (Public Records) $230,000 Public Records
- 2026-06-08 Sold (MLS) — NTREIS
- 2026-05-05 Pending — NTREIS
- 2026-05-01 Listed $226,900 NTREIS
- 2026-02-26 Sold (Public Records) $145,000 Public Records
- 2026-02-25 Sold (MLS) — NTREIS
- 2026-02-11 Pending — NTREIS
- 2026-02-09 Price Changed $175,000 NTREIS
- 2025-12-15 Listed $180,000 NTREIS
- 2008-02-15 Sold (Public Records) $148,000 Public Records
Property tax history
+2.9%/yrLatest (2025): $1,182 · +0.6% YoY. Source: county tax records.
Cash-flow waterfall
monthlySold comps — $/sqft
last 12 mo · ≤1 miLoading sold comps…