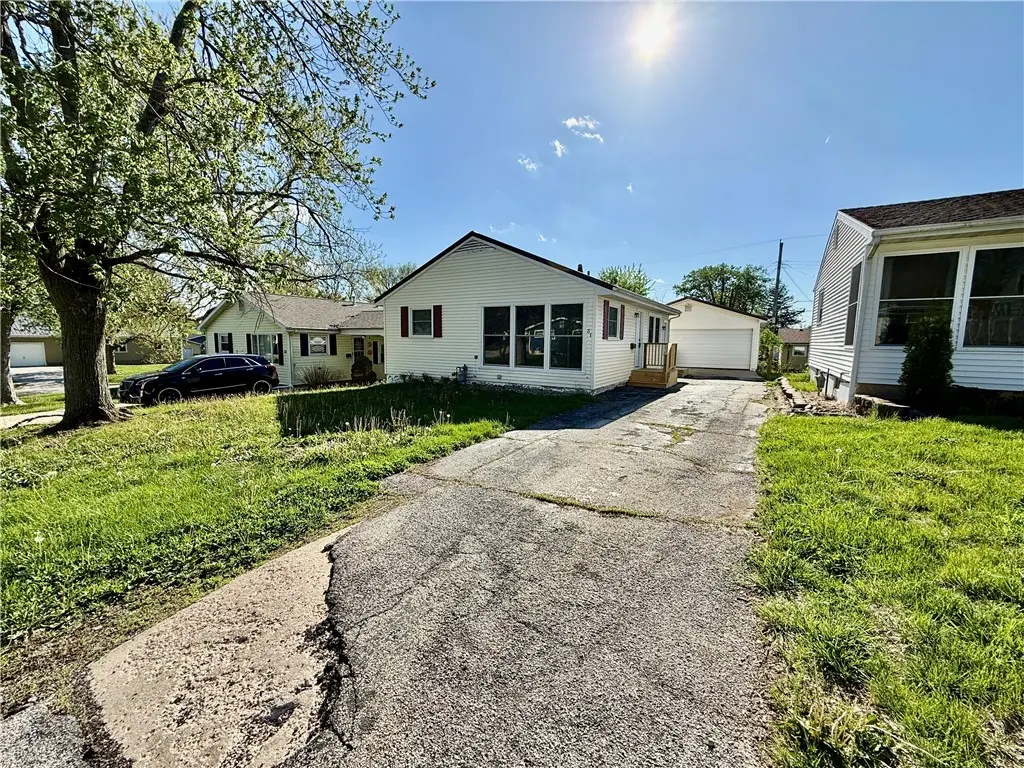
31 Sickles Dr · Decatur, IL
Flood risk 1/10 · Minimal
- FEMA flood zone
- X (unshaded)
- Chance of flooding over 30 yrs
- 0.0%
- Est. flood insurance / yr
- $473 – $860
Fire risk 1/10 · Minimal
- Est. fire insurance / yr
- $804 – $1,492
Heat risk 4/10 · Minor
- Hot days now (above 105°F)
- 7 days/yr
- Hot days in 30 yrs
- 19 days/yr
Wind risk 2/10 · Minimal
- Chance of severe wind over 30 yrs
- 1.0%
Air-quality risk 2/10 · Minimal
- Unhealthy air days now
- 1 days/yr
- Unhealthy air days in 30 yrs
- 1 days/yr
Risk factors via First Street. Map © Google.
Why this score? — see what drove the F grade
The composite is a weighted blend of 9 inputs, each scored 0–100. Each bar is that input's sub-score; the figure is the points it added to the 100-point composite (weight × sub-score).
- Cash flow +8.7/30.0
- ARV discount +7.5/15.0
- Livability +3.0/5.0
- 1% rule +2.5/10.0
- Rent growth +2.5/5.0
- Condition / age +2.5/5.0
- DSCR +2.4/10.0
- Schools +0.4/10.0
- Appreciation +0.0/10.0
$147,897
🖨 Deal sheet (PDF) 📄 Offer letter ✓ Due diligence
Listing remarks MLS
Bigger than it looks-hardwood floors, basement is partially finished. Eat-in kitchen. Seller will help w/closing costs.
Key facts
- Attached garage
- Full basement
- Vinyl plank flooring
Tags
Property features AI
Exterior
- Parking: Detached 2-car garage
- Utilities: Public water; Public sewer
- Home design: Single-family residence; One level / 1 story
- Construction: Vinyl siding; Finished area above grade and below grade; Built with full finished basement
- Exterior features: Asphalt road access; Metal roof
Interior
- Kitchen: Range
- Bathrooms: 1 full bathroom
- Heating & cooling: Natural gas forced-air heating; Central air conditioning
- Interior features: Finished full basement; Gas water heater; Range
Neighborhood map
What this means for you Summary
Snapshot
- This is a 3-bed/1.0-bath other listed at $148k.
Deal economics
- At list price, monthly cash flow is $-124 ($-1k/yr) — negative.
- To cash-flow at today's rent, offer at most $126k (14.8% below list).
- To meet the 1% rule (rent ≥ 1% of price), the offer needs to be $111k (24.7% below list).
- Recommended offer: $111k (24.7% below list) — sets the bar for 1% rule.
- Cap rate 5.3% vs local median 7.0% in Decatur — below-typical yield; the buyer is paying a premium for something (appreciation thesis, condition, location) that the cap rate doesn't capture.
Location & tenants
- Location reads 59/100 on livability (#1,076 in IL) — a working-class tenant base; expect higher turnover. Strengths: cost of living A+, housing A+; Watch: schools F, crime F, amenities F.
- Decatur SD 61 (urban): math 3% / reading 6% proficiency, ranked #605 of 620 in IL (top 98%) — low school quality limits family demand, transient renter base, plan for 1-2y turnover; 73% free/reduced lunch — lower-income household profile, screen leases tightly.
- Market conditions: 193 active listings in the ZIP; 1 comparable units currently listed for rent nearby; 63 units permitted in Macon County in 2024 (0 in 5+ unit buildings).
Forward outlook
- Local home prices are declining (-3.0%/yr); year-one equity from $1k of loan paydown is wiped out by about $4k of value loss. Plan a longer hold.
- Macon County population projected at -24% by 2050 — secular population decline; favor cash flow + early exit over multi-decade hold.
Negotiation context
- It's been on market 22 days — a 2% lower offer ($146k) is reasonable based on typical stale-listing flexibility.
- 4 sale attempts since 17y ago with the ask held roughly flat each time — persistent listings suggest the price (not the market) is what's stuck; bring a comps-based counter.
- Current owner paid $50k; list at $148k implies a 196% gain — meaningful room to come down on a strong offer.
Risks & watch-outs
- Watch-outs: built in 1957 — expect roof / HVAC / electrical / plumbing capex.
Questions for the listing agent
- What do current leases actually rent for vs. the listed asking? Can we see a recent rent roll and the last 12 months of T-12 income?
- Built in 1957 — when were the roof, HVAC, electrical panel, plumbing, and water heater last replaced?
- Is there a deadline driving the sale (1031 exchange, divorce, estate, relocation)? That informs how much negotiation room exists.
- Schools are F-rated, which usually means shorter tenancies and higher turnover. Who's the typical renter profile here, and what's been the actual vacancy rate?
- Crime grade is F in this area — have there been break-ins, vandalism, or insurance claims at this property in the last 3 years? What carrier currently insures it and at what premium?
- The area grade is low — what's the realistic commute time and amenity access for the typical tenant pool here? Any planned neighborhood developments (good or bad) we should know about?
- What's the average days-on-market for RENTAL listings here right now (not sales)? A rising rental-DOM trend means longer vacancies and softer asking-rent achievability than the comps imply.
- What's the recent tenant-quality profile in this submarket — average credit score on applications, eviction rate, late-payment / NSF rate, and stable-employment percentage? A property-management company in the area should have these aggregated.
- How much new for-sale + rental construction is in the pipeline within 1–3 miles? Heavy new supply typically softens prices + rents 12–24 months out; constrained supply supports both.
Investment metrics
- 1% rule
- 0.75% ✗
- Cap rate
- 5.29%
- Cash-on-cash
- -3.58%
- DSCR
- 0.84
- GRM
- 11.1
CMA / ARV
No comps found within radius.
Projected returns pro-forma
-3.0% appreciation · 3.0% rent growth · sell at horizon
- IRR
- -22.3%
- Equity multiple
- 0.23×
- Total profit
- $-31,838
- Equity at exit
- $22,052
- IRR
- -16.4%
- Equity multiple
- 0.09×
- Total profit
- $-37,846
- Equity at exit
- $12,787
Cash invested: $41,411 (down + closing). Projections, not guarantees.
Landlord ↔ Tenant lean methodology
- Overall (STATE)
- 43 Moderately Tenant-Leaning
- State Illinois
- 43 Moderately Tenant-Leaning · D+7
- County
- — inherits STATE
- City
- — inherits STATE
ZIP-level market 62521
- Home prices YoY
- -9.0%
- Active inventory
- 193
- Price-to-rent
- 11.1×
Monthly cashflow live
- Estimated rent
- $1,113 medium interval (Pro) →
- Mortgage (P&I)
- −$776
- Tax from tax record
- −$166 /mo · $1,990/yr
- Insurance
- −$62
- HOA
- −$0
- Vacancy / Maint / Mgmt
- −$234
- Net cashflow
- $-124
Break-even live
Sensitivity live
| Price | -10% $-40 | -5% $-82 | +0% $-124 | +5% $-166 | +10% $-207 |
|---|---|---|---|---|---|
| Rent | -10% $-212 | -5% $-168 | +0% $-124 | +5% $-80 | +10% $-36 |
| Rate | -1.0pp $-49 | -0.5pp $-86 | base $-124 | +0.5pp $-162 | +1.0pp $-201 |
UW: 25.0% down · 7.5% · 30yr · 1.5% tax · 5.0% vac · 8.0% maint · 8.0% mgmt
Financing live
Cash to close
- Down payment
- $36,974
- Closing costs
- $4,437
- Reserves months
- —
- Total cash needed
- —
Loan-product check · same deal, 3 products live
Conventional
25% down · 7.5% · 30yr
- Down + closing
- —
- Monthly P&I
- —
- Monthly cashflow
- —
- DSCR
- —
- Eligible?
- —
Personal DTI + credit; lowest rate.
DSCR
20% down · 8.5% · 30yr
- Down + closing
- —
- Monthly P&I
- —
- Monthly cashflow
- —
- DSCR
- —
- Eligible?
- —
No personal income docs; deal must DSCR.
Hard money
10% down · 12.0% · 12mo
- Down + closing
- —
- Monthly P&I
- —
- Monthly cashflow
- —
- DSCR
- —
- Eligible?
- —
Short-term bridge; refi at stabilization.
Rent comps 1 comps
| Address | Beds | Baths | Sqft | Rent | $/sqft | DOM | Units | Dist |
|---|---|---|---|---|---|---|---|---|
| 1035 S Main St Decatur, IL | 2.0 | 1.0 | 847 | $880 | $1.04 | 14d | 7 | 1.13mi |
Listing history 25 events
-
2026-06-19days on market $147,897 Active 22 DOM
-
2026-06-18days on market $147,897 Active 21 DOM
-
2026-06-17days on market $147,897 Active 20 DOM
-
2026-06-16days on market $147,897 Active 19 DOM
-
2026-06-15days on market $147,897 Active 18 DOM
-
2026-06-14days on market $147,897 Active 16 DOM
-
2026-06-13days on market $147,897 Active 15 DOM
-
2026-06-10days on market $147,897 Active 13 DOM
-
2026-06-09days on market $147,897 Active 12 DOM
-
2026-06-08days on market $147,897 Active 11 DOM
-
2026-06-07days on market $147,897 Active 10 DOM
-
2026-06-05days on market $147,897 Active 7 DOM
-
2026-06-02days on market $147,897 Active 5 DOM
-
2026-06-01days on market $147,897 Active 4 DOM
-
2026-05-31days on market $147,897 Active 3 DOM
-
2026-05-30days on market $147,897 Active 2 DOM
-
2026-05-28$147,897 Active
-
2025-11-08historical $1,100
-
2025-09-14$1,100
-
2025-09-14historical $1,100
-
2025-09-03$1,100
-
2009-12-31soldstatus $50,000
-
2009-05-15soldstatus $50,000 121-char remark
Show marketing remark (121 chars)
Bigger than it looks-hardwood floors, basement is partially finished. Eat-in kitchen. Seller will help w/closing costs.
-
2009-01-06$64,900 121-char remark
Show marketing remark (121 chars)
Bigger than it looks-hardwood floors, basement is partially finished. Eat-in kitchen. Seller will help w/closing costs.
-
2008-12-31historical
ⓘ Source: listings_history table (triggers on properties + properties_extension) + one-shot
backfill from property_details.listing_events for pre-trigger history.
Tax reassessment forecast IL · Partial reset (capped growth)
- Current annual tax
- $1,990 · $166/mo
- Projected year-2 tax
- $2,674 · $223/mo
- Expected delta
- +$684/yr (+$57/mo · 34.3%)
ⓘ Screening estimate from a state-policy table — verify with the county assessor before closing.
Climate risk First Street
- Flood 1/10 Low FEMA zone X (unshaded) · 0% chance over 30 yrs
- Wildfire 1/10 Low
- Heat 4/10 Moderate 7 d/yr ≥105°F today · 19 d/yr by 30 yrs out
- Wind 2/10 Low 100% chance of damaging wind over 30 yrs
- Air quality 2/10 Low 1 unhealthy d/yr today · 1 by 30 yrs out
Nearby sold comps map
Loading sold comps map…
Walkable amenities ~0.75 mi
Loading nearby amenities…
Taxation est. · year 1
- Rental income
- $13,358
- − Mortgage interest
- −$8,285
- − Property taxes
- −$1,990
- − Insurance
- −$739
- − Repairs & maintenance
- −$1,069
- − Management
- −$1,069
- − Depreciation
- −$4,302
- Taxable loss
- −$4,096
- Est. tax savings @ 24.0%
- +$983
- After-tax cash flow
- $-501/yr
For passive investors: Depreciation is non-cash, so a rental often shows a tax loss while cash-flowing — sheltering income. Rental losses are passive: they offset passive income freely, and up to $25,000/yr can offset ordinary (W-2) income if you actively participate and your MAGI is under $100k (phasing out to $0 by $150k); unused losses carry forward. On sale, claimed depreciation is recaptured at up to 25%, and gains may owe capital-gains tax (a 1031 exchange can defer both). Figures are a year-1 estimate at your 24.0% rate — not tax advice; consult a CPA.
Schools (NCES district)
- District
- Decatur SD 61
- NCES district ID
- 1711850
- Math proficiency
- 3% ▼ -4.00%
- Reading proficiency
- 6% ▼ -6.00%
- Median HH income
- $38,864
- Composite
- 3.99/100
- National rank
- #10059
- State rank
- #605 of 620 in IL
Livability — Decatur
- Score
- 59/100
- State rank
- #1076
- US rank
- #20533
Category grades
Schools grade is shown separately in the Schools card above.
Census & demographics
- Census place
- Decatur, IL
- County
- Macon County · 78,333 people
- City population
- 78,333
- Metro
- Decatur, IL
- Population (ZIP)
- 32,665
- Household income
- $66,337
- Rent vs Own
- Severe rent burden
- 640.0
Population outlook (Macon County) Hauer SSP2
- Today (2025)
- 99,568 people
- By 2030
- 94,973 · -4.6%
- By 2040
- 85,250 · -14.4%
- By 2050
- 75,920 · -23.8%
- By 2075
- 55,962 · -43.8%
- By 2100
- 36,468 · -63.4%
Race, ethnicity, and origin ACS 2023
- Neighborhood character
- Predominantly White (75%)
- Race & ethnicity
- White 75% Black 17% Two or more races 5% Hispanic / Latino 3%
- Common ancestry
- Slovak 3% Romanian 2% Lithuanian 2%
- Foreign-born
- 3% · Canada
- Languages at home
- 96% English-only · Spanish 2% Russian/Polish/Slavic 1% Other Indo-European 0%
Political lean MEDSL · Macon
- 2024 margin
- R (+18.9) · D 39.8% · R 58.7% · Other 1.4%
- 2008→2024 swing
- -20.0pp toward R · 2008: 1.1pp · 2024: -18.9pp
- All cycles
- 2024: R+18.9 2020: R+17.7 2016: R+18.1 2012: R+5.2 2008: D+1.1
Not yet ingested
- Civics
- —
Market trends
- HPI YoY
- ▼ -17.96%
- Current HPI
- 180.9274
- Rent YoY
- —
- Metro
- Decatur, IL
- State GDP YoY
- ▲ 1.59%
- F500 in state
- 60
Industry mix (Fortune 500 HQ in IL)
| Industry | F500 HQs | Revenue |
|---|---|---|
| Insurance | 4 | $201B |
|
||
| Consumer Goods | 4 | $87B |
|
||
| Industrial Machinery | 3 | $64B |
|
||
| Healthcare | 2 | $55B |
|
||
| Retail / Pharmacy | 1 | $148B |
|
||
| Agriculture / Food | 1 | $86B |
|
||
Price history
+127.9% since first listed9 events — show timeline
- 2026-05-28 Listed $147,897 CIBR
- 2025-11-08 Rental Removed $1,100 RentEngineListings
- 2025-09-14 Listed for Rent $1,100 RentEngineListings
- 2025-09-14 Rental Removed $1,100 TENANTTURNER2
- 2025-09-03 Listed for Rent $1,100 TENANTTURNER2
- 2009-12-31 Sold (Public Records) $50,000 Public Records
- 2009-05-15 Sold (MLS) $50,000 MRED as Distributed by MLS Grid
- 2009-01-06 Listed $64,900 MRED as Distributed by MLS Grid
- 2008-12-31 Listing Removed — MRED as Distributed by MLS Grid
Property tax history
+3.0%/yrLatest (2024): $1,990 · +44.6% YoY. Source: county tax records.
Cash-flow waterfall
monthlySold comps — $/sqft
last 12 mo · ≤1 miLoading sold comps…