1258 Cave Creek Rd · Caneyville, KY
Flood risk 1/10 · Minimal
- FEMA flood zone
- X (unshaded)
- Chance of flooding over 30 yrs
- 0.0%
- Est. flood insurance / yr
- $507 – $1,088
Fire risk 3/10 · Minor
- Est. fire insurance / yr
- $839 – $1,559
Heat risk 4/10 · Minor
- Hot days now (above 107°F)
- 7 days/yr
- Hot days in 30 yrs
- 19 days/yr
Wind risk 3/10 · Minor
- Chance of severe wind over 30 yrs
- 5.0%
Air-quality risk 2/10 · Minimal
- Unhealthy air days now
- 0 days/yr
- Unhealthy air days in 30 yrs
- 1 days/yr
Risk factors via First Street. Map © Google.
Why this score? — see what drove the D+ grade
The composite is a weighted blend of 9 inputs, each scored 0–100. Each bar is that input's sub-score; the figure is the points it added to the 100-point composite (weight × sub-score).
- Cash flow +16.8/30.0
- ARV discount +7.5/15.0
- DSCR +5.2/10.0
- 1% rule +4.5/10.0
- Appreciation +4.5/10.0
- Livability +3.4/5.0
- Schools +2.8/10.0
- Rent growth +2.5/5.0
- Condition / age +2.2/5.0
$89,500
🖨 Deal sheet (PDF) 📄 Offer letter ✓ Due diligence
Listing remarks
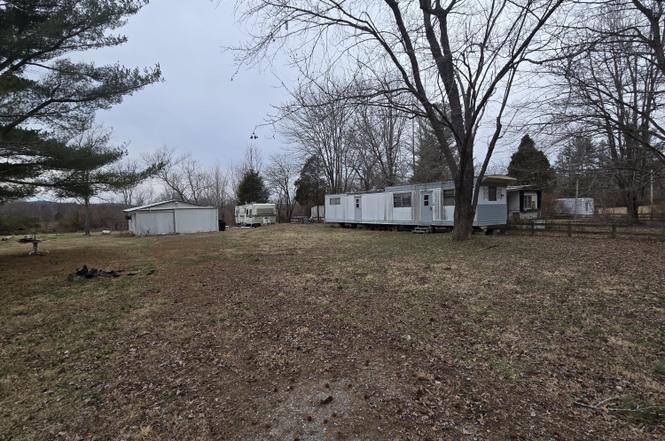
Looking for a great place to get away close to Rough River Lake? This property consist of 2 lots and is located about a half block from the Cave Creek campsite entrance and Cave Creek Boat Ramp. It has a mobile home, a garage that has been used as a camp, and a camper on the property. Plenty of potential for a campsite compound.
Key facts
- Mobile home
- Camper on property
- Cave creek boat ramp
Tags
Property features AI
Finance
- Other: Lot is approximately 0.35 acres
- HOA & community: No association fee
Exterior
- Parking: Detached garage (1 car)
- Utilities: Electricity connected
- Home design: Residential property; Other architectural style; Single-story
- Construction: Flat roof; Building area reported as 840; Year built not provided
- Exterior features: No notable exterior features listed
Interior
- Kitchen: Kitchen on the first floor
- Bedrooms: Two bedrooms total (one primary on the first floor)
- Bathrooms: One full bathroom
- Heating & cooling: Forced-air heating; Wall/window cooling unit(s)
- Interior features: Four total rooms; No basement; First-floor primary bedroom; First-floor laundry
- Laundry & utility: Laundry on the first floor
Neighborhood map
What this means for you Summary
Snapshot
- This is a 2-bed/1.0-bath single-family listed at $90k. Condition is rated fair.
Deal economics
- At list price, monthly cash flow is $57 ($679/yr) — positive.
- The deal already cash-flows at list — no discount required.
- To meet the 1% rule (rent ≥ 1% of price), the offer needs to be $85k (4.5% below list).
- Recommended offer: $81k (9.0% below list) — sets the bar for market timing.
- Cap rate 7.1% vs local median 2.1% in Caneyville — top-decile yield for the area; either an underpriced asset or a hidden risk that comps aren't pricing in. Stress-test before assuming the spread holds.
Location & tenants
- Location reads 68/100 on livability (#182 in KY) — a middle-class / working-renter tenant base. Strengths: crime A+, cost of living A+, housing A+; Watch: amenities F, commute F, employment F.
- Grayson County (rural): math 27% / reading 40% proficiency, ranked #84 of 165 in KY (top 51%) — families likely to look elsewhere, expect single-tenant / working-renter base with shorter leases.
- Zoned schools: Caneyville Elementary School (math 27% / reading 37%, grade F, #348 of 676 statewide, top 55%, 390 students, 71% FRL); Grayson County Middle School (math 23% / reading 38%, grade F, #143 of 217 statewide, top 67%, 839 students, 63% FRL); Grayson County High School (math 24% / reading 38%, grade F, #118 of 254 statewide, top 47%, 1,252 students, 61% FRL).
- Market conditions: 88 active listings in the ZIP; 23 units permitted in Grayson County in 2024 (12 in 5+ unit buildings).
Forward outlook
- Local home prices are declining (-0.9%/yr); year-one equity from $619 of loan paydown is wiped out by about $817 of value loss. Plan a longer hold.
Negotiation context
- It's been on market 112 days — a 9% lower offer ($81k) is reasonable based on typical stale-listing flexibility.
Questions for the listing agent
- It's been on market 112 days. Have you received any prior offers? Is the seller open to a 9% concession, seller financing, or rate buy-down credit?
- Have any recent inspections been done? Can we get a copy of the seller's disclosures and any deferred-maintenance estimates?
- Why hasn't it sold? Are there any deal-killer items the seller is aware of (foundation, flood, title, zoning, code violations)?
- Is there a deadline driving the sale (1031 exchange, divorce, estate, relocation)? That informs how much negotiation room exists.
- Schools are D-rated, which usually means shorter tenancies and higher turnover. Who's the typical renter profile here, and what's been the actual vacancy rate?
- The area grade is low — what's the realistic commute time and amenity access for the typical tenant pool here? Any planned neighborhood developments (good or bad) we should know about?
- What's the average days-on-market for RENTAL listings here right now (not sales)? A rising rental-DOM trend means longer vacancies and softer asking-rent achievability than the comps imply.
- What's the recent tenant-quality profile in this submarket — average credit score on applications, eviction rate, late-payment / NSF rate, and stable-employment percentage? A property-management company in the area should have these aggregated.
- How much new for-sale + rental construction is in the pipeline within 1–3 miles? Heavy new supply typically softens prices + rents 12–24 months out; constrained supply supports both.
Investment metrics
- 1% rule
- 0.95% ✗
- Cap rate
- 7.05%
- Cash-on-cash
- 2.71%
- DSCR
- 1.12
- GRM
- 8.7
CMA / ARV
- ARV (on-the-fly)
- $204,960
- Comps found
- 1
Show comp detail 1 sale within ~0.75 mi
| Address | Dist | Beds/Ba | Sqft | Sold | Price | $/sf | Match |
|---|---|---|---|---|---|---|---|
| 517 Four Seasons Rd | 0.48mi | 2/1.0 | 862 (+3%) | 0mo | $210,000 | $244 | 73 |
Match score weights: distance 35% · size 25% · config 20% · recency 20%. Top-matched comps best support the ARV.
Projected returns pro-forma
-0.91% appreciation · 3.0% rent growth · sell at horizon
- IRR
- -2.5%
- Equity multiple
- 0.89×
- Total profit
- $-2,772
- Equity at exit
- $21,976
- IRR
- 4.1%
- Equity multiple
- 1.40×
- Total profit
- $9,932
- Equity at exit
- $23,394
Cash invested: $25,060 (down + closing). Projections, not guarantees.
Landlord ↔ Tenant lean methodology
- Overall (STATE)
- 83 Strongly Landlord-Friendly
- State Kentucky
- 83 Strongly Landlord-Friendly · R+16
- County
- — inherits STATE
- City
- — inherits STATE
ZIP-level market 40119
- Home prices YoY
- -0.2%
- Active inventory
- 88
- Price-to-rent
- 8.7×
Monthly cashflow live
- Estimated rent
- $855 medium interval (Pro) →
- Mortgage (P&I)
- −$469
- Tax est. 1.5%
- −$112 /mo · $1,342/yr
- Insurance
- −$37
- HOA
- −$0
- Vacancy / Maint / Mgmt
- −$179
- Net cashflow
- $57
Break-even live
Sensitivity live
| Price | -10% $118 | -5% $88 | +0% $57 | +5% $26 | +10% $-5 |
|---|---|---|---|---|---|
| Rent | -10% $-11 | -5% $23 | +0% $57 | +5% $90 | +10% $124 |
| Rate | -1.0pp $102 | -0.5pp $79 | base $57 | +0.5pp $33 | +1.0pp $10 |
UW: 25.0% down · 7.5% · 30yr · 1.5% tax · 5.0% vac · 8.0% maint · 8.0% mgmt
Financing live
Cash to close
- Down payment
- $22,375
- Closing costs
- $2,685
- Reserves months
- —
- Total cash needed
- —
Loan-product check · same deal, 3 products live
Conventional
25% down · 7.5% · 30yr
- Down + closing
- —
- Monthly P&I
- —
- Monthly cashflow
- —
- DSCR
- —
- Eligible?
- —
Personal DTI + credit; lowest rate.
DSCR
20% down · 8.5% · 30yr
- Down + closing
- —
- Monthly P&I
- —
- Monthly cashflow
- —
- DSCR
- —
- Eligible?
- —
No personal income docs; deal must DSCR.
Hard money
10% down · 12.0% · 12mo
- Down + closing
- —
- Monthly P&I
- —
- Monthly cashflow
- —
- DSCR
- —
- Eligible?
- —
Short-term bridge; refi at stabilization.
Listing history 18 events
-
2026-06-21days on market $89,500 Active 112 DOM
-
2026-06-21days on market $89,500 Active 111 DOM
-
2026-06-18days on market $89,500 Active 109 DOM
-
2026-06-17days on market $89,500 Active 108 DOM
-
2026-06-16days on market $89,500 Active 107 DOM
-
2026-06-15days on market $89,500 Active 106 DOM
-
2026-06-13days on market $89,500 Active 104 DOM
-
2026-06-12days on market $89,500 Active 103 DOM
-
2026-06-09days on market $89,500 Active 100 DOM
-
2026-06-08days on market $89,500 Active 99 DOM
-
2026-06-07days on market $89,500 Active 98 DOM
-
2026-06-07days on market $89,500 Active 97 DOM
-
2026-06-04days on market $89,500 Active 94 DOM
-
2026-06-02days on market $89,500 Active 93 DOM
-
2026-06-01days on market $89,500 Active 92 DOM
-
2026-05-31days on market $89,500 Active 91 DOM
-
2026-05-31days on market $89,500 Active 90 DOM
-
2026-03-01$89,500 Active
ⓘ Source: listings_history table (triggers on properties + properties_extension) + one-shot
backfill from property_details.listing_events for pre-trigger history.
Climate risk First Street
- Flood 1/10 Low FEMA zone X (unshaded) · 0% chance over 30 yrs
- Wildfire 3/10 Moderate
- Heat 4/10 Moderate 7 d/yr ≥107°F today · 19 d/yr by 30 yrs out
- Wind 3/10 Moderate 5% chance of damaging wind over 30 yrs
- Air quality 2/10 Low 0 unhealthy d/yr today · 1 by 30 yrs out
Nearby sold comps map
Loading sold comps map…
Walkable amenities ~0.75 mi
Loading nearby amenities…
Taxation est. · year 1
- Rental income
- $10,255
- − Mortgage interest
- −$5,013
- − Property taxes
- −$1,342
- − Insurance
- −$448
- − Repairs & maintenance
- −$820
- − Management
- −$820
- − Depreciation
- −$2,604
- Taxable loss
- −$793
- Est. tax savings @ 24.0%
- +$190
- After-tax cash flow
- $869/yr
For passive investors: Depreciation is non-cash, so a rental often shows a tax loss while cash-flowing — sheltering income. Rental losses are passive: they offset passive income freely, and up to $25,000/yr can offset ordinary (W-2) income if you actively participate and your MAGI is under $100k (phasing out to $0 by $150k); unused losses carry forward. On sale, claimed depreciation is recaptured at up to 25%, and gains may owe capital-gains tax (a 1031 exchange can defer both). Figures are a year-1 estimate at your 24.0% rate — not tax advice; consult a CPA.
Condition & rehab AI · 13 photos
This mobile home requires significant repairs and maintenance, including painting, repairing the siding and roof, and landscaping. The home has potential for a campsite compound, but it needs substantial work to be move-in ready.
Repairs flagged
- Major siding — The siding is peeling and the paint is faded, indicating significant wear and tear.
- Major paint — The paint is faded and peeling, indicating significant wear and tear.
- Major roof — The roof appears to be in fair condition, but there are no visible signs of recent maintenance or repair.
- Major landscaping — The landscaping appears to be in poor condition, with overgrown grass and debris scattered around the property.
Value-add opportunities
- Both painting the exterior and interior — Painting the exterior and interior can significantly improve the home's curb appeal and interior condition, making it more attractive to potential buyers or renters.
- Both repairing the siding and roof — Repairing the siding and roof can improve the home's structural integrity and overall condition, making it more attractive to potential buyers or renters.
- Both landscaping — Landscaping can improve the home's curb appeal and overall condition, making it more attractive to potential buyers or renters.
Renovation cost estimate screening
| Repair item | Severity | Est. cost |
|---|---|---|
| siding · The siding is peeling and the paint is faded, indicating significant wear and tear. | Major | $15,000–50,000 |
| paint · The paint is faded and peeling, indicating significant wear and tear. | Major | $15,000–50,000 |
| roof · The roof appears to be in fair condition, but there are no visible signs of recent maintenance or repair. | Major | $15,000–50,000 |
| landscaping · The landscaping appears to be in poor condition, with overgrown grass and debris scattered around the property. | Major | $15,000–50,000 |
| Total estimated repair cost · 4 items | $60,000–200,000 |
Value-add ROI direction
- Both painting the exterior and interior — Painting the exterior and interior can significantly improve the home's curb appeal and interior condition, making it more attractive to potential buyers or renters. ↑
- Both repairing the siding and roof — Repairing the siding and roof can improve the home's structural integrity and overall condition, making it more attractive to potential buyers or renters. ↑
- Both landscaping — Landscaping can improve the home's curb appeal and overall condition, making it more attractive to potential buyers or renters. ↑
ⓘ Cost ranges are severity-bucket heuristics (US national rule-of-thumb). Get contractor quotes + a written scope before underwriting a rehab budget.
Schools (NCES district)
- District
- Grayson County
- NCES district ID
- 2102300
- Math proficiency
- 27% ▼ -23.00%
- Reading proficiency
- 40% ▼ -17.00%
- Median HH income
- $34,256
- Composite
- 27.55/100
- National rank
- #6944
- State rank
- #84 of 165 in KY
Livability — Caneyville
- Score
- 68/100
- State rank
- #182
- US rank
- #9075
Category grades
Schools grade is shown separately in the Schools card above.
Census & demographics
- City population
- 4,302
- Population (ZIP)
- 2,071
Population outlook (Grayson County) Hauer SSP2
- Today (2025)
- 26,840 people
- By 2030
- 27,032 · +0.7%
- By 2040
- 27,236 · +1.5%
- By 2050
- 27,076 · +0.9%
- By 2075
- 26,565 · -1.0%
- By 2100
- 24,007 · -10.6%
Race, ethnicity, and origin ACS 2023
- Neighborhood character
- Predominantly White (96%)
- Race & ethnicity
- White 96% Two or more races 2% Hispanic / Latino 2%
- Common ancestry
- Romanian 5% Slovak 3% Serbian 2%
- Languages at home
- 98% English-only · Spanish 2%
Political lean MEDSL · Grayson
- 2024 margin
- Solid R (+61.8) · D 18.5% · R 80.3% · Other 1.2%
- 2008→2024 swing
- -26.9pp toward R · 2008: -34.9pp · 2024: -61.8pp
- All cycles
- 2024: R+61.8 2020: R+58.8 2016: R+59.3 2012: R+39.5 2008: R+34.9
Not yet ingested
- Civics
- —
Market trends
- HPI YoY
- ▼ -0.91%
- Current HPI
- 363.2314
- Rent YoY
- —
- Metro
- —
- State GDP YoY
- ▲ 1.81%
- F500 in state
- 4
Industry mix (Fortune 500 HQ in KY)
| Industry | F500 HQs | Revenue |
|---|---|---|
| Healthcare | 1 | $118B |
|
||
| Food / Beverage | 1 | $7B |
|
||
Price history
1 event — show timeline
- 2026-03-01 Listed $89,500 Metro Search MLS
Cash-flow waterfall
monthlySold comps — $/sqft
last 12 mo · ≤1 miLoading sold comps…