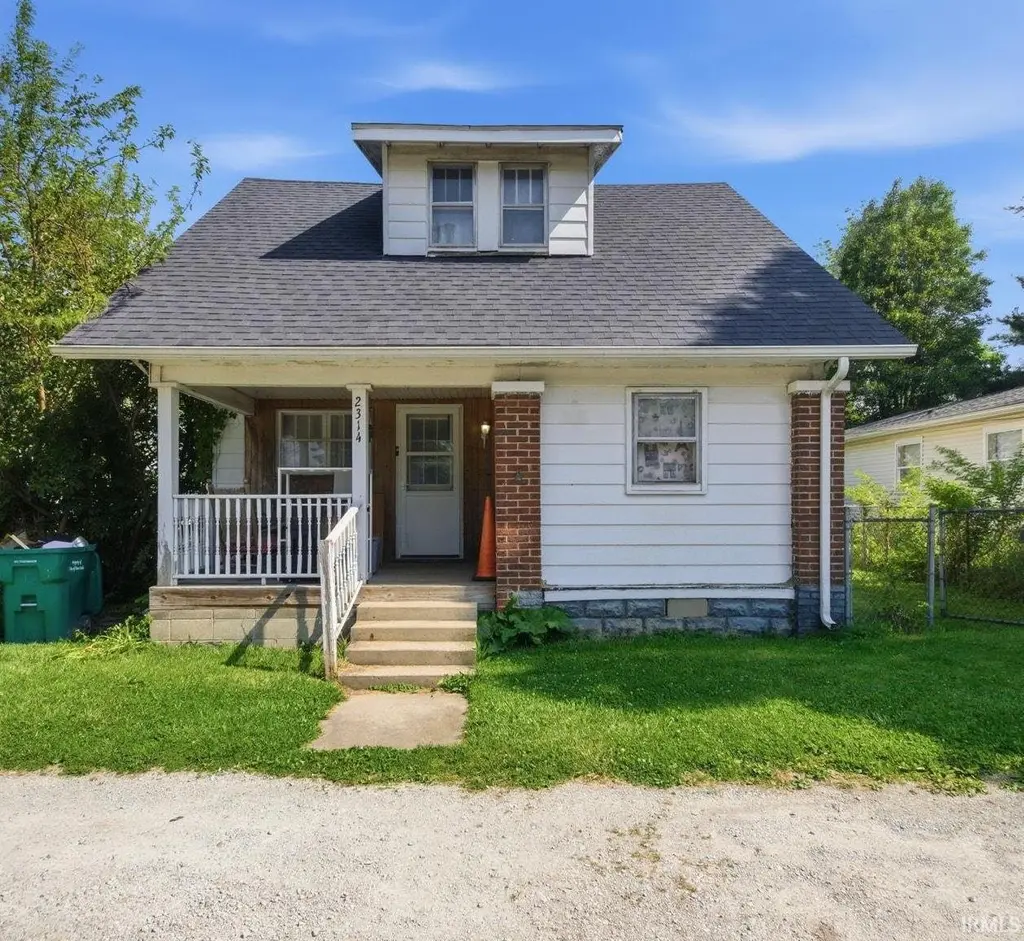
2314 H Ave · New Castle, IN
Flood risk 1/10 · Minimal
- FEMA flood zone
- X (unshaded)
- Chance of flooding over 30 yrs
- 0.0%
- Est. flood insurance / yr
- $473 – $860
Fire risk 1/10 · Minimal
- Est. fire insurance / yr
- $717 – $1,331
Heat risk 3/10 · Minor
- Hot days now (above 99°F)
- 7 days/yr
- Hot days in 30 yrs
- 18 days/yr
Wind risk 2/10 · Minimal
- Chance of severe wind over 30 yrs
- 1.0%
Air-quality risk 2/10 · Minimal
- Unhealthy air days now
- 1 days/yr
- Unhealthy air days in 30 yrs
- 2 days/yr
Risk factors via First Street. Map © Google.
Why this score? — see what drove the B grade
The composite is a weighted blend of 9 inputs, each scored 0–100. Each bar is that input's sub-score; the figure is the points it added to the 100-point composite (weight × sub-score).
- Cash flow +30.0/30.0
- 1% rule +10.0/10.0
- DSCR +10.0/10.0
- ARV discount +7.5/15.0
- Livability +3.8/5.0
- Rent growth +3.6/5.0
- Schools +2.7/10.0
- Condition / age +2.5/5.0
- Appreciation +0.0/10.0
$50,000
🖨 Deal sheet 📄 Offer letter ✓ Due diligence
Listing remarks MLS
Discover a unique opportunity at 2314 H AVE. This charming 1.5-story single family residence, built in 1900, offers 1206 square feet of living space, blending historic character with modern potential. The property features two comfortable bedrooms and a bonus room downstairs that can be used as another bedroom or an office. A single full bathroom is located on the upper floor. Set on a generous 5924 square foot lot, this property offers ample outdoor space for various activities and is also fenced in with chain link. To experience the unique charm and potential of this property.
Key facts
- Ample outdoor space
- Modern potential
- Fenced in
Tags
Property features AI
Exterior
- Parking: No parking details provided
- Security: No security features provided
- Utilities: Public water; Municipal sewer connected; Local solid waste service
- Home design: Single-family residence; One-and-one-half story
- Construction: Aluminum siding; Block foundation
- Exterior features: Lot under 1/4 acre (approximately 0.14 acres)
Interior
- Kitchen: Kitchen on main level (18 x 9); No appliances listed
- Bedrooms: Two upper-level bedrooms (11 x 11 and 11 x 9)
- Flooring: No flooring details provided
- Bathrooms: One full bathroom (upper level)
- Heating & cooling: Forced air heating; No central cooling
- Interior features: Finished main and upper living areas; Bonus room on the main level; Basement present
- Laundry & utility: No specific laundry appliances listed
Neighborhood map
What this means for you Summary
Snapshot
- This is a 2-bed/1.0-bath single-family listed at $50k.
Deal economics
- At list price, monthly cash flow is $440 ($5k/yr) — positive.
- The deal already cash-flows at list — no discount required.
- Meets the 1% rule at list price ($975 rent vs $50k).
- Recommended offer: $49k (1.5% below list) — sets the bar for market timing.
- Cap rate 16.8% vs local median 4.8% in New Castle — top-decile yield for the area; either an underpriced asset or a hidden risk that comps aren't pricing in. Stress-test before assuming the spread holds.
Location & tenants
- Location reads 75/100 on livability (#64 in IN, #4,219 nationally) — a middle-class / working-renter tenant base. Strengths: crime A+, cost of living A+, housing A+; Watch: amenities F, commute F, employment D-.
- New Castle Community School Corporation (town): math 30% / reading 35% proficiency, ranked #229 of 301 in IN (top 76%) — families likely to look elsewhere, expect single-tenant / working-renter base with shorter leases.
- Zoned schools: Eastwood Elementary School (math 32% / reading 27%, grade F, #697 of 994 statewide, top 73%, 274 students, 82% FRL); New Castle High School (math 27% / reading 52%, grade F, #221 of 369 statewide, top 63%, 836 students, 56% FRL) — zoned schools average 69% FRL vs 52% district-wide (17 pts higher); higher-poverty schools than district average — tighter screening recommended.
- Market conditions: Rents rising fast (+4.6%/yr); 214 active listings in the ZIP; 3 comparable units currently listed for rent nearby; rentals leasing fast (median 2d on market — plan ~1-2 weeks tenant-placement turnaround); 47 units permitted in Henry County in 2024 (0 in 5+ unit buildings).
Forward outlook
- Local home prices are declining (-3.0%/yr); year-one equity from $346 of loan paydown is wiped out by about $2k of value loss. Plan a longer hold.
- Henry County population projected at -12% by 2050 — secular population decline; favor cash flow + early exit over multi-decade hold.
- At projected returns (-3.0% appreciation + 4.6% rent growth), your $14k cash investment doubles in ~4 years — after that, you're playing with house money.
Negotiation context
- It's been on market 15 days — a 2% lower offer ($49k) is reasonable based on typical stale-listing flexibility.
- 3 sale attempts since 18y ago; this cycle's ask has dropped $10k (17%) from the opening price — seller is motivated, your offer sets the floor, not the list.
- Current owner paid $10k; list at $50k implies a 400% gain — meaningful room to come down on a strong offer.
Risks & watch-outs
- Watch-outs: built in 1900 — expect roof / HVAC / electrical / plumbing capex.
Questions for the listing agent
- Built in 1900 — when were the roof, HVAC, electrical panel, plumbing, and water heater last replaced?
- Is there a deadline driving the sale (1031 exchange, divorce, estate, relocation)? That informs how much negotiation room exists.
- Schools are D-rated, which usually means shorter tenancies and higher turnover. Who's the typical renter profile here, and what's been the actual vacancy rate?
- What's the average days-on-market for RENTAL listings here right now (not sales)? A rising rental-DOM trend means longer vacancies and softer asking-rent achievability than the comps imply.
- What's the recent tenant-quality profile in this submarket — average credit score on applications, eviction rate, late-payment / NSF rate, and stable-employment percentage? A property-management company in the area should have these aggregated.
- How much new for-sale + rental construction is in the pipeline within 1–3 miles? Heavy new supply typically softens prices + rents 12–24 months out; constrained supply supports both.
Investment metrics
- 1% rule
- 1.95% ✓
- Cap rate
- 16.85%
- Cash-on-cash
- 37.70%
- DSCR
- 2.68
- GRM
- 4.3
CMA / ARV
- ARV (on-the-fly)
- $124,218
- Comps found
- 12
Show comp detail 12 sales within ~0.75 mi
| Address | Dist | Beds/Ba | Sqft | Sold | Price | $/sf | Match |
|---|---|---|---|---|---|---|---|
| 2302 I Ave | 0.06mi | 3/1.5 (+1) | 1,216 (+1%) | 6mo | $144,900 | $119 | 84 |
| 1007 S 24th St | 0.30mi | 2/1.0 | 1,150 (-5%) | 6mo | $30,000 | $26 | 73 |
| 1603 C Ave | 0.56mi | 2/1.0 | 1,204 (-0%) | 1mo | $47,500 | $39 | 73 |
| 1126 S 17th St | 0.43mi | 3/1.0 (+1) | 1,163 (-4%) | 3mo | $139,000 | $120 | 67 |
| 2514 S 23rd St | 0.65mi | 3/1.0 (+1) | 1,164 (-4%) | 2mo | $90,000 | $77 | 57 |
| 626 S 21st St | 0.56mi | 2/1.0 | 1,288 (+7%) | 7mo | $138,000 | $107 | 57 |
| 236 S 24th St | 0.73mi | 3/1.0 (+1) | 1,240 (+3%) | 6mo | $125,000 | $101 | 51 |
| 324 Park Ave | 0.68mi | 2/1.0 | 1,296 (+8%) | 9mo | $45,700 | $35 | 48 |
| 2014 Roosevelt Ave | 0.72mi | 2/1.0 | 1,344 (+11%) | 0mo | $138,000 | $103 | 47 |
| 2117 Cherrywood Ave | 0.69mi | 2/1.0 | 1,088 (-10%) | 6mo | $112,000 | $103 | 47 |
| 2105 Cherrywood Ave | 0.67mi | 2/1.0 | 1,080 (-10%) | 8mo | $145,000 | $134 | 44 |
| 2601 Maple Dr | 0.60mi | 3/2.0 (+1) | 1,332 (+10%) | 5mo | $172,000 | $129 | 42 |
Match score weights: distance 35% · size 25% · config 20% · recency 20%. Top-matched comps best support the ARV.
Projected returns pro-forma
-3.0% appreciation · 4.59% rent growth · sell at horizon
- IRR
- 35.5%
- Equity multiple
- 2.54×
- Total profit
- $21,499
- Equity at exit
- $7,455
- IRR
- 43.0%
- Equity multiple
- 5.39×
- Total profit
- $61,526
- Equity at exit
- $4,323
Cash invested: $14,000 (down + closing). Projections, not guarantees.
Landlord ↔ Tenant lean methodology
- Overall (STATE)
- 90 Strongly Landlord-Friendly
- State Indiana
- 90 Strongly Landlord-Friendly · R+11
- County
- — inherits STATE
- City
- — inherits STATE
ZIP-level market 47362
- Home prices YoY
- -16.0%
- Rents YoY
- 4.6%
- Active inventory
- 214
- Price-to-rent
- 4.3×
Monthly cashflow live
- Estimated rent
- $975 medium interval (Pro) →
- Mortgage (P&I)
- −$262
- Tax from tax record
- −$47 /mo · $566/yr
- Insurance
- −$21
- HOA
- −$0
- Vacancy / Maint / Mgmt
- −$205
- Net cashflow
- $440
Break-even live
UW: 25.0% down · 7.5% · 30yr · 1.5% tax · 5.0% vac · 8.0% maint · 8.0% mgmt
Financing live
Cash to close
- Down payment
- $12,500
- Closing costs
- $1,500
- Reserves months
- —
- Total cash needed
- —
Loan-product check · same deal, 3 products live
Conventional
25% down · 7.5% · 30yr
- Down + closing
- —
- Monthly P&I
- —
- Monthly cashflow
- —
- DSCR
- —
- Eligible?
- —
Personal DTI + credit; lowest rate.
DSCR
20% down · 8.5% · 30yr
- Down + closing
- —
- Monthly P&I
- —
- Monthly cashflow
- —
- DSCR
- —
- Eligible?
- —
No personal income docs; deal must DSCR.
Hard money
10% down · 12.0% · 12mo
- Down + closing
- —
- Monthly P&I
- —
- Monthly cashflow
- —
- DSCR
- —
- Eligible?
- —
Short-term bridge; refi at stabilization.
Rent comps 3 comps
| Address | Beds | Baths | Sqft | Rent | $/sqft | DOM | Units | Dist |
|---|---|---|---|---|---|---|---|---|
| 1216 S 19th St New Castle, IN | 2.0 | 1.0 | 824 | $1,000 | $1.21 | 23d | 1 | 0.28mi |
| 940 S 15th St New Castle, IN | 1.0–2.0 | 1.0–1.5 | 816 | $1,075 | $1.32 | 1d | 2 | 0.59mi |
| 1618 P Ave New Castle, IN | 3.0 | 1.5 | 1064 | $950 | $0.89 | 1d | 1 | 0.66mi |
Listing history 10 events
-
2026-06-05status $50,000 Pending 15 DOM
-
2026-06-03days on market $50,000 Active 15 DOM
-
2026-06-02days on market $50,000 Active 14 DOM
-
2026-06-01days on market $50,000 Active 13 DOM
-
2026-05-31days on market $50,000 Active 12 DOM
-
2026-05-30days on market $50,000 Active 11 DOM
-
2026-05-19$60,000 Active 585-char remark
Show marketing remark (585 chars)
Discover a unique opportunity at 2314 H AVE. This charming 1.5-story single family residence, built in 1900, offers 1206 square feet of living space, blending historic character with modern potential. The property features two comfortable bedrooms and a bonus room downstairs that can be used as another bedroom or an office. A single full bathroom is located on the upper floor. Set on a generous 5924 square foot lot, this property offers ample outdoor space for various activities and is also fenced in with chain link. To experience the unique charm and potential of this property.
-
2026-05-18$60,000 Active
-
2008-09-10soldstatus $10,000
-
2008-07-25$10,900
ⓘ Source: listings_history table (triggers on properties + properties_extension) + one-shot
backfill from property_details.listing_events for pre-trigger history.
Tax reassessment forecast IN · Partial reset (capped growth)
- Current annual tax
- $566 · $47/mo
- Projected year-2 tax
- $566 · $47/mo
- Expected delta
- $0/yr ($0/mo · 0.0%)
ⓘ Screening estimate from a state-policy table — verify with the county assessor before closing.
Climate risk First Street
- Flood 1/10 Low FEMA zone X (unshaded) · 0% chance over 30 yrs
- Wildfire 1/10 Low
- Heat 3/10 Moderate 7 d/yr ≥99°F today · 18 d/yr by 30 yrs out
- Wind 2/10 Low 100% chance of damaging wind over 30 yrs
- Air quality 2/10 Low 1 unhealthy d/yr today · 2 by 30 yrs out
Nearby sold comps map
Loading sold comps map…
Walkable amenities ~0.75 mi
Loading nearby amenities…
Taxation est. · year 1
- Rental income
- $11,696
- − Mortgage interest
- −$2,801
- − Property taxes
- −$566
- − Insurance
- −$250
- − Repairs & maintenance
- −$936
- − Management
- −$936
- − Depreciation
- −$1,455
- Taxable income
- $4,754
- Est. tax owed @ 24.0%
- −$1,141
- After-tax cash flow
- $4,137/yr
For passive investors: Depreciation is non-cash, so a rental often shows a tax loss while cash-flowing — sheltering income. Rental losses are passive: they offset passive income freely, and up to $25,000/yr can offset ordinary (W-2) income if you actively participate and your MAGI is under $100k (phasing out to $0 by $150k); unused losses carry forward. On sale, claimed depreciation is recaptured at up to 25%, and gains may owe capital-gains tax (a 1031 exchange can defer both). Figures are a year-1 estimate at your 24.0% rate — not tax advice; consult a CPA.
Schools (NCES district)
- District
- New Castle Community School Corporation
- NCES district ID
- 1807440
- Math proficiency
- 30% ▼ -13.00%
- Reading proficiency
- 35% ▼ -9.00%
- Median HH income
- $36,717
- Composite
- 26.99/100
- National rank
- #7067
- State rank
- #229 of 301 in IN
Livability — New Castle
- Score
- 75/100
- State rank
- #64
- US rank
- #4219
Category grades
Schools grade is shown separately in the Schools card above.
Census & demographics
- Census place
- New Castle, IN
- County
- Henry County · 29,337 people
- City population
- 29,337
- Metro
- New Castle, IN
- Population (ZIP)
- 29,337
- Household income
- $60,258
- Rent vs Own
- Severe rent burden
- 545.0
Population outlook (Henry County) Hauer SSP2
- Today (2025)
- 48,028 people
- By 2030
- 47,125 · -1.9%
- By 2040
- 44,820 · -6.7%
- By 2050
- 42,207 · -12.1%
- By 2075
- 35,814 · -25.4%
- By 2100
- 26,779 · -44.2%
Race, ethnicity, and origin ACS 2023
- Neighborhood character
- Predominantly White (90%)
- Race & ethnicity
- White 90% Two or more races 3% Black 3% Hispanic / Latino 3%
- Common ancestry
- Italian 2% Slovak 1% Lithuanian 1%
- Foreign-born
- 2% · Canada
- Languages at home
- 97% English-only · Spanish 2%
Political lean MEDSL · Henry
- 2024 margin
- Solid R (+47.7) · D 25.3% · R 73.0% · Other 1.7%
- 2008→2024 swing
- -43.8pp toward R · 2008: -3.9pp · 2024: -47.7pp
- All cycles
- 2024: R+47.7 2020: R+45.2 2016: R+43.7 2012: R+17.0 2008: R+3.9
Not yet ingested
- Civics
- —
Market trends
- HPI YoY
- ▼ -43.70%
- Current HPI
- 228.8885
- Rent YoY
- ▲ 4.59%
- Metro
- New Castle, IN
- State GDP YoY
- ▲ 2.90%
- F500 in state
- 18
Industry mix (Fortune 500 HQ in IN)
| Industry | F500 HQs | Revenue |
|---|---|---|
| Industrial Machinery | 2 | $37B |
|
||
| Healthcare | 1 | $177B |
|
||
| Pharmaceuticals | 1 | $45B |
|
||
| Metals / Steel | 1 | $18B |
|
||
| Agriculture | 1 | $17B |
|
||
| Packaging | 1 | $12B |
|
||
Price history
+450.5% since first listed4 events — show timeline
- 2026-05-19 Listed $60,000 IRMLS
- 2026-05-18 Listed $60,000 MIBOR as Distributed by MLS Grid
- 2008-09-10 Sold (MLS) $10,000 MIBOR as Distributed by MLS Grid
- 2008-07-25 Listed $10,900 MIBOR as Distributed by MLS Grid
Property tax history
+4.8%/yrLatest (2024): $566 · +12.5% YoY. Source: county tax records.
Cash-flow waterfall
monthlySold comps — $/sqft
last 12 mo · ≤1 miLoading sold comps…