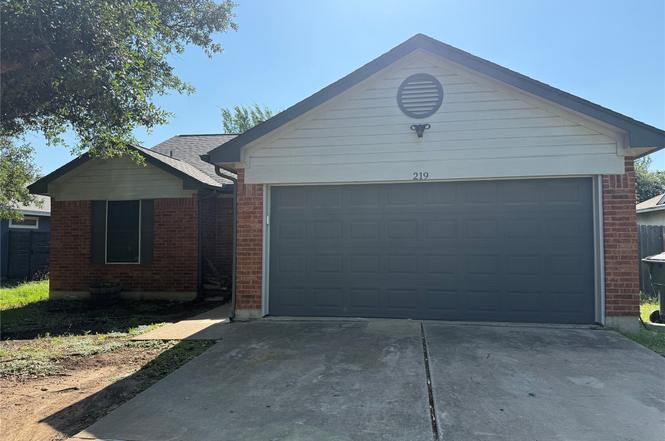
219 Juniper Dr · Georgetown, TX
Flood risk 1/10 · Minimal
- FEMA flood zone
- X (unshaded)
- Chance of flooding over 30 yrs
- 0.0%
- Est. flood insurance / yr
- $507 – $1,088
Fire risk 4/10 · Minor
- Est. fire insurance / yr
- $1,222 – $2,270
Heat risk 8/10 · Major
- Hot days now (above 107°F)
- 7 days/yr
- Hot days in 30 yrs
- 23 days/yr
Wind risk 6/10 · Moderate
- Chance of severe wind over 30 yrs
- 77.0%
Air-quality risk 2/10 · Minimal
- Unhealthy air days now
- 1 days/yr
- Unhealthy air days in 30 yrs
- 1 days/yr
Risk factors via First Street. Map © Google.
Why this score? — see what drove the D+ grade
The composite is a weighted blend of 9 inputs, each scored 0–100. Each bar is that input's sub-score; the figure is the points it added to the 100-point composite (weight × sub-score).
- ARV discount +15.0/15.0
- Cash flow +12.9/30.0
- 1% rule +4.5/10.0
- Livability +4.1/5.0
- DSCR +3.9/10.0
- Schools +3.2/10.0
- Condition / age +2.5/5.0
- Rent growth +1.6/5.0
- Appreciation +0.0/10.0
$195,000
🖨 Deal sheet 📄 Offer letter ✓ Due diligence
Listing remarks MLS
Restrictions: Yes
Key facts
- 6,098 sq ft lot
- 2 garage spots
- Built 1997
Neighborhood map
What this means for you Summary
Snapshot
- This is a 3-bed/2.0-bath single-family listed at $195k.
Deal economics
- At list price, monthly cash flow is $-15 ($-182/yr) — negative.
- To cash-flow at today's rent, offer at most $192k (1.4% below list).
- To meet the 1% rule (rent ≥ 1% of price), the offer needs to be $186k (4.8% below list).
- Recommended offer: $172k (12.0% below list) — sets the bar for market timing.
- Cap rate 6.2% vs local median 2.4% in Georgetown — top-decile yield for the area; either an underpriced asset or a hidden risk that comps aren't pricing in. Stress-test before assuming the spread holds.
Location & tenants
- Location reads 82/100 on livability (#18 in TX, #1,294 nationally) — a professional / high-income tenant draw. Strengths: amenities A+, housing A+, health & safety A+; Watch: commute F.
- Georgetown ISD (suburban): math 31% / reading 38% proficiency, ranked #474 of 826 in TX (top 57%) — families likely to look elsewhere, expect single-tenant / working-renter base with shorter leases.
- Market conditions: Rents falling (-3.5%/yr); 561 active listings in the ZIP; 27 comparable units currently listed for rent nearby; rentals at typical pace (median 18d on market — plan ~3-4 weeks tenant-placement turnaround); solid renter incomes; 7,543 units permitted in Williamson County in 2024 (1,425 in 5+ unit buildings).
Forward outlook
- Local home prices are declining (-3.0%/yr); year-one equity from $1k of loan paydown is wiped out by about $6k of value loss. Plan a longer hold.
- Williamson County population projected at +69% by 2050 — long-run rental-demand tailwind backs the buy-and-hold thesis.
Negotiation context
- It's been on market 133 days — a 12% lower offer ($172k) is reasonable based on typical stale-listing flexibility.
- 3 sale attempts since 29y ago with the ask held roughly flat each time — persistent listings suggest the price (not the market) is what's stuck; bring a comps-based counter.
Risks & watch-outs
- Climate carrying-cost: major wind risk, 77% chance of damaging wind over 30y; extreme-heat days projected 7→23/yr by 2055 (HVAC capex compounding) — expect insurance premiums to compound above CPI over the hold.
Questions for the listing agent
- What do current leases actually rent for vs. the listed asking? Can we see a recent rent roll and the last 12 months of T-12 income?
- It's been on market 133 days. Have you received any prior offers? Is the seller open to a 12% concession, seller financing, or rate buy-down credit?
- What does the HOA fee cover, when was the last increase, and are there any pending special assessments or reserve-fund shortfalls?
- Why hasn't it sold? Are there any deal-killer items the seller is aware of (foundation, flood, title, zoning, code violations)?
- Is there a deadline driving the sale (1031 exchange, divorce, estate, relocation)? That informs how much negotiation room exists.
- The area grade is low — what's the realistic commute time and amenity access for the typical tenant pool here? Any planned neighborhood developments (good or bad) we should know about?
- What's the average days-on-market for RENTAL listings here right now (not sales)? A rising rental-DOM trend means longer vacancies and softer asking-rent achievability than the comps imply.
- What's the recent tenant-quality profile in this submarket — average credit score on applications, eviction rate, late-payment / NSF rate, and stable-employment percentage? A property-management company in the area should have these aggregated.
- How much new for-sale + rental construction is in the pipeline within 1–3 miles? Heavy new supply typically softens prices + rents 12–24 months out; constrained supply supports both.
Investment metrics
- 1% rule
- 0.95% ✗
- Cap rate
- 6.20%
- Cash-on-cash
- -0.33%
- DSCR
- 0.99
- GRM
- 8.8
CMA / ARV
- ARV (on-the-fly)
- $307,510
- Comps found
- 12
Show comp detail 12 sales within ~0.75 mi
| Address | Dist | Beds/Ba | Sqft | Sold | Price | $/sf | Match |
|---|---|---|---|---|---|---|---|
| 214 Juniper Dr | 0.04mi | 3/2.0 | 1,274 (-5%) | 0mo | $234,500 | $184 | 90 |
| 100 Evergreen Cir | 0.05mi | 4/2.0 (+1) | 1,367 (+2%) | 7mo | $275,000 | $201 | 83 |
| 516 Jefferson Ln | 0.12mi | 3/2.0 | 1,397 (+4%) | 5mo | $250,000 | $179 | 83 |
| 227 Juniper Dr | 0.04mi | 3/2.0 | 1,355 (+1%) | 16mo | $309,900 | $229 | 83 |
| 215 Crystal Knoll Blvd | 0.17mi | 3/2.0 | 1,355 (+1%) | 10mo | $315,000 | $232 | 82 |
| 530 Jefferson Ln | 0.06mi | 3/2.0 | 1,355 (+1%) | 21mo | $307,395 | $227 | 78 |
| 202 Juniper Dr | 0.10mi | 4/2.0 (+1) | 1,368 (+2%) | 15mo | $315,000 | $230 | 74 |
| 105 Aspen Trl | 0.16mi | 3/2.0 | 1,290 (-4%) | 16mo | $299,000 | $232 | 73 |
| 124 Azalea Dr | 0.10mi | 3/2.0 | 1,216 (-9%) | 12mo | $299,000 | $246 | 70 |
| 600 County Road 152 | 0.27mi | 3/2.0 | 1,480 (+11%) | 2mo | $399,999 | $270 | 68 |
| 906 Jasmine Trl | 0.18mi | 3/2.0 | 1,188 (-11%) | 14mo | $240,000 | $202 | 61 |
| 470 County Road 152 | 0.27mi | 3/2.0 | 1,489 (+11%) | 10mo | $400,000 | $269 | 60 |
Match score weights: distance 35% · size 25% · config 20% · recency 20%. Top-matched comps best support the ARV.
Projected returns pro-forma
-3.0% appreciation · 0.0% rent growth · sell at horizon
- IRR
- -20.6%
- Equity multiple
- 0.31×
- Total profit
- $-37,892
- Equity at exit
- $29,075
- IRR
- -23.6%
- Equity multiple
- -0.00×
- Total profit
- $-54,813
- Equity at exit
- $16,860
Cash invested: $54,600 (down + closing). Projections, not guarantees.
Landlord ↔ Tenant lean methodology
- Overall (STATE)
- 87 Strongly Landlord-Friendly
- State Texas
- 87 Strongly Landlord-Friendly · R+5
- County
- — inherits STATE
- City
- — inherits STATE
ZIP-level market 78626
- Rents YoY
- -3.5%
- Active inventory
- 561
- Price-to-rent
- 8.8×
Monthly cashflow live
- Estimated rent
- $1,856 high interval (Pro) →
- Mortgage (P&I)
- −$1,023
- Tax from tax record
- −$370 /mo · $4,437/yr
- Insurance
- −$81
- HOA
- −$8
- Vacancy / Maint / Mgmt
- −$390
- Net cashflow
- $-15
Break-even live
UW: 25.0% down · 7.5% · 30yr · 1.5% tax · 5.0% vac · 8.0% maint · 8.0% mgmt
Financing live
Cash to close
- Down payment
- $48,750
- Closing costs
- $5,850
- Reserves months
- —
- Total cash needed
- —
Loan-product check · same deal, 3 products live
Conventional
25% down · 7.5% · 30yr
- Down + closing
- —
- Monthly P&I
- —
- Monthly cashflow
- —
- DSCR
- —
- Eligible?
- —
Personal DTI + credit; lowest rate.
DSCR
20% down · 8.5% · 30yr
- Down + closing
- —
- Monthly P&I
- —
- Monthly cashflow
- —
- DSCR
- —
- Eligible?
- —
No personal income docs; deal must DSCR.
Hard money
10% down · 12.0% · 12mo
- Down + closing
- —
- Monthly P&I
- —
- Monthly cashflow
- —
- DSCR
- —
- Eligible?
- —
Short-term bridge; refi at stabilization.
Rent comps 27 comps
| Address | Beds | Baths | Sqft | Rent | $/sqft | DOM | Units | Dist |
|---|---|---|---|---|---|---|---|---|
| 300 Caladium Ct Georgetown, TX | 3.0 | 2.0 | 1246 | $1,725 | $1.38 | 24d | 1 | 0.19mi |
| 1004 Drovers Cv Georgetown, TX | 3.0 | 2.0 | 1064 | $1,550 | $1.46 | 14d | 1 | 0.28mi |
| 1036 Drovers Cv Georgetown, TX | 3.0 | 2.5 | 1340 | $1,625 | $1.21 | 43d | 1 | 0.33mi |
| 1018 Trail Driver Cv Georgetown, TX | 3.0 | 2.0 | 1040 | $1,395 | $1.34 | 3d | 1 | 0.34mi |
| 3001 NE Inner Loop Georgetown, TX | 1.0–3.0 | 1.0–2.0 | 1024 | $1,890 | $1.85 | 2d | 40 | 0.36mi |
| 2601 N Austin Ave Georgetown, TX | 3.0 | 1.0–3.0 | 1111 | $2,083 | $1.87 | 1d | 43 | 0.47mi |
| 190 Prairie Springs Loop Georgetown, TX | 3.0 | 2.5 | 1660 | $1,845 | $1.11 | 22d | 1 | 0.83mi |
| 111 Prairie Springs Cv Georgetown, TX | 2.0 | 2.0 | 1060 | $1,600 | $1.51 | 43d | 1 | 0.84mi |
| 450 Parkline Dr Georgetown, TX | 3.0 | 2.0 | 1424 | $2,100 | $1.47 | 24d | 1 | 0.95mi |
| 226 Claris Ln Georgetown, TX | 3.0 | 2.0 | 1190 | $2,195 | $1.84 | 14d | 1 | 0.99mi |
| 624 Parkline Dr Georgetown, TX | 3.0 | 2.0 | 1475 | $1,850 | $1.25 | 11d | 1 | 0.99mi |
| 415 Parkline Dr Georgetown, TX | 2.0 | 2.5 | 1317 | $1,900 | $1.44 | 43d | 1 | 1.01mi |
| 401 Parkline DR Unit 1A Georgetown, TX | 3.0 | 2.5 | 1517 | $1,950 | $1.29 | 2d | 1 | 1.02mi |
| 901 Big Rocky Bnd Georgetown, TX | 3.0–4.0 | 2.0–2.5 | 1608 | $1,949 | $1.21 | 1d | 1 | 1.03mi |
| 634 River Bluff Cir Georgetown, TX | 3.0 | 2.0 | 1832 | $2,100 | $1.15 | 22d | 1 | 1.11mi |
| 634 River Bluff Cir Georgetown, TX | 3.0 | 2.0 | 1832 | $2,100 | $1.15 | 24d | 1 | 1.11mi |
| 1012 Boons Crk Georgetown, TX | 3.0 | 2.0 | 1440 | $2,144 | $1.49 | 2d | 1 | 1.12mi |
| 115 Stone Mountain Rd Georgetown, TX | 3.0–4.0 | 2.5 | 1705 | $2,324 | $1.36 | 20d | 1 | 1.14mi |
| 110 Benchmark St Georgetown, TX | 2.0 | 2.0 | 1726 | $1,750 | $1.01 | 17d | 1 | 1.15mi |
| 2111 N Austin Ave Georgetown, TX | 1.0–3.0 | 1.0–2.0 | 911 | $1,818 | $2.00 | 2d | 20 | 1.15mi |
| 408 Buckners St Georgetown, TX | 4.0 | 2.0 | 1627 | $2,149 | $1.32 | 14d | 1 | 1.17mi |
| 501 Big Rocky Bnd Georgetown, TX | 4.0 | 2.0 | 1627 | $2,324 | $1.43 | 43d | 1 | 1.20mi |
| 128 Saguaro Trl Georgetown, TX | 3.0 | 2.0 | 1440 | $1,990 | $1.38 | 43d | 1 | 1.25mi |
| 108 Rio Vista Dr Georgetown, TX | 3.0 | 2.0 | 1610 | $1,850 | $1.15 | 43d | 1 | 1.30mi |
| 1301 NE Inner Loop Georgetown, TX | 4.0 | 2.0 | 1627 | $2,170 | $1.33 | 24d | 1 | 1.31mi |
| 800 E Central Dr Georgetown, TX | 3.0 | 2.0 | 1292 | $1,750 | $1.35 | 17d | 1 | 1.49mi |
| 1617 Northwest Blvd Apt 112 Georgetown, TX | 3.0 | 2.0 | 1198 | $1,274 | $1.06 | 17d | 1 | 1.49mi |
HOA detail
- Monthly dues
- $8 · $96/yr
Listing history 12 events
-
2025-12-09status Pending
-
2025-08-05historical Active Under Contract
-
2025-07-29$195,000 Active
-
2025-05-07soldstatus
-
2020-12-09soldstatus
-
2000-09-01soldstatus
-
2000-08-31soldstatus 17-char remark
Show marketing remark (17 chars)
Restrictions: Yes
-
2000-08-07historical 17-char remark
Show marketing remark (17 chars)
Restrictions: Yes
-
2000-07-17$99,000 17-char remark
Show marketing remark (17 chars)
Restrictions: Yes
-
1997-10-24soldstatus 17-char remark
Show marketing remark (17 chars)
Restrictions: Yes
-
1997-10-14historical 17-char remark
Show marketing remark (17 chars)
Restrictions: Yes
-
1997-05-12$84,546 17-char remark
Show marketing remark (17 chars)
Restrictions: Yes
ⓘ Source: listings_history table (triggers on properties + properties_extension) + one-shot
backfill from property_details.listing_events for pre-trigger history.
Tax reassessment forecast TX · Resets to sale price
- Current annual tax
- $4,437 · $370/mo
- Projected year-2 tax
- $4,437 · $370/mo
- Expected delta
- $0/yr ($0/mo · 0.0%)
ⓘ Screening estimate from a state-policy table — verify with the county assessor before closing.
Climate risk First Street
- Flood 1/10 Low FEMA zone X (unshaded) · 0% chance over 30 yrs
- Wildfire 4/10 Moderate
- Heat 8/10 Severe 7 d/yr ≥107°F today · 23 d/yr by 30 yrs out
- Wind 6/10 Major 77% chance of damaging wind over 30 yrs
- Air quality 2/10 Low 1 unhealthy d/yr today · 1 by 30 yrs out
Nearby sold comps map
Loading sold comps map…
Walkable amenities ~0.75 mi
Loading nearby amenities…
Taxation est. · year 1
- Rental income
- $22,276
- − Mortgage interest
- −$10,923
- − Property taxes
- −$4,437
- − Insurance
- −$975
- − Repairs & maintenance
- −$1,782
- − Management
- −$1,782
- − HOA
- −$96
- − Depreciation
- −$5,673
- Taxable loss
- −$3,392
- Est. tax savings @ 24.0%
- +$814
- After-tax cash flow
- $633/yr
For passive investors: Depreciation is non-cash, so a rental often shows a tax loss while cash-flowing — sheltering income. Rental losses are passive: they offset passive income freely, and up to $25,000/yr can offset ordinary (W-2) income if you actively participate and your MAGI is under $100k (phasing out to $0 by $150k); unused losses carry forward. On sale, claimed depreciation is recaptured at up to 25%, and gains may owe capital-gains tax (a 1031 exchange can defer both). Figures are a year-1 estimate at your 24.0% rate — not tax advice; consult a CPA.
Schools (NCES district)
- District
- Georgetown ISD
- NCES district ID
- 4820600
- Math proficiency
- 31% ▼ -5.00%
- Reading proficiency
- 38% ▼ -8.00%
- Median HH income
- $69,461
- Composite
- 31.77/100
- National rank
- #5897
- State rank
- #474 of 826 in TX
Livability — Georgetown
- Score
- 82/100
- State rank
- #18
- US rank
- #1294
Category grades
Schools grade is shown separately in the Schools card above.
Census & demographics
- County
- Williamson County · 680,029 people
- City population
- 128,203
- Metro
- Austin-Round Rock-Georgetown, TX
- Population (ZIP)
- 48,072
- Household income
- $100,431
- Rent vs Own
- Severe rent burden
- 1384.0
Population outlook (Williamson County) Hauer SSP2
- Today (2025)
- 699,027 people
- By 2030
- 795,537 · +13.8%
- By 2040
- 990,683 · +41.7%
- By 2050
- 1,184,292 · +69.4%
- By 2075
- 1,623,825 · +132.3%
- By 2100
- 1,924,153 · +175.3%
Race, ethnicity, and origin ACS 2023
- Neighborhood character
- Diverse neighborhood (Simpson 0.61)
- Race & ethnicity
- White 53% Hispanic / Latino 33% Two or more races 18% Black 8% Asian 3%
- Hispanic origin (detail)
- Mexican 26% Puerto Rican 2%
- Common ancestry
- Slovak 2% Lithuanian 2% Italian 2%
- Foreign-born
- 13% · Canada, China, Jamaica
- Languages at home
- 75% English-only · Spanish 18% Other Indo-European 2% French/Haitian/Cajun 1%
Political lean MEDSL · Williamson
- 2024 margin
- Toss-up / Even · D 48.0% · R 50.4% · Other 1.6%
- 2008→2024 swing
- +10.6pp toward D · 2008: -13.0pp · 2024: -2.5pp
- All cycles
- 2024: R+2.5 2020: D+1.4 2016: R+9.9 2012: R+21.5 2008: R+13.0
Not yet ingested
- Civics
- —
Market trends
- HPI YoY
- ▼ -215.77%
- Current HPI
- 198.0316
- Rent YoY
- ▼ -3.48%
- Metro
- Austin-Round Rock-Georgetown, TX
- State GDP YoY
- ▲ 3.95%
- F500 in state
- 110
Industry mix (Fortune 500 HQ in TX)
| Industry | F500 HQs | Revenue |
|---|---|---|
| Energy | 16 | $1,198B |
|
||
| Technology | 5 | $198B |
|
||
| Engineering / Construction | 4 | $72B |
|
||
| Energy Services | 3 | $60B |
|
||
| Utilities | 3 | $41B |
|
||
| Healthcare | 2 | $330B |
|
||
Price history
+130.6% since first listed12 events — show timeline
- 2025-12-09 Pending — Unlock MLS
- 2025-08-05 Contingent — Unlock MLS
- 2025-07-29 Listed $195,000 Unlock MLS
- 2025-05-07 Sold (Public Records) — Public Records
- 2020-12-09 Sold (Public Records) — Public Records
- 2000-09-01 Sold (Public Records) — Public Records
- 2000-08-31 Sold (MLS) — Unlock MLS
- 2000-08-07 Delisted — Unlock MLS
- 2000-07-17 Listed $99,000 Unlock MLS
- 1997-10-24 Sold (MLS) — Unlock MLS
- 1997-10-14 Delisted — Unlock MLS
- 1997-05-12 Listed $84,546 Unlock MLS
Property tax history
+4.4%/yrLatest (2026): $4,437 · -4.6% YoY. Source: county tax records.
Cash-flow waterfall
monthlySold comps — $/sqft
last 12 mo · ≤1 miLoading sold comps…