355 Maxine · Clinton, AR
Flood risk 9/10 · Severe
- FEMA flood zone
- X
- Chance of flooding over 30 yrs
- 0.99%
- Est. flood insurance / yr
- $507 – $1,088
Fire risk 3/10 · Minor
- Est. fire insurance / yr
- $1,499 – $2,785
Heat risk 5/10 · Moderate
- Hot days now (above 108°F)
- 7 days/yr
- Hot days in 30 yrs
- 20 days/yr
Wind risk 2/10 · Minimal
- Chance of severe wind over 30 yrs
- 4.0%
Air-quality risk 2/10 · Minimal
- Unhealthy air days now
- 0 days/yr
- Unhealthy air days in 30 yrs
- 1 days/yr
Risk factors via First Street. Map © Google.
Why this score? — see what drove the D grade
The composite is a weighted blend of 9 inputs, each scored 0–100. Each bar is that input's sub-score; the figure is the points it added to the 100-point composite (weight × sub-score).
- Appreciation +10.0/10.0
- Cash flow +8.3/30.0
- ARV discount +7.5/15.0
- Schools +3.7/10.0
- Livability +3.7/5.0
- 1% rule +2.6/10.0
- Rent growth +2.5/5.0
- Condition / age +2.5/5.0
- DSCR +2.2/10.0
$110,000
🖨 Deal sheet 📄 Offer letter ✓ Due diligence
Listing remarks MLS
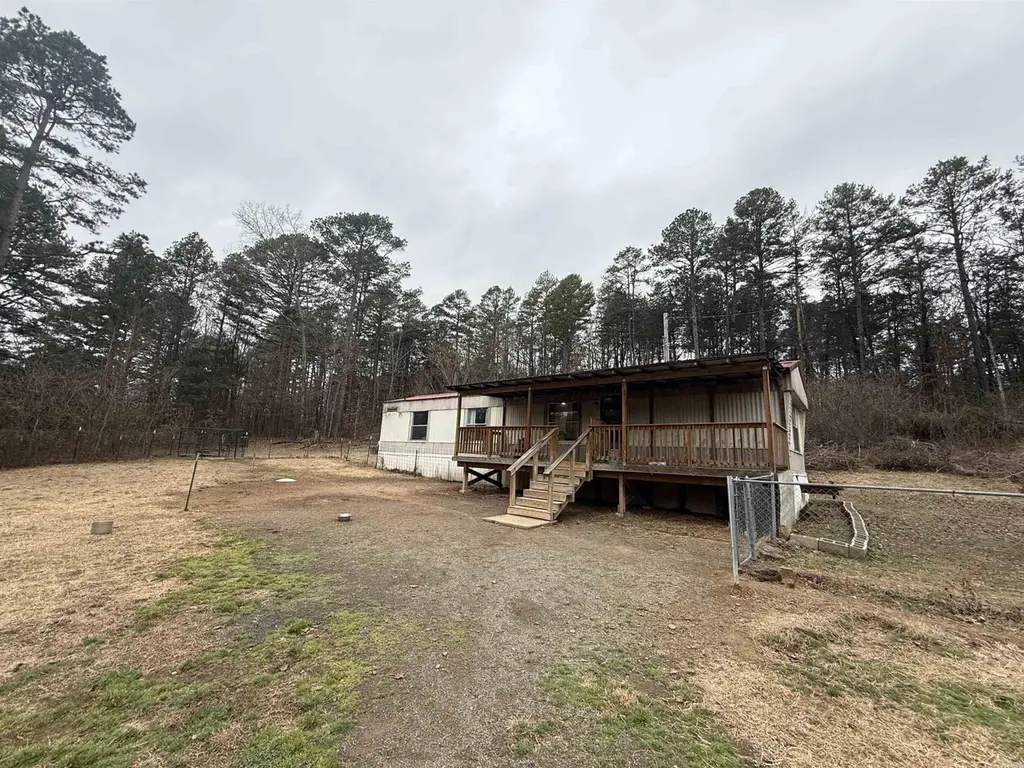
Affordable country living on 3 acres! This 2-bedroom 1-bath mobile home offers a great opportunity for investors, first-time buyers, or anyone looking to add their personal touch. Nestled in a peaceful setting with plenty of privacy, the property features a fenced-in yard--perfect for pets, gardening, or outdoor enjoyment. Two storage sheds convey, providing extra space for storage. With room to expand, update. Enjoy the space and freedom of rural living while being within convenient driving distance to town.
Key facts
- Rural living
- Fenced-in yard
- Storage sheds
Tags
Neighborhood map
What this means for you Summary
Snapshot
- This is a 2-bed/1.0-bath manufactured listed at $110k.
Deal economics
- At list price, monthly cash flow is $-168 ($-2k/yr) — negative.
- To cash-flow at today's rent, offer at most $86k (22.0% below list).
- To meet the 1% rule (rent ≥ 1% of price), the offer needs to be $83k (24.1% below list).
- Recommended offer: $83k (24.1% below list) — sets the bar for 1% rule.
- Cap rate 5.2% vs local median 3.6% in Clinton — top-decile yield for the area; either an underpriced asset or a hidden risk that comps aren't pricing in. Stress-test before assuming the spread holds.
Location & tenants
- Location reads 74/100 on livability (#15 in AR, #4,397 nationally) — a middle-class / working-renter tenant base. Strengths: cost of living A+, housing A+, health & safety A+; Watch: schools C-, amenities F, commute F.
- Clinton School District (rural): math 46% / reading 45% proficiency, ranked #41 of 238 in AR (top 17%) — families likely to look elsewhere, expect single-tenant / working-renter base with shorter leases; 68% free/reduced lunch — lower-income household profile, screen leases tightly.
- Market conditions: 100 active listings in the ZIP; 16 units permitted in Van Buren County in 2024 (0 in 5+ unit buildings).
Forward outlook
- In year one you build about $12k of equity ($761 loan paydown + $11k appreciation (10.0% local appreciation)).
- Van Buren County population projected at -27% by 2050 — secular population decline; favor cash flow + early exit over multi-decade hold.
- By year 4, paydown + projected appreciation supports a ~$42k cash-out refi (75% LTV) — recoverable capital for the next deal without selling this one.
Negotiation context
- It's been on market 115 days — a 9% lower offer ($100k) is reasonable based on typical stale-listing flexibility.
- 3 sale attempts since 23y ago with the ask held roughly flat each time — persistent listings suggest the price (not the market) is what's stuck; bring a comps-based counter.
- Current owner paid $38k; list at $110k implies a 189% gain — meaningful room to come down on a strong offer.
Risks & watch-outs
- Watch-outs: flood insurance adds $66/mo.
- Climate carrying-cost: severe flood risk; extreme-heat days projected 7→20/yr by 2055 (HVAC capex compounding) — expect insurance premiums to compound above CPI over the hold.
Questions for the listing agent
- What do current leases actually rent for vs. the listed asking? Can we see a recent rent roll and the last 12 months of T-12 income?
- It's been on market 115 days. Have you received any prior offers? Is the seller open to a 24% concession, seller financing, or rate buy-down credit?
- What's the actual annual flood-insurance premium (NFIP or private), and is the property in a SFHA with mandatory coverage?
- Why hasn't it sold? Are there any deal-killer items the seller is aware of (foundation, flood, title, zoning, code violations)?
- Is there a deadline driving the sale (1031 exchange, divorce, estate, relocation)? That informs how much negotiation room exists.
- The area grade is low — what's the realistic commute time and amenity access for the typical tenant pool here? Any planned neighborhood developments (good or bad) we should know about?
- What's the average days-on-market for RENTAL listings here right now (not sales)? A rising rental-DOM trend means longer vacancies and softer asking-rent achievability than the comps imply.
- What's the recent tenant-quality profile in this submarket — average credit score on applications, eviction rate, late-payment / NSF rate, and stable-employment percentage? A property-management company in the area should have these aggregated.
- How much new for-sale + rental construction is in the pipeline within 1–3 miles? Heavy new supply typically softens prices + rents 12–24 months out; constrained supply supports both.
Investment metrics
- 1% rule
- 0.76% ✗
- Cap rate
- 5.19%
- Cash-on-cash
- -3.94%
- DSCR
- 0.82
- GRM
- 11.0
CMA / ARV
No comps found within radius.
Projected returns pro-forma
10.0% appreciation · 3.0% rent growth · sell at horizon
- IRR
- 19.7%
- Equity multiple
- 2.60×
- Total profit
- $49,294
- Equity at exit
- $99,097
- IRR
- 18.1%
- Equity multiple
- 5.99×
- Total profit
- $153,658
- Equity at exit
- $213,706
Cash invested: $30,800 (down + closing). Projections, not guarantees.
Landlord ↔ Tenant lean methodology
- Overall (STATE)
- 92 Strongly Landlord-Friendly
- State Arkansas
- 92 Strongly Landlord-Friendly · R+14
- County
- — inherits STATE
- City
- — inherits STATE
ZIP-level market 72031
- Home prices YoY
- 5.2%
- Active inventory
- 100
- Price-to-rent
- 11.0×
Monthly cashflow live
- Estimated rent
- $834 medium interval (Pro) →
- Mortgage (P&I)
- −$577
- Tax est. 1.5%
- −$138 /mo · $1,650/yr
- Insurance
- −$46
- Flood insurance flood zone
- −$66 /mo · $798/yr
- HOA
- −$0
- Vacancy / Maint / Mgmt
- −$175
- Net cashflow
- $-168
Break-even live
UW: 25.0% down · 7.5% · 30yr · 1.5% tax · 5.0% vac · 8.0% maint · 8.0% mgmt
Financing live
Cash to close
- Down payment
- $27,500
- Closing costs
- $3,300
- Reserves months
- —
- Total cash needed
- —
Loan-product check · same deal, 3 products live
Conventional
25% down · 7.5% · 30yr
- Down + closing
- —
- Monthly P&I
- —
- Monthly cashflow
- —
- DSCR
- —
- Eligible?
- —
Personal DTI + credit; lowest rate.
DSCR
20% down · 8.5% · 30yr
- Down + closing
- —
- Monthly P&I
- —
- Monthly cashflow
- —
- DSCR
- —
- Eligible?
- —
No personal income docs; deal must DSCR.
Hard money
10% down · 12.0% · 12mo
- Down + closing
- —
- Monthly P&I
- —
- Monthly cashflow
- —
- DSCR
- —
- Eligible?
- —
Short-term bridge; refi at stabilization.
Listing history 25 events
-
2026-06-19days on market $110,000 Active 115 DOM
-
2026-06-18days on market $110,000 Active 114 DOM
-
2026-06-17days on market $110,000 Active 113 DOM
-
2026-06-16days on market $110,000 Active 112 DOM
-
2026-06-15days on market $110,000 Active 111 DOM
-
2026-06-14days on market $110,000 Active 109 DOM
-
2026-06-12days on market $110,000 Active 108 DOM
-
2026-06-09days on market $110,000 Active 105 DOM
-
2026-06-08days on market $110,000 Active 104 DOM
-
2026-06-07days on market $110,000 Active 103 DOM
-
2026-06-07days on market $110,000 Active 102 DOM
-
2026-06-04days on market $110,000 Active 99 DOM
-
2026-06-02days on market $110,000 Active 98 DOM
-
2026-06-01days on market $110,000 Active 97 DOM
-
2026-05-31days on market $110,000 Active 96 DOM
-
2026-05-31days on market $110,000 Active 95 DOM
-
2026-02-24$110,000 New Listing 514-char remark
Show marketing remark (514 chars)
Affordable country living on 3 acres! This 2-bedroom 1-bath mobile home offers a great opportunity for investors, first-time buyers, or anyone looking to add their personal touch. Nestled in a peaceful setting with plenty of privacy, the property features a fenced-in yard--perfect for pets, gardening, or outdoor enjoyment. Two storage sheds convey, providing extra space for storage. With room to expand, update. Enjoy the space and freedom of rural living while being within convenient driving distance to town.
-
2022-01-28soldstatus $38,000 Sold 108-char remark
Show marketing remark (108 chars)
Mobile home located in quiet area. Fenced in yard, storage buildings, storm shelter and large covered porch.
-
2021-12-17status Under Contract 108-char remark
Show marketing remark (108 chars)
Mobile home located in quiet area. Fenced in yard, storage buildings, storm shelter and large covered porch.
-
2021-11-16$39,000 New Listing 108-char remark
Show marketing remark (108 chars)
Mobile home located in quiet area. Fenced in yard, storage buildings, storm shelter and large covered porch.
-
2007-07-13soldstatus $25,000
-
2007-06-24soldstatus $25,000
-
2007-05-25historical
-
2003-12-11$27,500
-
1998-03-30soldstatus $28,000
ⓘ Source: listings_history table (triggers on properties + properties_extension) + one-shot
backfill from property_details.listing_events for pre-trigger history.
Climate risk First Street
- Flood 9/10 Extreme FEMA zone X · 99% chance over 30 yrs
- Wildfire 3/10 Moderate
- Heat 5/10 Major 7 d/yr ≥108°F today · 20 d/yr by 30 yrs out
- Wind 2/10 Low 4% chance of damaging wind over 30 yrs
- Air quality 2/10 Low 0 unhealthy d/yr today · 1 by 30 yrs out
Nearby sold comps map
Loading sold comps map…
Walkable amenities ~0.75 mi
Loading nearby amenities…
Taxation est. · year 1
- Rental income
- $10,012
- − Mortgage interest
- −$6,162
- − Property taxes
- −$1,650
- − Insurance
- −$1,348
- − Repairs & maintenance
- −$801
- − Management
- −$801
- − Depreciation
- −$3,200
- Taxable loss
- −$3,949
- Est. tax savings @ 24.0%
- +$948
- After-tax cash flow
- $-1,062/yr
For passive investors: Depreciation is non-cash, so a rental often shows a tax loss while cash-flowing — sheltering income. Rental losses are passive: they offset passive income freely, and up to $25,000/yr can offset ordinary (W-2) income if you actively participate and your MAGI is under $100k (phasing out to $0 by $150k); unused losses carry forward. On sale, claimed depreciation is recaptured at up to 25%, and gains may owe capital-gains tax (a 1031 exchange can defer both). Figures are a year-1 estimate at your 24.0% rate — not tax advice; consult a CPA.
Schools (NCES district)
- District
- Clinton School District
- NCES district ID
- 0504410
- Math proficiency
- 46% ▼ -10.00%
- Reading proficiency
- 45% ▼ -12.00%
- Median HH income
- $32,018
- Composite
- 37.34/100
- National rank
- #4438
- State rank
- #41 of 238 in AR
Livability — Clinton
- Score
- 74/100
- State rank
- #15
- US rank
- #4397
Category grades
Schools grade is shown separately in the Schools card above.
Census & demographics
- Population (ZIP)
- 7,108
Population outlook (Van Buren County) Hauer SSP2
- Today (2025)
- 15,459 people
- By 2030
- 14,645 · -5.3%
- By 2040
- 12,918 · -16.4%
- By 2050
- 11,263 · -27.1%
- By 2075
- 7,870 · -49.1%
- By 2100
- 4,918 · -68.2%
Race, ethnicity, and origin ACS 2023
- Neighborhood character
- Predominantly White (93%)
- Race & ethnicity
- White 93% Hispanic / Latino 5% Two or more races 3%
- Common ancestry
- Slovak 4% Serbian 2% Romanian 1%
- Foreign-born
- 2% · Canada
- Languages at home
- 95% English-only · Spanish 5%
Political lean MEDSL · Van Buren
- 2024 margin
- Solid R (+60.2) · D 18.9% · R 79.0% · Other 2.1%
- 2008→2024 swing
- -28.5pp toward R · 2008: -31.7pp · 2024: -60.2pp
- All cycles
- 2024: R+60.2 2020: R+56.9 2016: R+53.9 2012: R+39.5 2008: R+31.7
Not yet ingested
- Civics
- —
Market trends
- HPI YoY
- ▲ 12.08%
- Current HPI
- 244.9609
- Rent YoY
- —
- Metro
- —
- State GDP YoY
- ▲ 3.80%
- F500 in state
- 10
Industry mix (Fortune 500 HQ in AR)
| Industry | F500 HQs | Revenue |
|---|---|---|
| Retail | 1 | $681B |
|
||
| Food / Agriculture | 1 | $53B |
|
||
| Retail / Energy | 1 | $22B |
|
||
| Transportation / Logistics | 1 | $12B |
|
||
| Energy | 1 | $4B |
|
||
Price history
+292.9% since first listed9 events — show timeline
- 2026-02-24 Listed $110,000 CARMLS
- 2022-01-28 Sold (MLS) $38,000 CARMLS
- 2021-12-17 Pending — CARMLS
- 2021-11-16 Listed $39,000 CARMLS
- 2007-07-13 Sold (Public Records) $25,000 Public Records
- 2007-06-24 Sold (MLS) $25,000 CARMLS
- 2007-05-25 Listing Removed — CARMLS
- 2003-12-11 Listed $27,500 CARMLS
- 1998-03-30 Sold (Public Records) $28,000 Public Records
Property tax history
-10.5%/yrLatest (2025): $50 · +0.0% YoY. Source: county tax records.
Cash-flow waterfall
monthlySold comps — $/sqft
last 12 mo · ≤1 miLoading sold comps…