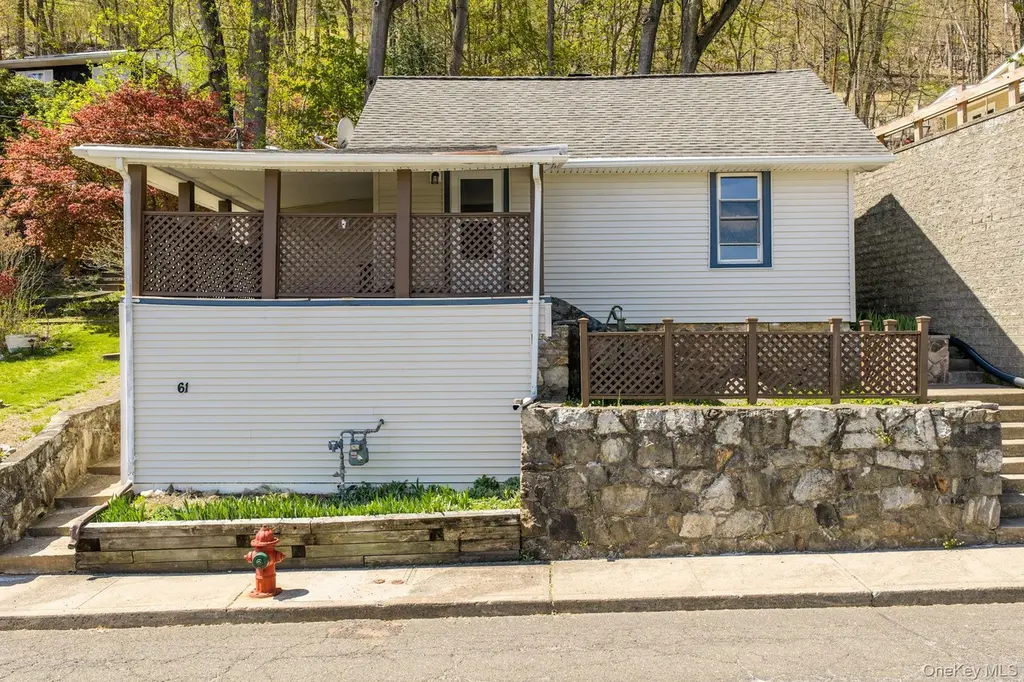
61 Kleitz Ave · Highland Falls, NY
Flood risk 8/10 · Major
- FEMA flood zone
- X (unshaded)
- Chance of flooding over 30 yrs
- 0.78%
- Est. flood insurance / yr
- $473 – $860
Fire risk 5/10 · Moderate
- Est. fire insurance / yr
- $691 – $1,283
Heat risk 5/10 · Moderate
- Hot days now (above 100°F)
- 7 days/yr
- Hot days in 30 yrs
- 17 days/yr
Wind risk 4/10 · Minor
- Chance of severe wind over 30 yrs
- 15.0%
Air-quality risk 3/10 · Minor
- Unhealthy air days now
- 2 days/yr
- Unhealthy air days in 30 yrs
- 3 days/yr
Risk factors via First Street. Map © Google.
Why this score? — see what drove the D grade
The composite is a weighted blend of 9 inputs, each scored 0–100. Each bar is that input's sub-score; the figure is the points it added to the 100-point composite (weight × sub-score).
- Appreciation +9.8/10.0
- ARV discount +9.1/15.0
- Cash flow +6.8/30.0
- Schools +4.6/10.0
- Livability +3.7/5.0
- 1% rule +2.7/10.0
- Rent growth +2.5/5.0
- Condition / age +2.5/5.0
- DSCR +1.0/10.0
$309,000
🖨 Deal sheet (PDF) 📄 Offer letter ✓ Due diligence
Listing remarks
Nestled in the heart of the Village of Highland Falls, this charming and thoughtfully updated 3-bedroom ranch places you just moments from the scenic Hudson River and the renowned United States Military Academy at West Point. Located on a quiet, walkable street, the home offers easy access to local shops, restaurants, parks, and the everyday conveniences that make this historic Hudson Valley town so desirable. Combining character, location, and lifestyle, this property is a wonderful opportunity to enjoy all that Highland Falls has to offer. Positioned on a quaint corner lot, this lovingly maintained 1916 home beautifully preserves its original charm while incorporating thoughtful updates t
Key facts
- Covered front porch
- Partial basement
- Eat-in kitchen
Tags
Property features AI
Exterior
- Parking: On-street parking
- Security: No specific security features listed
- Utilities: Public sewer; Water connected; Natural gas connected; Electricity connected; Cable available; Phone available; Trash collection (private) - service available; Electric service by NYSEG
- Home design: Single-family residence; One story
- Construction: Aluminum siding; Vinyl siding; Stone foundation; Property updated/remodeled
- Exterior features: Corner lot; Landscaped yard; Lighting; Mailbox; Rain gutters; Near public transit; Near shops; Near schools; Sloped lot with views; Partial unfinished basement with storage
Interior
- Kitchen: Gas oven; Gas range; Microwave; Eat-in kitchen layout
- Bedrooms: One-level home with rooms on a single floor (total rooms: 5)
- Flooring: Hardwood floors; Linoleum
- Bathrooms: One full bathroom
- Heating & cooling: Hot water heating; Steam heating; No central cooling
- Interior features: First-floor bedroom; First-floor full bath; Built-in features; Eat-in kitchen; Original details; Storage; Walk-through kitchen; Washer/dryer hookup; Covered patio and porch
- Laundry & utility: Washer included; Inside laundry; Gas water heater
Neighborhood map
What this means for you Summary
Snapshot
- This is a 3-bed/1.0-bath single-family listed at $309k.
Deal economics
- At list price, monthly cash flow is $-535 ($-6k/yr) — negative.
- To cash-flow at today's rent, offer at most $215k (30.6% below list).
- To meet the 1% rule (rent ≥ 1% of price), the offer needs to be $238k (23.0% below list).
- Recommended offer: $215k (30.6% below list) — sets the bar for cash-flow.
Location & tenants
- Location reads 73/100 on livability (#335 in NY) — a middle-class / working-renter tenant base. Strengths: employment A+, housing A+, health & safety A+; Watch: cost of living D, amenities F, commute F.
- Highland Falls Central School District (rural): math 53% / reading 47% proficiency, ranked #328 of 590 in NY (top 56%) — acceptable for families but not a draw, mixed tenant base, ~2y average lease.
- Zoned schools: Fort Montgomery Elementary School (201 students, 52% FRL); Highland Falls Intermediate School (math 32% / reading 47%, grade F, #418 of 729 statewide, top 59%, 324 students, 56% FRL); James I O'Neill High School (math 87% / reading 70%, grade A-, #568 of 1,100 statewide, top 52%, 424 students, 30% FRL).
- Market conditions: 19 active listings in the ZIP; 7 comparable units currently listed for rent nearby; rentals at typical pace (median 25d on market — plan ~3-4 weeks tenant-placement turnaround); 1,746 units permitted in Orange County in 2024 (1,265 in 5+ unit buildings).
Forward outlook
- In year one you build about $32k of equity ($2k loan paydown + $30k appreciation (9.7% local appreciation)).
- By year 2, paydown + projected appreciation supports a ~$52k cash-out refi (75% LTV) — recoverable capital for the next deal without selling this one.
Negotiation context
- It's been on market 55 days — a 3% lower offer ($300k) is reasonable based on typical stale-listing flexibility.
- Current owner paid $76k; list at $309k implies a 307% gain — meaningful room to come down on a strong offer.
Risks & watch-outs
- Watch-outs: flood insurance adds $56/mo; built in 1916 — expect roof / HVAC / electrical / plumbing capex.
- Climate carrying-cost: severe flood risk; moderate wildfire risk; extreme-heat days projected 7→17/yr by 2055 (HVAC capex compounding) — expect insurance premiums to compound above CPI over the hold.
Questions for the listing agent
- What do current leases actually rent for vs. the listed asking? Can we see a recent rent roll and the last 12 months of T-12 income?
- It's been on market 55 days. Have you received any prior offers? Is the seller open to a 31% concession, seller financing, or rate buy-down credit?
- Built in 1916 — when were the roof, HVAC, electrical panel, plumbing, and water heater last replaced?
- What's the actual annual flood-insurance premium (NFIP or private), and is the property in a SFHA with mandatory coverage?
- Is there a deadline driving the sale (1031 exchange, divorce, estate, relocation)? That informs how much negotiation room exists.
- The area grade is low — what's the realistic commute time and amenity access for the typical tenant pool here? Any planned neighborhood developments (good or bad) we should know about?
- What's the average days-on-market for RENTAL listings here right now (not sales)? A rising rental-DOM trend means longer vacancies and softer asking-rent achievability than the comps imply.
- What's the recent tenant-quality profile in this submarket — average credit score on applications, eviction rate, late-payment / NSF rate, and stable-employment percentage? A property-management company in the area should have these aggregated.
- How much new for-sale + rental construction is in the pipeline within 1–3 miles? Heavy new supply typically softens prices + rents 12–24 months out; constrained supply supports both.
Investment metrics
- 1% rule
- 0.77% ✗
- Cap rate
- 4.43%
- Cash-on-cash
- -6.65%
- DSCR
- 0.70
- GRM
- 10.8
CMA / ARV
- ARV (median comp)
- $320,250
- List price
- $309,000
- Delta
- -3.51%
- Verdict
- FAIR
- Comps
- 20 within 1.0 mi
Show comp detail 6 sales within ~0.75 mi
| Address | Dist | Beds/Ba | Sqft | Sold | Price | $/sf | Match |
|---|---|---|---|---|---|---|---|
| 28 Fort Putnam St | 0.16mi | 2/1.0 (-1) | 900 (-1%) | 6mo | $327,500 | $364 | 81 |
| 11 Lake St | 0.22mi | 2/1.0 (-1) | 780 (-14%) | 9mo | $293,000 | $376 | 54 |
| 138 Mountain Ave | 0.29mi | 3/1.0 | 1,036 (+14%) | 11mo | $340,500 | $329 | 54 |
| 60 Schneider Ave | 0.28mi | 2/1.0 (-1) | 1,040 (+15%) | 5mo | $130,000 | $125 | 53 |
| 36 Kleitz Ave | 0.12mi | 2/1.0 (-1) | 1,000 (+10%) | 23mo | $373,000 | $373 | 53 |
| 17 Tobins Ln | 0.38mi | 2/1.0 (-1) | 996 (+10%) | 13mo | $257,500 | $259 | 50 |
Match score weights: distance 35% · size 25% · config 20% · recency 20%. Top-matched comps best support the ARV.
Projected returns pro-forma
9.7% appreciation · 3.0% rent growth · sell at horizon
- IRR
- 18.4%
- Equity multiple
- 2.48×
- Total profit
- $128,022
- Equity at exit
- $271,544
- IRR
- 17.2%
- Equity multiple
- 5.65×
- Total profit
- $402,566
- Equity at exit
- $578,478
Cash invested: $86,520 (down + closing). Projections, not guarantees.
Landlord ↔ Tenant lean methodology
- Overall (STATE)
- 15 Strongly Tenant-Friendly
- State New York
- 15 Strongly Tenant-Friendly · D+10
- County
- — inherits STATE
- City
- — inherits STATE
ZIP-level market 10928
- Home prices YoY
- 3.5%
- Active inventory
- 19
- Price-to-rent
- 10.8×
Monthly cashflow live
- Estimated rent
- $2,379 high interval (Pro) →
- Mortgage (P&I)
- −$1,620
- Tax from tax record
- −$609 /mo · $7,310/yr
- Insurance
- −$129
- Flood insurance flood zone
- −$56 /mo · $666/yr
- HOA
- −$0
- Vacancy / Maint / Mgmt
- −$500
- Net cashflow
- $-535
Break-even live
Sensitivity live
| Price | -10% $-360 | -5% $-447 | +0% $-535 | +5% $-622 | +10% $-710 |
|---|---|---|---|---|---|
| Rent | -10% $-723 | -5% $-629 | +0% $-535 | +5% $-441 | +10% $-347 |
| Rate | -1.0pp $-379 | -0.5pp $-456 | base $-535 | +0.5pp $-615 | +1.0pp $-696 |
UW: 25.0% down · 7.5% · 30yr · 1.5% tax · 5.0% vac · 8.0% maint · 8.0% mgmt
Financing live
Cash to close
- Down payment
- $77,250
- Closing costs
- $9,270
- Reserves months
- —
- Total cash needed
- —
Loan-product check · same deal, 3 products live
Conventional
25% down · 7.5% · 30yr
- Down + closing
- —
- Monthly P&I
- —
- Monthly cashflow
- —
- DSCR
- —
- Eligible?
- —
Personal DTI + credit; lowest rate.
DSCR
20% down · 8.5% · 30yr
- Down + closing
- —
- Monthly P&I
- —
- Monthly cashflow
- —
- DSCR
- —
- Eligible?
- —
No personal income docs; deal must DSCR.
Hard money
10% down · 12.0% · 12mo
- Down + closing
- —
- Monthly P&I
- —
- Monthly cashflow
- —
- DSCR
- —
- Eligible?
- —
Short-term bridge; refi at stabilization.
Rent comps 7 comps
| Address | Beds | Baths | Sqft | Rent | $/sqft | DOM | Units | Dist |
|---|---|---|---|---|---|---|---|---|
| 51 Schneider Ave Unit 2A Highland Falls, NY | 3.0 | 1.0 | 900 | $2,795 | $3.11 | 15d | 1 | 0.30mi |
| 29 Tobins Ln #1 Highland Falls, NY | 3.0 | 1.0 | 1000 | $2,850 | $2.85 | 25d | 1 | 0.35mi |
| 29 Tobins Ln Unit 2 Highland Falls, NY | 3.0 | 1.0 | 840 | $2,550 | $3.04 | 45d | 1 | 0.35mi |
| 16 Schneider Ave #1 Highland Falls, NY | 2.0 | 1.0 | 800 | $1,750 | $2.19 | 25d | 1 | 0.37mi |
| 44 Center St Unit 1 Highland Falls, NY | 3.0 | 1.0 | 975 | $2,050 | $2.10 | 15d | 1 | 0.39mi |
| 30 Center St Highlands, NY | 2.0 | 1.0 | 800 | $2,300 | $2.88 | 15d | 1 | 0.40mi |
| 12 Mountain Ave Highland Falls, NY | 2.0 | 1.0 | 700 | $2,000 | $2.86 | 45d | 1 | 0.47mi |
Listing history 18 events
-
2026-06-22days on market $309,000 Active 55 DOM
-
2026-06-18days on market $309,000 Active 52 DOM
-
2026-06-17days on market $309,000 Active 51 DOM
-
2026-06-16days on market $309,000 Active 50 DOM
-
2026-06-15days on market $309,000 Active 49 DOM
-
2026-06-14days on market $309,000 Active 47 DOM
-
2026-06-10days on market $309,000 Active 44 DOM
-
2026-06-09days on market $309,000 Active 43 DOM
-
2026-06-08days on market $309,000 Active 42 DOM
-
2026-06-07days on market $309,000 Active 41 DOM
-
2026-06-05days on market $309,000 Active 38 DOM
-
2026-06-03days on market $309,000 Active 37 DOM
-
2026-06-02days on market $309,000 Active 36 DOM
-
2026-06-01days on market $309,000 Active 35 DOM
-
2026-05-31days on market $309,000 Active 34 DOM
-
2026-05-30days on market $309,000 Active 33 DOM
-
2026-04-27$319,000 Active 2439-char remark
-
1999-07-19soldstatus $76,000
ⓘ Source: listings_history table (triggers on properties + properties_extension) + one-shot
backfill from property_details.listing_events for pre-trigger history.
Tax reassessment forecast NY · Partial reset (capped growth)
- Current annual tax
- $7,310 · $609/mo
- Projected year-2 tax
- $7,310 · $609/mo
- Expected delta
- $0/yr ($0/mo · 0.0%)
ⓘ Screening estimate from a state-policy table — verify with the county assessor before closing.
Climate risk First Street
- Flood 8/10 Severe FEMA zone X (unshaded) · 78% chance over 30 yrs
- Wildfire 5/10 Major
- Heat 5/10 Major 7 d/yr ≥100°F today · 17 d/yr by 30 yrs out
- Wind 4/10 Moderate 15% chance of damaging wind over 30 yrs
- Air quality 3/10 Moderate 2 unhealthy d/yr today · 3 by 30 yrs out
Nearby sold comps map
Loading sold comps map…
Walkable amenities ~0.75 mi
Loading nearby amenities…
Taxation est. · year 1
- Rental income
- $28,545
- − Mortgage interest
- −$17,309
- − Property taxes
- −$7,310
- − Insurance
- −$2,212
- − Repairs & maintenance
- −$2,284
- − Management
- −$2,284
- − Depreciation
- −$8,989
- Taxable loss
- −$11,842
- Est. tax savings @ 24.0%
- +$2,842
- After-tax cash flow
- $-3,575/yr
For passive investors: Depreciation is non-cash, so a rental often shows a tax loss while cash-flowing — sheltering income. Rental losses are passive: they offset passive income freely, and up to $25,000/yr can offset ordinary (W-2) income if you actively participate and your MAGI is under $100k (phasing out to $0 by $150k); unused losses carry forward. On sale, claimed depreciation is recaptured at up to 25%, and gains may owe capital-gains tax (a 1031 exchange can defer both). Figures are a year-1 estimate at your 24.0% rate — not tax advice; consult a CPA.
Schools (NCES district)
- District
- Highland Falls Central School District
- NCES district ID
- 3614430
- Math proficiency
- 53% ▼ -2.00%
- Reading proficiency
- 47% ▼ -6.00%
- Median HH income
- $79,944
- Composite
- 45.68/100
- National rank
- #2577
- State rank
- #328 of 590 in NY
Livability — Highland Falls
- Score
- 73/100
- State rank
- #335
- US rank
- #5653
Category grades
Schools grade is shown separately in the Schools card above.
Census & demographics
- Census place
- Highland Falls, NY
- Population (ZIP)
- 5,273
Population outlook (Orange County) Hauer SSP2
- Today (2025)
- 379,830 people
- By 2030
- 378,955 · -0.2%
- By 2040
- 375,444 · -1.2%
- By 2050
- 369,311 · -2.8%
- By 2075
- 354,233 · -6.7%
- By 2100
- 318,150 · -16.2%
Race, ethnicity, and origin ACS 2023
- Neighborhood character
- Diverse neighborhood (Simpson 0.69)
- Race & ethnicity
- White 44% Hispanic / Latino 30% Two or more races 21% Black 16% Asian 5%
- Hispanic origin (detail)
- Puerto Rican 13% Cuban 1% Dominican 12%
- Common ancestry
- Hispanic 6% Romanian 3% Scotch-Irish 3%
- Foreign-born
- 19% · Canada, China
- Languages at home
- 72% English-only · Spanish 16% French/Haitian/Cajun 6% Chinese 2%
Political lean MEDSL · Orange
- 2024 margin
- Lean R (+8.4) · D 45.8% · R 54.2%
- 2008→2024 swing
- -12.5pp toward R · 2008: 4.1pp · 2024: -8.4pp
- All cycles
- 2024: R+8.4 2020: R+0.2 2016: R+6.5 2012: D+5.2 2008: D+4.1
Not yet ingested
- Civics
- —
Market trends
- HPI YoY
- ▲ 9.70%
- Current HPI
- 284.3368
- Rent YoY
- —
- Metro
- —
- State GDP YoY
- ▲ 2.60%
- F500 in state
- 92
Industry mix (Fortune 500 HQ in NY)
| Industry | F500 HQs | Revenue |
|---|---|---|
| Financial Services | 10 | $950B |
|
||
| Consumer Goods | 9 | $162B |
|
||
| Insurance | 4 | $225B |
|
||
| Telecommunications | 2 | $144B |
|
||
| Pharmaceuticals | 2 | $112B |
|
||
| Media / Entertainment | 2 | $69B |
|
||
Price history
+306.6% since first listed3 events — show timeline
- 2026-05-20 Price Changed $309,000 OneKey® MLS as Distributed by MLS Grid
- 2026-04-27 Listed $319,000 OneKey® MLS as Distributed by MLS Grid
- 1999-07-19 Sold (Public Records) $76,000 Public Records
Property tax history
+2.8%/yrLatest (2025): $7,310 · +40.4% YoY. Source: county tax records.
Cash-flow waterfall
monthlySold comps — $/sqft
last 12 mo · ≤1 miLoading sold comps…