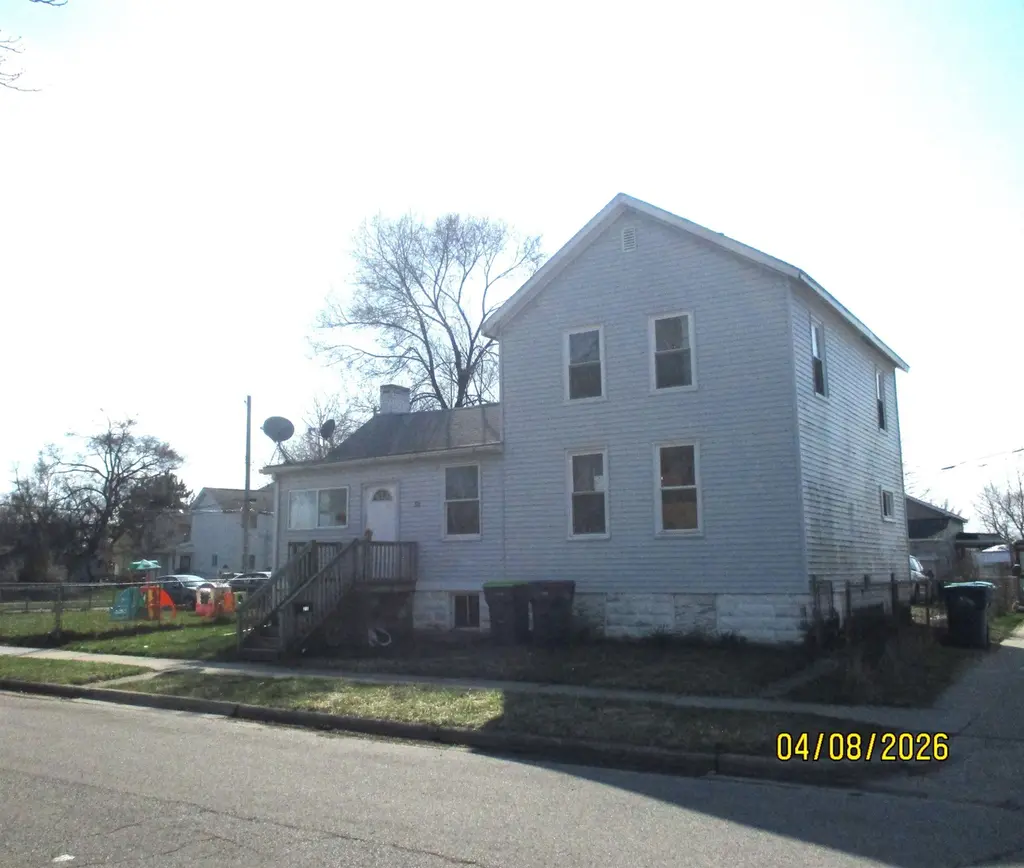
316 Howard St · Bay City, MI
Flood risk 1/10 · Minimal
- FEMA flood zone
- X (unshaded)
- Chance of flooding over 30 yrs
- 0.0%
- Est. flood insurance / yr
- $473 – $860
Fire risk 1/10 · Minimal
- Est. fire insurance / yr
- $784 – $1,456
Heat risk 2/10 · Minimal
- Hot days now (above 97°F)
- 7 days/yr
- Hot days in 30 yrs
- 14 days/yr
Wind risk 1/10 · Minimal
- Chance of severe wind over 30 yrs
- —
Air-quality risk 2/10 · Minimal
- Unhealthy air days now
- 1 days/yr
- Unhealthy air days in 30 yrs
- 2 days/yr
Risk factors via First Street. Map © Google.
Why this score? — see what drove the D- grade
The composite is a weighted blend of 9 inputs, each scored 0–100. Each bar is that input's sub-score; the figure is the points it added to the 100-point composite (weight × sub-score).
- Cash flow +11.1/30.0
- ARV discount +7.5/15.0
- Livability +3.4/5.0
- 1% rule +3.2/10.0
- DSCR +3.2/10.0
- Schools +2.8/10.0
- Rent growth +2.5/5.0
- Condition / age +2.5/5.0
- Appreciation +0.0/10.0
$134,500
🖨 Deal sheet (PDF) 📄 Offer letter ✓ Due diligence
Listing remarks MLS
Location is a Plus! The dead end makes it a quiet street. It is within walking distance to walk along the water to uptown and downtown Bay City. There is an alleyway driveway and parking on the street. Great View of the Bay City Fireworks in the summer! Large kitchen with an island bar & a dining room. Has a dry basement for lots of storage room. The first floor bedroom has a large closet and a room that could be used as an office, craft room, playroom or another bedroom. 2 bedrooms upstairs have large closets and a 1/2 bath. Fresh paint and flooring in some of the rooms.
Key facts
- 4,792 sq ft lot
- Built 1914
- Listed 71 days
Tags
Neighborhood map
What this means for you Summary
Snapshot
- This is a 2-bed/1.5-bath single-family listed at $134k.
Deal economics
- At list price, monthly cash flow is $-54 ($-644/yr) — negative.
- To cash-flow at today's rent, offer at most $125k (7.0% below list).
- To meet the 1% rule (rent ≥ 1% of price), the offer needs to be $110k (18.3% below list).
- Recommended offer: $110k (18.3% below list) — sets the bar for 1% rule.
Location & tenants
- Location reads 68/100 on livability (#360 in MI) — a middle-class / working-renter tenant base. Strengths: cost of living A+, housing A+, health & safety A+; Watch: amenities D, crime F, commute F.
- Bay City School District (urban): math 27% / reading 40% proficiency, ranked #317 of 540 in MI (top 59%) — families likely to look elsewhere, expect single-tenant / working-renter base with shorter leases.
- Zoned schools: Washington Elementary School (math 8% / reading 17%, grade F, #1,203 of 1,397 statewide, top 87%, 395 students, 93% FRL); Handy Middle School (math 17% / reading 33%, grade F, #387 of 493 statewide, top 78%, 685 students, 79% FRL); Bay City Central High School (math 22% / reading 47%, grade F, #372 of 713 statewide, top 56%, 1,033 students, 64% FRL) — zoned schools average 79% FRL vs 44% district-wide (35 pts higher); higher-poverty schools than district average — tighter screening recommended.
- Market conditions: 150 active listings in the ZIP; 39 units permitted in Bay County in 2024 (0 in 5+ unit buildings).
Forward outlook
- Local home prices are declining (-3.0%/yr); year-one equity from $930 of loan paydown is wiped out by about $4k of value loss. Plan a longer hold.
- Bay County population projected at -21% by 2050 — secular population decline; favor cash flow + early exit over multi-decade hold.
Negotiation context
- It's been on market 72 days — a 6% lower offer ($126k) is reasonable based on typical stale-listing flexibility.
- 8 sale attempts since 16y ago with the ask held roughly flat each time — persistent listings suggest the price (not the market) is what's stuck; bring a comps-based counter.
- Current owner paid $55k; list at $134k implies a 145% gain — meaningful room to come down on a strong offer.
Risks & watch-outs
- Watch-outs: built in 1914 — expect roof / HVAC / electrical / plumbing capex.
Questions for the listing agent
- What do current leases actually rent for vs. the listed asking? Can we see a recent rent roll and the last 12 months of T-12 income?
- It's been on market 72 days. Have you received any prior offers? Is the seller open to a 18% concession, seller financing, or rate buy-down credit?
- Built in 1914 — when were the roof, HVAC, electrical panel, plumbing, and water heater last replaced?
- Why hasn't it sold? Are there any deal-killer items the seller is aware of (foundation, flood, title, zoning, code violations)?
- Is there a deadline driving the sale (1031 exchange, divorce, estate, relocation)? That informs how much negotiation room exists.
- Schools are D-rated, which usually means shorter tenancies and higher turnover. Who's the typical renter profile here, and what's been the actual vacancy rate?
- Crime grade is F in this area — have there been break-ins, vandalism, or insurance claims at this property in the last 3 years? What carrier currently insures it and at what premium?
- The area grade is low — what's the realistic commute time and amenity access for the typical tenant pool here? Any planned neighborhood developments (good or bad) we should know about?
- What's the average days-on-market for RENTAL listings here right now (not sales)? A rising rental-DOM trend means longer vacancies and softer asking-rent achievability than the comps imply.
- What's the recent tenant-quality profile in this submarket — average credit score on applications, eviction rate, late-payment / NSF rate, and stable-employment percentage? A property-management company in the area should have these aggregated.
- How much new for-sale + rental construction is in the pipeline within 1–3 miles? Heavy new supply typically softens prices + rents 12–24 months out; constrained supply supports both.
Investment metrics
- 1% rule
- 0.82% ✗
- Cap rate
- 5.81%
- Cash-on-cash
- -1.71%
- DSCR
- 0.92
- GRM
- 10.2
CMA / ARV
- ARV (median comp)
- $88,664
- List price
- $134,500
- Delta
- 51.70%
- Verdict
- OVERPRICED
- Comps
- 20 within 1.0 mi
Show comp detail 12 sales within ~0.75 mi
| Address | Dist | Beds/Ba | Sqft | Sold | Price | $/sf | Match |
|---|---|---|---|---|---|---|---|
| 321 Stanton St | 0.51mi | 3/1.5 (+1) | 1,756 (-0%) | 3mo | $173,000 | $99 | 68 |
| 421 Garfield Ave | 0.14mi | 3/2.0 (+1) | 1,690 (-4%) | 15mo | $90,000 | $53 | 67 |
| 1200 Fitzhugh St | 0.45mi | 3/1.0 (+1) | 1,716 (-2%) | 5mo | $47,500 | $28 | 63 |
| 318 Fraser St | 0.21mi | 3/2.0 (+1) | 1,512 (-14%) | 0mo | $155,000 | $103 | 60 |
| 234 N Jackson St | 0.66mi | 3/2.0 (+1) | 1,739 (-1%) | 10mo | $100,000 | $58 | 52 |
| 808 13th St | 0.55mi | 3/1.5 (+1) | 1,840 (+4%) | 15mo | $82,000 | $45 | 50 |
| 414 S Jackson St | 0.46mi | 3/1.0 (+1) | 1,500 (-15%) | 2mo | $109,900 | $73 | 45 |
| 417 Marsac St | 0.44mi | 3/2.0 (+1) | 1,546 (-12%) | 15mo | $131,500 | $85 | 40 |
| 1210 17th St | 0.56mi | 3/1.5 (+1) | 1,944 (+10%) | 16mo | $132,500 | $68 | 38 |
| 711 S Farragut St | 0.66mi | 3/1.5 (+1) | 1,680 (-4%) | 23mo | $165,000 | $98 | 37 |
| 1215 Lafayette Ave | 0.53mi | 3/2.0 (+1) | 1,513 (-14%) | 16mo | $78,000 | $52 | 32 |
| 720 S Henry St | 0.72mi | 3/2.0 (+1) | 1,512 (-14%) | 10mo | $30,000 | $20 | 28 |
Match score weights: distance 35% · size 25% · config 20% · recency 20%. Top-matched comps best support the ARV.
Projected returns pro-forma
-3.0% appreciation · 3.0% rent growth · sell at horizon
- IRR
- -19.1%
- Equity multiple
- 0.33×
- Total profit
- $-25,201
- Equity at exit
- $20,054
- IRR
- -11.7%
- Equity multiple
- 0.30×
- Total profit
- $-26,297
- Equity at exit
- $11,629
Cash invested: $37,660 (down + closing). Projections, not guarantees.
Landlord ↔ Tenant lean methodology
- Overall (STATE)
- 62 Landlord-Friendly
- State Michigan
- 62 Landlord-Friendly · EVEN
- County
- — inherits STATE
- City
- — inherits STATE
ZIP-level market 48708
- Home prices YoY
- -30.9%
- Active inventory
- 150
- Price-to-rent
- 10.2×
Monthly cashflow live
- Estimated rent
- $1,099 medium interval (Pro) →
- Mortgage (P&I)
- −$705
- Tax from tax record
- −$160 /mo · $1,926/yr
- Insurance
- −$56
- HOA
- −$0
- Vacancy / Maint / Mgmt
- −$231
- Net cashflow
- $-54
Break-even live
Sensitivity live
| Price | -10% $22 | -5% $-16 | +0% $-54 | +5% $-92 | +10% $-130 |
|---|---|---|---|---|---|
| Rent | -10% $-140 | -5% $-97 | +0% $-54 | +5% $-10 | +10% $33 |
| Rate | -1.0pp $14 | -0.5pp $-19 | base $-54 | +0.5pp $-89 | +1.0pp $-124 |
UW: 25.0% down · 7.5% · 30yr · 1.5% tax · 5.0% vac · 8.0% maint · 8.0% mgmt
Financing live
Cash to close
- Down payment
- $33,625
- Closing costs
- $4,035
- Reserves months
- —
- Total cash needed
- —
Loan-product check · same deal, 3 products live
Conventional
25% down · 7.5% · 30yr
- Down + closing
- —
- Monthly P&I
- —
- Monthly cashflow
- —
- DSCR
- —
- Eligible?
- —
Personal DTI + credit; lowest rate.
DSCR
20% down · 8.5% · 30yr
- Down + closing
- —
- Monthly P&I
- —
- Monthly cashflow
- —
- DSCR
- —
- Eligible?
- —
No personal income docs; deal must DSCR.
Hard money
10% down · 12.0% · 12mo
- Down + closing
- —
- Monthly P&I
- —
- Monthly cashflow
- —
- DSCR
- —
- Eligible?
- —
Short-term bridge; refi at stabilization.
Listing history 38 events
-
2026-06-22days on market $134,500 Active 72 DOM
-
2026-06-21days on market $134,500 Active 71 DOM
-
2026-06-19days on market $134,500 Active 69 DOM
-
2026-06-18days on market $134,500 Active 68 DOM
-
2026-06-17days on market $134,500 Active 67 DOM
-
2026-06-16days on market $134,500 Active 66 DOM
-
2026-06-15days on market $134,500 Active 65 DOM
-
2026-06-14days on market $134,500 Active 63 DOM
-
2026-06-12days on market $134,500 Active 62 DOM
-
2026-06-09days on market $134,500 Active 59 DOM
-
2026-06-08days on market $134,500 Active 58 DOM
-
2026-06-07days on market $134,500 Active 57 DOM
-
2026-06-05days on market $134,500 Active 54 DOM
-
2026-06-03days on market $134,500 Active 53 DOM
-
2026-06-02days on market $134,500 Active 52 DOM
-
2026-06-01days on market $134,500 Active 51 DOM
-
2026-05-31days on market $134,500 Active 50 DOM
-
2026-05-30days on market $134,500 Active 49 DOM
-
2026-05-05price $134,500 585-char remark
Show marketing remark (585 chars)
Location is a Plus! The dead end makes it a quiet street. It is within walking distance to walk along the water to uptown and downtown Bay City. There is an alleyway driveway and parking on the street. Great View of the Bay City Fireworks in the summer! Large kitchen with an island bar & a dining room. Has a dry basement for lots of storage room. The first floor bedroom has a large closet and a room that could be used as an office, craft room, playroom or another bedroom. 2 bedrooms upstairs have large closets and a 1/2 bath. Fresh paint and flooring in some of the rooms.
-
2026-04-11$139,500 Active 585-char remark
Show marketing remark (585 chars)
Location is a Plus! The dead end makes it a quiet street. It is within walking distance to walk along the water to uptown and downtown Bay City. There is an alleyway driveway and parking on the street. Great View of the Bay City Fireworks in the summer! Large kitchen with an island bar & a dining room. Has a dry basement for lots of storage room. The first floor bedroom has a large closet and a room that could be used as an office, craft room, playroom or another bedroom. 2 bedrooms upstairs have large closets and a 1/2 bath. Fresh paint and flooring in some of the rooms.
-
2022-05-09soldstatus $55,000
-
2022-05-05soldstatus $55,000 Closed
-
2022-04-24status Pending
-
2022-04-18historical Keep Showing-Contgcy Appl
-
2022-03-05$69,700 Active
-
2022-03-02historical
-
2022-02-18historical Keep Showing-Contgcy Appl
-
2021-11-12$68,700 Active
-
2019-12-05historical
-
2019-07-15$39,900
-
2015-10-27historical
-
2015-08-07$34,900
-
2010-12-16soldstatus $7,100
-
2010-12-16soldstatus $7,100
-
2010-12-01$6,000
-
2010-12-01$6,000
ⓘ Source: listings_history table (triggers on properties + properties_extension) + one-shot
backfill from property_details.listing_events for pre-trigger history.
Tax reassessment forecast MI · Partial reset (capped growth)
- Current annual tax
- $1,926 · $160/mo
- Projected year-2 tax
- $1,998 · $167/mo
- Expected delta
- +$73/yr (+$6/mo · 3.8%)
ⓘ Screening estimate from a state-policy table — verify with the county assessor before closing.
Climate risk First Street
- Flood 1/10 Low FEMA zone X (unshaded) · 0% chance over 30 yrs
- Wildfire 1/10 Low
- Heat 2/10 Low 7 d/yr ≥97°F today · 14 d/yr by 30 yrs out
- Wind 1/10 Low
- Air quality 2/10 Low 1 unhealthy d/yr today · 2 by 30 yrs out
Nearby sold comps map
Loading sold comps map…
Walkable amenities ~0.75 mi
Loading nearby amenities…
Taxation est. · year 1
- Rental income
- $13,188
- − Mortgage interest
- −$7,534
- − Property taxes
- −$1,926
- − Insurance
- −$672
- − Repairs & maintenance
- −$1,055
- − Management
- −$1,055
- − Depreciation
- −$3,913
- Taxable loss
- −$2,967
- Est. tax savings @ 24.0%
- +$712
- After-tax cash flow
- $68/yr
For passive investors: Depreciation is non-cash, so a rental often shows a tax loss while cash-flowing — sheltering income. Rental losses are passive: they offset passive income freely, and up to $25,000/yr can offset ordinary (W-2) income if you actively participate and your MAGI is under $100k (phasing out to $0 by $150k); unused losses carry forward. On sale, claimed depreciation is recaptured at up to 25%, and gains may owe capital-gains tax (a 1031 exchange can defer both). Figures are a year-1 estimate at your 24.0% rate — not tax advice; consult a CPA.
Schools (NCES district)
- District
- Bay City School District
- NCES district ID
- 2604260
- Math proficiency
- 27% ▼ -8.00%
- Reading proficiency
- 40% ▼ -4.00%
- Median HH income
- $43,833
- Composite
- 28.47/100
- National rank
- #6743
- State rank
- #317 of 540 in MI
Livability — Bay City
- Score
- 68/100
- State rank
- #360
- US rank
- #8912
Category grades
Schools grade is shown separately in the Schools card above.
Census & demographics
- Census place
- Bay City, MI
- County
- Bay County · 36,975 people
- City population
- 25,635
- Metro
- Bay City, MI
- Population (ZIP)
- 25,635
- Household income
- $50,518
- Rent vs Own
- Severe rent burden
- 528.0
Population outlook (Bay County) Hauer SSP2
- Today (2025)
- 101,476 people
- By 2030
- 98,152 · -3.3%
- By 2040
- 89,711 · -11.6%
- By 2050
- 80,614 · -20.6%
- By 2075
- 60,544 · -40.3%
- By 2100
- 41,603 · -59.0%
Race, ethnicity, and origin ACS 2023
- Neighborhood character
- Predominantly White (81%)
- Race & ethnicity
- White 81% Hispanic / Latino 11% Two or more races 10% Black 3%
- Hispanic origin (detail)
- Mexican 9%
- Common ancestry
- Romanian 17% Lithuanian 7% Slovak 2%
- Foreign-born
- 2% · Canada, South Korea
- Languages at home
- 96% English-only · Spanish 2% German/W. Germanic 1%
Political lean MEDSL · Bay
- 2024 margin
- R (+14.7) · D 42.0% · R 56.7% · Other 1.3%
- 2008→2024 swing
- -30.0pp toward R · 2008: 15.3pp · 2024: -14.7pp
- All cycles
- 2024: R+14.7 2020: R+11.6 2016: R+12.6 2012: D+6.0 2008: D+15.3
Not yet ingested
- Civics
- —
Market trends
- HPI YoY
- ▼ -82.21%
- Current HPI
- 183.5774
- Rent YoY
- —
- Metro
- Bay City, MI
- State GDP YoY
- ▲ 1.37%
- F500 in state
- 28
Industry mix (Fortune 500 HQ in MI)
| Industry | F500 HQs | Revenue |
|---|---|---|
| Automotive Parts | 3 | $48B |
|
||
| Automotive | 2 | $372B |
|
||
| Chemicals | 1 | $45B |
|
||
| Automotive Retail | 1 | $29B |
|
||
| Healthcare / Medical Devices | 1 | $23B |
|
||
| Automotive Technology | 1 | $20B |
|
||
Price history
+2141.7% since first listed20 events — show timeline
- 2026-05-05 Price Changed $134,500 MiRealSource-MiMLS
- 2026-05-05 Price Changed $134,500 REALCOMP
- 2026-04-11 Listed $139,500 REALCOMP
- 2026-04-11 Listed $139,500 MiRealSource-MiMLS
- 2022-05-09 Sold (Public Records) $55,000 Public Records
- 2022-05-05 Sold (MLS) $55,000 MiRealSource-MiMLS
- 2022-04-24 Pending — MiRealSource-MiMLS
- 2022-04-18 Contingent — MiRealSource-MiMLS
- 2022-03-05 Listed $69,700 MiRealSource-MiMLS
- 2022-03-02 Listing Removed — MiRealSource-MiMLS
- 2022-02-18 Contingent — MiRealSource-MiMLS
- 2021-11-12 Listed $68,700 MiRealSource-MiMLS
- 2019-12-05 Listing Removed — MiRealSource-MiMLS
- 2019-07-15 Listed $39,900 MiRealSource-MiMLS
- 2015-10-27 Listing Removed — MiRealSource-MiMLS
- 2015-08-07 Listed $34,900 MiRealSource-MiMLS
- 2010-12-16 Sold (MLS) $7,100 REALCOMP
- 2010-12-16 Sold (MLS) $7,100 MiRealSource-MiMLS
- 2010-12-01 Listed $6,000 REALCOMP
- 2010-12-01 Listed $6,000 MiRealSource-MiMLS
Property tax history
+3.2%/yrLatest (2025): $1,926 · -16.9% YoY. Source: county tax records.
Cash-flow waterfall
monthlySold comps — $/sqft
last 12 mo · ≤1 miLoading sold comps…