16 Bittersweet Dr · Robinwood, MD
Flood risk 1/10 · Minimal
- FEMA flood zone
- X (unshaded)
- Chance of flooding over 30 yrs
- 0.0%
- Est. flood insurance / yr
- $473 – $860
Fire risk 2/10 · Minimal
- Est. fire insurance / yr
- $755 – $1,403
Heat risk 5/10 · Moderate
- Hot days now (above 101°F)
- 7 days/yr
- Hot days in 30 yrs
- 16 days/yr
Wind risk 2/10 · Minimal
- Chance of severe wind over 30 yrs
- 3.0%
Air-quality risk 2/10 · Minimal
- Unhealthy air days now
- 1 days/yr
- Unhealthy air days in 30 yrs
- 2 days/yr
Risk factors via First Street. Map © Google.
Why this score? — see what drove the C- grade
The composite is a weighted blend of 9 inputs, each scored 0–100. Each bar is that input's sub-score; the figure is the points it added to the 100-point composite (weight × sub-score).
- Cash flow +22.9/30.0
- ARV discount +7.5/15.0
- DSCR +7.4/10.0
- 1% rule +5.8/10.0
- Rent growth +3.5/5.0
- Livability +3.1/5.0
- Condition / age +2.5/5.0
- Schools +2.3/10.0
- Appreciation +0.0/10.0
$175,000
🖨 Deal sheet 📄 Offer letter ✓ Due diligence
Listing remarks
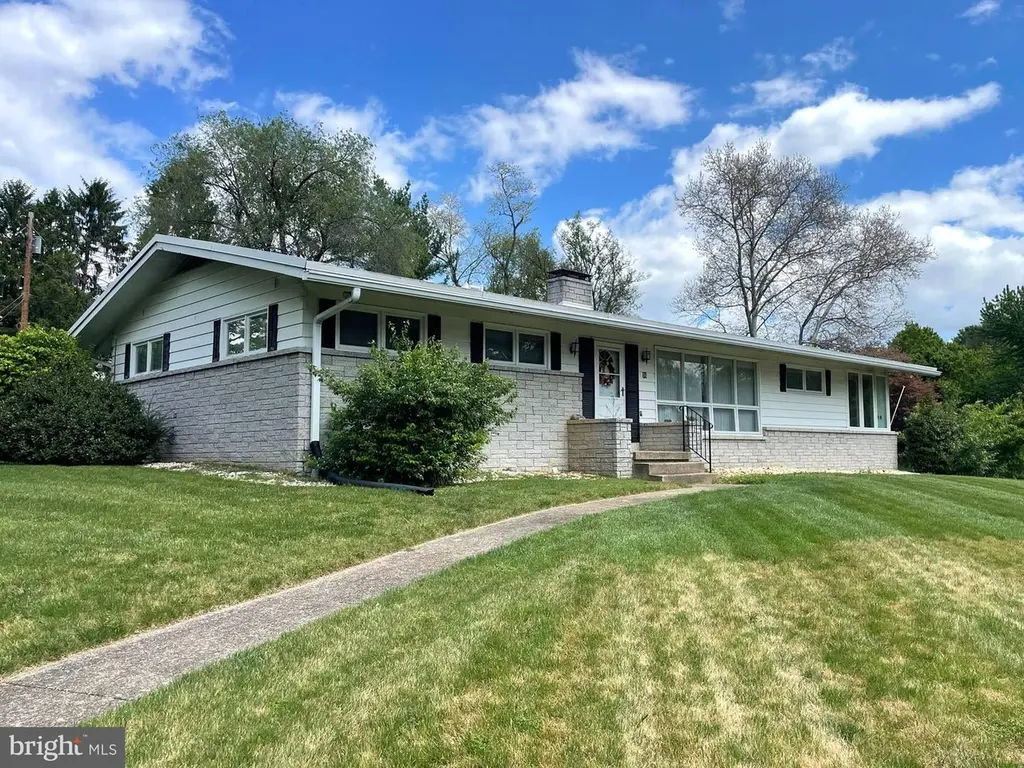
REAL ESTATE AUCTION ON SITE FRIDAY, JUNE 12, 2026 AT 12:00 NOON!! List price is opening bid only. A $25,000 deposit, payable by cashier’s check, will be required of the purchaser at time and place of sale. Estate Sale of a ranch home on a corner lot in the Brightwood Acres neighborhood in Hagerstown, Maryland. The well sized home contains 2,040 square feet each in the main living floor and basement, and is arranged for 3-4 bedrooms, 2.5 baths and under-home garage. The home is conveniently located close to major employers, including Meritus Health (0.5 mile), major highways (I-70 and I-81), and with ample options for shopping and dining along both Dual Highway and Robinwood Drive. The
Key facts
- 0.47 acre lot
- Garage
- Built 1964
Property features AI
Exterior
- Parking: Attached basement garage (1 car); Driveway parking (1 space) — total of 2 parking spaces
- Utilities: Public water; Public sewer
- Home design: Detached home; Estimated year built
- Construction: Frame, stone, and vinyl siding construction; Rubber roof; Other foundation
- Exterior features: Shed; Other above- and below-grade structures; No tidal water
Interior
- Kitchen: Kitchen (appliances not specified)
- Bedrooms: Three bedrooms on the main level
- Flooring: Carpet; Laminate
- Bathrooms: Two full bathrooms (one on main level, one on lower level)
- Heating & cooling: Electric heating (baseboard and radiant); Hot water: Electric; Cooling: Other; 200+ amp electric service
- Interior features: Partially finished basement; Entry-level bedroom; Fireplace (1)
- Laundry & utility: Basement laundry
Neighborhood map
What this means for you Summary
Snapshot
- This is a 3-bed/2.5-bath single-family listed at $175k.
Deal economics
- At list price, monthly cash flow is $308 ($4k/yr) — positive.
- The deal already cash-flows at list — no discount required.
- Meets the 1% rule at list price ($2k rent vs $175k).
- Recommended offer: $172k (1.5% below list) — sets the bar for market timing.
- Cap rate 8.4% vs local median 2.8% in Robinwood — top-decile yield for the area; either an underpriced asset or a hidden risk that comps aren't pricing in. Stress-test before assuming the spread holds.
Location & tenants
- Location reads 62/100 on livability (#322 in MD) — a middle-class / working-renter tenant base. Strengths: employment A-, housing B+, health & safety B+; Watch: crime C-, amenities F, commute F.
- Washingtion County Public Schools (suburban): math 18% / reading 33% proficiency, ranked #13 of 24 in MD (top 54%) — low school quality limits family demand, transient renter base, plan for 1-2y turnover.
- Zoned schools: Eastern Elementary (math 10% / reading 11%, grade F, #590 of 860 statewide, top 70%, 433 students, 85% FRL); E. Russell Hicks Middle (math 8% / reading 31%, grade F, #154 of 225 statewide, top 68%, 824 students, 74% FRL); South Hagerstown High (math 30% / reading 63%, grade D-, #118 of 222 statewide, top 54%, 1,487 students, 78% FRL) — zoned schools average 79% FRL vs 39% district-wide (40 pts higher); higher-poverty schools than district average — tighter screening recommended.
- Market conditions: Rents rising fast (+4.0%/yr); 368 active listings in the ZIP; 4 comparable units currently listed for rent nearby; rentals lingering (median 44d on market — plan ~5-8 weeks vacancy on turnover, expect pricing pressure); 50% of comp listings sitting > 30 days — soft ceiling on asking rent; 232 units permitted in Washington County in 2024 (12 in 5+ unit buildings).
- This rent runs 36% of the median local income ($63k/yr) — at the standard rent-burdened threshold; future hikes will face affordability resistance.
Forward outlook
- Local home prices are declining (-3.0%/yr); year-one equity from $1k of loan paydown is wiped out by about $5k of value loss. Plan a longer hold.
Negotiation context
- It's been on market 25 days — a 2% lower offer ($172k) is reasonable based on typical stale-listing flexibility.
- Current owner paid $118k; 48% above their basis — modest negotiation headroom, anchor on the comps not their cost.
Risks & watch-outs
- Climate carrying-cost: extreme-heat days projected 7→16/yr by 2055 (HVAC capex compounding) — expect insurance premiums to compound above CPI over the hold.
Questions for the listing agent
- Built in 1964 — when were the roof, HVAC, electrical panel, plumbing, and water heater last replaced?
- Is there a deadline driving the sale (1031 exchange, divorce, estate, relocation)? That informs how much negotiation room exists.
- Schools are D-rated, which usually means shorter tenancies and higher turnover. Who's the typical renter profile here, and what's been the actual vacancy rate?
- What's the average days-on-market for RENTAL listings here right now (not sales)? A rising rental-DOM trend means longer vacancies and softer asking-rent achievability than the comps imply.
- What's the recent tenant-quality profile in this submarket — average credit score on applications, eviction rate, late-payment / NSF rate, and stable-employment percentage? A property-management company in the area should have these aggregated.
- How much new for-sale + rental construction is in the pipeline within 1–3 miles? Heavy new supply typically softens prices + rents 12–24 months out; constrained supply supports both.
Investment metrics
- 1% rule
- 1.08% ✓
- Cap rate
- 8.41%
- Cash-on-cash
- 7.55%
- DSCR
- 1.34
- GRM
- 7.7
CMA / ARV
- ARV (median comp)
- $408,625
- List price
- $175,000
- Delta
- -57.17%
- Verdict
- UNDERPRICED
- Comps
- 20 within 1.0 mi
Show comp detail 12 sales within ~0.75 mi
| Address | Dist | Beds/Ba | Sqft | Sold | Price | $/sf | Match |
|---|---|---|---|---|---|---|---|
| 15 Brightwood Dr | 0.27mi | 3/3.0 | 2,496 (-2%) | 6mo | $445,000 | $178 | 78 |
| 2008 Maplewood Dr | 0.24mi | 4/3.0 (+1) | 2,632 (+4%) | 8mo | $425,000 | $161 | 69 |
| 8 Brightwood Dr | 0.25mi | 4/2.0 (+1) | 2,794 (+10%) | 3mo | $409,900 | $147 | 62 |
| 114 Greenwood Dr | 0.04mi | 4/2.5 (+1) | 2,217 (-13%) | 14mo | $340,000 | $153 | 60 |
| 10 Brightwood Cir | 0.15mi | 4/3.0 (+1) | 2,188 (-14%) | 11mo | $502,000 | $229 | 54 |
| 2013 Maplewood Dr | 0.27mi | 4/2.5 (+1) | 2,174 (-14%) | 8mo | $399,900 | $184 | 51 |
| 11025 Eastwood Dr | 0.74mi | 3/2.5 | 2,740 (+8%) | 2mo | $577,500 | $211 | 51 |
| 1813 Winston Dr | 0.35mi | 4/2.0 (+1) | 2,160 (-15%) | 1mo | $448,000 | $207 | 51 |
| 29 Redwood Dr | 0.21mi | 4/3.0 (+1) | 2,212 (-13%) | 14mo | $380,000 | $172 | 50 |
| 80 N Edgewood Dr | 0.37mi | 4/2.0 (+1) | 2,845 (+12%) | 14mo | $364,000 | $128 | 44 |
| 244 Montclair Ct | 0.72mi | 3/2.5 | 2,200 (-13%) | 8mo | $410,000 | $186 | 38 |
| 467 Links View Dr | 0.60mi | 4/2.5 (+1) | 2,280 (-10%) | 20mo | $382,000 | $168 | 34 |
Match score weights: distance 35% · size 25% · config 20% · recency 20%. Top-matched comps best support the ARV.
Projected returns pro-forma
-3.0% appreciation · 4.0% rent growth · sell at horizon
- IRR
- -3.7%
- Equity multiple
- 0.86×
- Total profit
- $-6,792
- Equity at exit
- $26,093
- IRR
- 7.1%
- Equity multiple
- 1.56×
- Total profit
- $27,485
- Equity at exit
- $15,131
Cash invested: $49,000 (down + closing). Projections, not guarantees.
Landlord ↔ Tenant lean methodology
- Overall (STATE)
- 27 Tenant-Leaning
- State Maryland
- 27 Tenant-Leaning · D+14
- County
- — inherits STATE
- City
- — inherits STATE
ZIP-level market 21740
- Rents YoY
- 4.0%
- Active inventory
- 368
- Price-to-rent
- 7.7×
Monthly cashflow live
- Estimated rent
- $1,895 medium interval (Pro) →
- Mortgage (P&I)
- −$918
- Tax from tax record
- −$199 /mo · $2,383/yr
- Insurance
- −$73
- HOA
- −$0
- Vacancy / Maint / Mgmt
- −$398
- Net cashflow
- $308
Break-even live
UW: 25.0% down · 7.5% · 30yr · 1.5% tax · 5.0% vac · 8.0% maint · 8.0% mgmt
Financing live
Cash to close
- Down payment
- $43,750
- Closing costs
- $5,250
- Reserves months
- —
- Total cash needed
- —
Loan-product check · same deal, 3 products live
Conventional
25% down · 7.5% · 30yr
- Down + closing
- —
- Monthly P&I
- —
- Monthly cashflow
- —
- DSCR
- —
- Eligible?
- —
Personal DTI + credit; lowest rate.
DSCR
20% down · 8.5% · 30yr
- Down + closing
- —
- Monthly P&I
- —
- Monthly cashflow
- —
- DSCR
- —
- Eligible?
- —
No personal income docs; deal must DSCR.
Hard money
10% down · 12.0% · 12mo
- Down + closing
- —
- Monthly P&I
- —
- Monthly cashflow
- —
- DSCR
- —
- Eligible?
- —
Short-term bridge; refi at stabilization.
Rent comps 4 comps
| Address | Beds | Baths | Sqft | Rent | $/sqft | DOM | Units | Dist |
|---|---|---|---|---|---|---|---|---|
| 11211 John F Kennedy Dr Hagerstown, MD | 2.0–3.0 | 2.0–2.5 | 1510 | $1,855 | $1.23 | 13d | 17 | 0.56mi |
| 20319 Kellys Ln Hagerstown, MD | 3.0 | 2.5 | 1780 | $2,150 | $1.21 | 44d | 1 | 0.94mi |
| 20321 Kellys Ln Hagerstown, MD | 3.0 | 3.5 | 1780 | $2,150 | $1.21 | 44d | 1 | 0.94mi |
| 11512 Selema Dr Hagerstown, MD | 1.0–3.0 | 1.0–2.5 | 1671 | $1,913 | $1.14 | 10d | 31 | 1.40mi |
Listing history 14 events
-
2026-06-13statusdays on market $175,000 Pending 25 DOM
-
2026-06-10days on market $175,000 Active 23 DOM
-
2026-06-09days on market $175,000 Active 22 DOM
-
2026-06-08days on market $175,000 Active 21 DOM
-
2026-06-07days on market $175,000 Active 20 DOM
-
2026-06-03days on market $175,000 Active 16 DOM
-
2026-06-02days on market $175,000 Active 15 DOM
-
2026-06-01days on market $175,000 Active 14 DOM
-
2026-05-31days on market $175,000 Active 13 DOM
-
2026-05-30days on market $175,000 Active 12 DOM
-
2026-05-18$175,000 Active 829-char remark
-
2026-05-13historical $175,000 829-char remark
-
1989-09-26soldstatus $118,000
-
1984-11-15soldstatus $75,000
ⓘ Source: listings_history table (triggers on properties + properties_extension) + one-shot
backfill from property_details.listing_events for pre-trigger history.
Tax reassessment forecast MD · Partial reset (capped growth)
- Current annual tax
- $2,383 · $199/mo
- Projected year-2 tax
- $2,383 · $199/mo
- Expected delta
- $0/yr ($0/mo · 0.0%)
ⓘ Screening estimate from a state-policy table — verify with the county assessor before closing.
Climate risk First Street
- Flood 1/10 Low FEMA zone X (unshaded) · 0% chance over 30 yrs
- Wildfire 2/10 Low
- Heat 5/10 Major 7 d/yr ≥101°F today · 16 d/yr by 30 yrs out
- Wind 2/10 Low 3% chance of damaging wind over 30 yrs
- Air quality 2/10 Low 1 unhealthy d/yr today · 2 by 30 yrs out
Nearby sold comps map
Loading sold comps map…
Walkable amenities ~0.75 mi
Loading nearby amenities…
Taxation est. · year 1
- Rental income
- $22,745
- − Mortgage interest
- −$9,803
- − Property taxes
- −$2,383
- − Insurance
- −$875
- − Repairs & maintenance
- −$1,820
- − Management
- −$1,820
- − Depreciation
- −$5,091
- Taxable income
- $953
- Est. tax owed @ 24.0%
- −$229
- After-tax cash flow
- $3,468/yr
For passive investors: Depreciation is non-cash, so a rental often shows a tax loss while cash-flowing — sheltering income. Rental losses are passive: they offset passive income freely, and up to $25,000/yr can offset ordinary (W-2) income if you actively participate and your MAGI is under $100k (phasing out to $0 by $150k); unused losses carry forward. On sale, claimed depreciation is recaptured at up to 25%, and gains may owe capital-gains tax (a 1031 exchange can defer both). Figures are a year-1 estimate at your 24.0% rate — not tax advice; consult a CPA.
Schools (NCES district)
- District
- Washingtion County Public Schools
- NCES district ID
- 2400660
- Math proficiency
- 18% ▼ -20.00%
- Reading proficiency
- 33% ▼ -17.00%
- Median HH income
- $54,784
- Composite
- 22.87/100
- National rank
- #8007
- State rank
- #13 of 24 in MD
Livability — Robinwood
- Score
- 62/100
- State rank
- #322
- US rank
- #16826
Category grades
Schools grade is shown separately in the Schools card above.
Census & demographics
- Census place
- Robinwood, MD
- County
- Washington County · 98,861 people
- Metro
- Hagerstown-Martinsburg, MD-WV
- Population (ZIP)
- 64,792
- Household income
- $62,873
- Rent vs Own
- Severe rent burden
- 2832.0
Population outlook (Washington County) Hauer SSP2
- Today (2025)
- 151,614 people
- By 2030
- 151,455 · -0.1%
- By 2040
- 150,097 · -1.0%
- By 2050
- 148,193 · -2.3%
- By 2075
- 146,581 · -3.3%
- By 2100
- 138,025 · -9.0%
Race, ethnicity, and origin ACS 2023
- Neighborhood character
- Majority White (64%)
- Race & ethnicity
- White 64% Black 18% Two or more races 10% Hispanic / Latino 10% Asian 2%
- Hispanic origin (detail)
- Mexican 2% Puerto Rican 2% Dominican 2%
- Common ancestry
- Romanian 2% Lithuanian 1% Slovak 1%
- Foreign-born
- 9% · Canada, China
- Languages at home
- 86% English-only · Spanish 9% French/Haitian/Cajun 1% Chinese 1%
Political lean MEDSL · Washington
- 2024 margin
- Strong R (+23.0) · D 37.3% · R 60.4% · Other 2.3%
- 2008→2024 swing
- -10.2pp toward R · 2008: -12.9pp · 2024: -23.0pp
- All cycles
- 2024: R+23.0 2020: R+20.9 2016: R+32.4 2012: R+18.5 2008: R+12.9
Not yet ingested
- Civics
- —
Market trends
- HPI YoY
- ▼ -248.38%
- Current HPI
- 264.8018
- Rent YoY
- ▲ 4.00%
- Metro
- Hagerstown-Martinsburg, MD-WV
- State GDP YoY
- ▲ 2.97%
- F500 in state
- 12
Industry mix (Fortune 500 HQ in MD)
| Industry | F500 HQs | Revenue |
|---|---|---|
| Aerospace / Defense | 1 | $71B |
|
||
| Utilities | 1 | $25B |
|
||
| Hotels | 1 | $24B |
|
||
| Consumer Goods | 1 | $7B |
|
||
| Real Estate | 1 | $6B |
|
||
| Chemicals | 1 | $2B |
|
||
Price history
+133.3% since first listed5 events — show timeline
- 2026-06-12 Pending — BRIGHT MLS
- 2026-05-18 Listed $175,000 BRIGHT MLS
- 2026-05-13 Coming Soon $175,000 BRIGHT MLS
- 1989-09-26 Sold (Public Records) $118,000 Public Records
- 1984-11-15 Sold (Public Records) $75,000 Public Records
Property tax history
+2.3%/yrLatest (2025): $2,383 · +5.6% YoY. Source: county tax records.
Cash-flow waterfall
monthlySold comps — $/sqft
last 12 mo · ≤1 miLoading sold comps…