 🌊 Lakefront
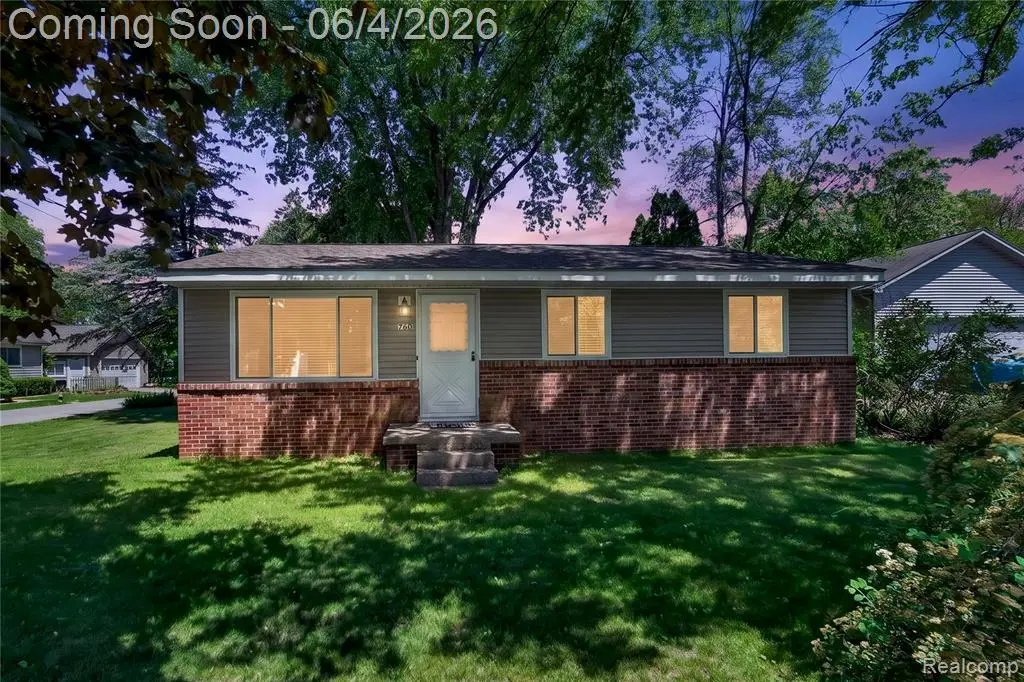
760 Heights Road Rd · Orion, MI
Flood risk 1/10 · Minimal
- FEMA flood zone
- X (unshaded)
- Chance of flooding over 30 yrs
- 0.0%
- Est. flood insurance / yr
- $473 – $860
Fire risk 1/10 · Minimal
- Est. fire insurance / yr
- $784 – $1,456
Heat risk 2/10 · Minimal
- Hot days now (above 96°F)
- 7 days/yr
- Hot days in 30 yrs
- 15 days/yr
Wind risk 2/10 · Minimal
- Chance of severe wind over 30 yrs
- —
Air-quality risk 3/10 · Minor
- Unhealthy air days now
- 2 days/yr
- Unhealthy air days in 30 yrs
- 4 days/yr
Risk factors via First Street. Map © Google.
Why this score? — see what drove the C grade
The composite is a weighted blend of 9 inputs, each scored 0–100. Each bar is that input's sub-score; the figure is the points it added to the 100-point composite (weight × sub-score).
- Cash flow +22.7/30.0
- ARV discount +7.5/15.0
- DSCR +7.3/10.0
- Schools +5.1/10.0
- 1% rule +5.0/10.0
- Rent growth +2.5/5.0
- Livability +2.5/5.0
- Condition / age +2.5/5.0
- Appreciation +0.0/10.0
$309,000
🖨 Deal sheet 📄 Offer letter ✓ Due diligence
Listing remarks MLS
Ranch w/ brick & vinyl maintenance free exterior * * Oversized 2-car Garage * * * Spacious Kitchen: newer flooring, granite counter top, crown molding, and plenty of eating space * * Completely updated Bath, tiled floor and shower, new vanity and lighting * * * Lower Level w/ full bath, shower, tiled and designer style sink * * * Bar seats 6 plus, tile floor, sink and refrigerator * * * Family Room & Entertainment area. Deeded Lot with Utilize All Sports Lake Orion.
Key facts
- 0.26 acre lot
- 2 garage spots
- Built 1979
Property features AI
Finance
- HOA & community: Association fee of $50 per year
Exterior
- Parking: Detached garage, side loading, with electricity (2.5 parking spaces in garage)
- Utilities: Private well water; Natural gas heating (forced air)
- Home design: One-story residential home; Built in 1979; Basement entry level (finished below grade area approx. 900 finished)
- Construction: Aluminum and brick exterior; Basement foundation
- Exterior features: Deck; Porch; All-sports lake access and lake/river privileges (Lake Orion)
Interior
- Kitchen: Kitchen on the entry level (approx. 16 x 10)
- Bedrooms: Three bedrooms on the entry level (approx. 11 x 11, 10 x 10, and 9')
- Bathrooms: Two full bathrooms (one on entry level, one in basement)
- Heating & cooling: Forced air heating; Natural gas fuel
- Interior features: Finished basement; Total of 7 rooms
Neighborhood map
What this means for you Summary
Snapshot
- This is a 3-bed/2.0-bath single-family listed at $309k.
Deal economics
- At list price, monthly cash flow is $532 ($6k/yr) — positive.
- The deal already cash-flows at list — no discount required.
- Meets the 1% rule at list price ($3k rent vs $309k).
- Recommended offer: $304k (1.5% below list) — sets the bar for market timing.
Location & tenants
- Location reads: area grade C — affects rentability + tenant quality, not the cash-flow math above.
- Lake Orion Community Schools (suburban): math 49% / reading 64% proficiency, ranked #45 of 540 in MI (top 8%) — acceptable for families but not a draw, mixed tenant base, ~2y average lease; only 16% free/reduced lunch — higher-income household profile.
- Market conditions: 88 active listings in the ZIP; 5 comparable units currently listed for rent nearby; rentals leasing fast (median 2d on market — plan ~1-2 weeks tenant-placement turnaround); 2,614 units permitted in Oakland County in 2024 (721 in 5+ unit buildings).
Forward outlook
- Local home prices are declining (-3.0%/yr); year-one equity from $2k of loan paydown is wiped out by about $9k of value loss. Plan a longer hold.
- Oakland County population projected at +10% by 2050 — modest demand growth; plan on rents tracking national, not racing it.
Negotiation context
- It's been on market 15 days — a 2% lower offer ($304k) is reasonable based on typical stale-listing flexibility.
- 3 sale attempts since 21y ago; this cycle's ask is 129% above the opening price — seller raised mid-cycle; expect resistance to lowballs.
- Current owner paid $135k; list at $309k implies a 129% gain — meaningful room to come down on a strong offer.
Questions for the listing agent
- Built in 1979 — when were the roof, HVAC, electrical panel, plumbing, and water heater last replaced?
- What does the HOA fee cover, when was the last increase, and are there any pending special assessments or reserve-fund shortfalls?
- Is there a deadline driving the sale (1031 exchange, divorce, estate, relocation)? That informs how much negotiation room exists.
- This sits on a lake — are riparian / water-frontage rights deeded with the parcel? Any dock permits, shoreline easements, or HOA water-use restrictions?
- What's the documented flood / surge / shoreline-erosion history here (FEMA AND non-FEMA — e.g., storm surge, creek backup, septic-field saturation)?
- Any water-quality or seasonal algae-bloom issues that affect tenant satisfaction or short-term-rental demand?
- What's the average days-on-market for RENTAL listings here right now (not sales)? A rising rental-DOM trend means longer vacancies and softer asking-rent achievability than the comps imply.
- What's the recent tenant-quality profile in this submarket — average credit score on applications, eviction rate, late-payment / NSF rate, and stable-employment percentage? A property-management company in the area should have these aggregated.
- How much new for-sale + rental construction is in the pipeline within 1–3 miles? Heavy new supply typically softens prices + rents 12–24 months out; constrained supply supports both.
Investment metrics
- 1% rule
- 1.00% ✓
- Cap rate
- 8.36%
- Cash-on-cash
- 7.37%
- DSCR
- 1.33
- GRM
- 8.3
CMA / ARV
- ARV (on-the-fly)
- $696,384
- Comps found
- 12
Show comp detail 12 sales within ~0.75 mi
| Address | Dist | Beds/Ba | Sqft | Sold | Price | $/sf | Match |
|---|---|---|---|---|---|---|---|
| 533 Bellevue Ave | 0.30mi | 3/2.0 | 1,800 (+4%) | 10mo | $725,000 | $403 | 70 |
| 561 Bellevue Ave | 0.30mi | 3/2.0 | 1,510 (-13%) | 1mo | $630,000 | $417 | 64 |
| 807 Pine Tree Rd W | 0.47mi | 2/2.0 (-1) | 1,740 (+1%) | 11mo | $840,000 | $483 | 63 |
| 664 King Cir | 0.17mi | 3/3.0 | 1,979 (+14%) | 2mo | $1,360,000 | $687 | 62 |
| 734 Woodland Ave | 0.32mi | 3/1.5 | 1,640 (-5%) | 14mo | $275,000 | $168 | 62 |
| 567 Bellevue Ave | 0.30mi | 2/2.0 (-1) | 1,504 (-13%) | 0mo | $502,000 | $334 | 59 |
| 677 King Cir | 0.13mi | 4/2.0 (+1) | 1,950 (+13%) | 11mo | $427,500 | $219 | 59 |
| 892 Heights Rd | 0.16mi | 3/2.0 | 1,966 (+14%) | 14mo | $700,000 | $356 | 58 |
| 561 Bellevue Ave | 0.30mi | 3/2.0 | 1,510 (-13%) | 10mo | $610,000 | $404 | 56 |
| 710 Pine Tree Rd | 0.39mi | 3/2.5 | 1,932 (+12%) | 9mo | $445,000 | $230 | 52 |
| 231 O'connor St | 0.62mi | 3/2.0 | 1,536 (-11%) | 0mo | $670,000 | $436 | 52 |
| 806 Harry Paul Dr | 0.71mi | 3/2.0 | 1,920 (+11%) | 13mo | $255,000 | $133 | 38 |
Match score weights: distance 35% · size 25% · config 20% · recency 20%. Top-matched comps best support the ARV.
Projected returns pro-forma
-3.0% appreciation · 3.0% rent growth · sell at horizon
- IRR
- -5.1%
- Equity multiple
- 0.81×
- Total profit
- $-16,299
- Equity at exit
- $46,073
- IRR
- 4.6%
- Equity multiple
- 1.34×
- Total profit
- $29,044
- Equity at exit
- $26,717
Cash invested: $86,520 (down + closing). Projections, not guarantees.
Landlord ↔ Tenant lean methodology
- Overall (STATE)
- 62 Landlord-Friendly
- State Michigan
- 62 Landlord-Friendly · EVEN
- County
- — inherits STATE
- City
- — inherits STATE
ZIP-level market 48362
- Active inventory
- 88
- Price-to-rent
- 8.3×
Monthly cashflow live
- Estimated rent
- $3,094 high interval (Pro) →
- Mortgage (P&I)
- −$1,620
- Tax from tax record
- −$160 /mo · $1,915/yr
- Insurance
- −$129
- HOA
- −$4
- Vacancy / Maint / Mgmt
- −$650
- Net cashflow
- $532
Break-even live
UW: 25.0% down · 7.5% · 30yr · 1.5% tax · 5.0% vac · 8.0% maint · 8.0% mgmt
Financing live
Cash to close
- Down payment
- $77,250
- Closing costs
- $9,270
- Reserves months
- —
- Total cash needed
- —
Loan-product check · same deal, 3 products live
Conventional
25% down · 7.5% · 30yr
- Down + closing
- —
- Monthly P&I
- —
- Monthly cashflow
- —
- DSCR
- —
- Eligible?
- —
Personal DTI + credit; lowest rate.
DSCR
20% down · 8.5% · 30yr
- Down + closing
- —
- Monthly P&I
- —
- Monthly cashflow
- —
- DSCR
- —
- Eligible?
- —
No personal income docs; deal must DSCR.
Hard money
10% down · 12.0% · 12mo
- Down + closing
- —
- Monthly P&I
- —
- Monthly cashflow
- —
- DSCR
- —
- Eligible?
- —
Short-term bridge; refi at stabilization.
Rent comps 5 comps
| Address | Beds | Baths | Sqft | Rent | $/sqft | DOM | Units | Dist |
|---|---|---|---|---|---|---|---|---|
| 391 Shady Oaks St Lake Orion, MI | 3.0 | 2.0 | 1920 | $2,995 | $1.56 | 1d | 1 | 0.26mi |
| 391 Shady Oaks St Lake Orion, MI | 3.0 | 2.0 | 1920 | $2,995 | $1.56 | 10d | 1 | 0.26mi |
| 711 Kimberly Lake Orion, MI | 1.0–2.0 | 1.0–1.5 | 985 | $1,149 | $1.17 | 1d | 6 | 0.90mi |
| 442 Mystic Cove Ln Lake Orion, MI | 2.0–4.0 | 2.0–3.0 | 1989 | $5,350 | $2.69 | 1d | 4 | 0.98mi |
| 120 S Broadway St Lake Orion, MI | 2.0 | 2.0 | 1065 | $2,950 | $2.77 | 14d | 1 | 1.11mi |
HOA detail
- Monthly dues
- $4 · $48/yr
Listing history 12 events
-
2026-06-18days on market $309,000 Active 15 DOM
-
2026-06-17days on market $309,000 Active 14 DOM
-
2026-06-16days on market $309,000 Active 13 DOM
-
2026-06-15days on market $309,000 Active 12 DOM
-
2026-06-13days on market $309,000 Active 10 DOM
-
2026-06-09days on market $309,000 Active 6 DOM
-
2026-06-08days on market $309,000 Active 5 DOM
-
2026-06-07days on market $309,000 Active 4 DOM
-
2026-06-04remarks 687-char remark
-
2026-06-04status $309,000 Active 1 DOM
-
2026-06-02remarks 682-char remark
-
2026-06-02$309,000 Coming Soon 1 DOM
ⓘ Source: listings_history table (triggers on properties + properties_extension) + one-shot
backfill from property_details.listing_events for pre-trigger history.
Tax reassessment forecast MI · Partial reset (capped growth)
- Current annual tax
- $1,915 · $160/mo
- Projected year-2 tax
- $3,337 · $278/mo
- Expected delta
- +$1,422/yr (+$118/mo · 74.3%)
ⓘ Screening estimate from a state-policy table — verify with the county assessor before closing.
Climate risk First Street
- Flood 1/10 Low FEMA zone X (unshaded) · 0% chance over 30 yrs
- Wildfire 1/10 Low
- Heat 2/10 Low 7 d/yr ≥96°F today · 15 d/yr by 30 yrs out
- Wind 2/10 Low
- Air quality 3/10 Moderate 2 unhealthy d/yr today · 4 by 30 yrs out
Nearby sold comps map
Loading sold comps map…
Walkable amenities ~0.75 mi
Loading nearby amenities…
Taxation est. · year 1
- Rental income
- $37,130
- − Mortgage interest
- −$17,309
- − Property taxes
- −$1,915
- − Insurance
- −$1,545
- − Repairs & maintenance
- −$2,970
- − Management
- −$2,970
- − HOA
- −$48
- − Depreciation
- −$8,989
- Taxable income
- $1,384
- Est. tax owed @ 24.0%
- −$332
- After-tax cash flow
- $6,048/yr
For passive investors: Depreciation is non-cash, so a rental often shows a tax loss while cash-flowing — sheltering income. Rental losses are passive: they offset passive income freely, and up to $25,000/yr can offset ordinary (W-2) income if you actively participate and your MAGI is under $100k (phasing out to $0 by $150k); unused losses carry forward. On sale, claimed depreciation is recaptured at up to 25%, and gains may owe capital-gains tax (a 1031 exchange can defer both). Figures are a year-1 estimate at your 24.0% rate — not tax advice; consult a CPA.
Schools (NCES district)
- District
- Lake Orion Community Schools
- NCES district ID
- 2620730
- Math proficiency
- 49% ▼ -10.00%
- Reading proficiency
- 64% ▼ -10.00%
- Median HH income
- $82,396
- Composite
- 51.21/100
- National rank
- #1755
- State rank
- #45 of 540 in MI
Livability — Orion
No livability data for this city. (Only ~50 U.S. cities are tracked.)
Census & demographics
- City population
- 10,401
- Population (ZIP)
- 14,746
Population outlook (Oakland County) Hauer SSP2
- Today (2025)
- 1,335,747 people
- By 2030
- 1,375,100 · +2.9%
- By 2040
- 1,435,385 · +7.5%
- By 2050
- 1,469,250 · +10.0%
- By 2075
- 1,531,946 · +14.7%
- By 2100
- 1,450,485 · +8.6%
Race, ethnicity, and origin ACS 2023
- Neighborhood character
- Predominantly White (88%)
- Race & ethnicity
- White 88% Two or more races 5% Hispanic / Latino 4% Black 2% Asian 2%
- Common ancestry
- Romanian 11% Lithuanian 5% Slovak 3%
- Foreign-born
- 6% · Canada, China, Dominican Republic
- Languages at home
- 95% English-only · Spanish 1% Chinese 1% German/W. Germanic 1%
Political lean MEDSL · Oakland
- 2024 margin
- D (+10.6) · D 54.4% · R 43.8% · Other 1.9%
- 2008→2024 swing
- -3.9pp toward R · 2008: 14.5pp · 2024: 10.6pp
- All cycles
- 2024: D+10.6 2020: D+14.1 2016: D+8.1 2012: D+8.1 2008: D+14.5
Not yet ingested
- Civics
- —
Market trends
- HPI YoY
- ▼ -307.96%
- Current HPI
- 182.3653
- Rent YoY
- —
- Metro
- —
- State GDP YoY
- ▲ 1.37%
- F500 in state
- 28
Industry mix (Fortune 500 HQ in MI)
| Industry | F500 HQs | Revenue |
|---|---|---|
| Automotive Parts | 3 | $48B |
|
||
| Automotive | 2 | $372B |
|
||
| Chemicals | 1 | $45B |
|
||
| Automotive Retail | 1 | $29B |
|
||
| Healthcare / Medical Devices | 1 | $23B |
|
||
| Automotive Technology | 1 | $20B |
|
||
Price history
+106.0% since first listed10 events — show timeline
- 2026-06-02 Coming Soon $309,000 MiRealSource-MiMLS
- 2013-11-22 Sold (Public Records) $135,000 Public Records
- 2013-10-28 Sold (MLS) $135,000 MiRealSource-MiMLS
- 2013-10-15 Listing Removed — MiRealSource-MiMLS
- 2013-10-12 Listed $135,000 MiRealSource-MiMLS
- 2010-10-01 Listing Removed — REALCOMP
- 2010-06-03 Listed $118,900 REALCOMP
- 2005-07-07 Sold (Public Records) $150,000 Public Records
- 2005-06-06 Sold (MLS) $150,000 REALCOMP
- 2005-04-25 Listed $150,000 REALCOMP
Property tax history
-0.6%/yrLatest (2025): $1,915 · +2.7% YoY. Source: county tax records.
Cash-flow waterfall
monthlySold comps — $/sqft
last 12 mo · ≤1 miLoading sold comps…