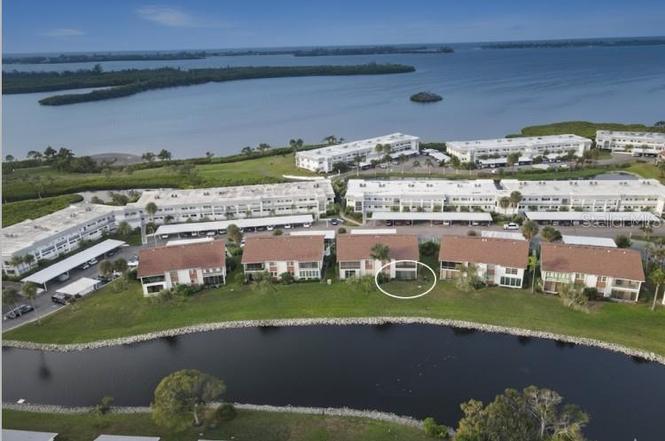
4868 Independence Dr · Cortez, FL
Flood risk 7/10 · Major
- FEMA flood zone
- X (shaded)
- Chance of flooding over 30 yrs
- 0.92%
- Est. flood insurance / yr
- $507 – $1,088
Fire risk 3/10 · Minor
- Est. fire insurance / yr
- $947 – $1,759
Heat risk 10/10 · Severe
- Hot days now (above 106°F)
- 7 days/yr
- Hot days in 30 yrs
- 29 days/yr
Wind risk 10/10 · Severe
- Chance of severe wind over 30 yrs
- 99.0%
Air-quality risk 3/10 · Minor
- Unhealthy air days now
- 2 days/yr
- Unhealthy air days in 30 yrs
- 2 days/yr
Risk factors via First Street. Map © Google.
Why this score? — see what drove the D grade
The composite is a weighted blend of 9 inputs, each scored 0–100. Each bar is that input's sub-score; the figure is the points it added to the 100-point composite (weight × sub-score).
- Cash flow +11.9/30.0
- 1% rule +8.6/10.0
- ARV discount +7.5/15.0
- Schools +4.4/10.0
- DSCR +3.5/10.0
- Livability +3.5/5.0
- Condition / age +2.5/5.0
- Rent growth +1.0/5.0
- Appreciation +0.0/10.0
$190,000
🖨 Deal sheet 📄 Offer letter ✓ Due diligence
Listing remarks
Excellent New Price for this Waterview Lakehouse!! Enjoy effortless first-floor Florida living just miles from the sugar-sand beaches of Anna Maria Island in the highly sought-after, Bayfront Mount Vernon community. This first-floor residence provides easy single-level living and features tile flooring throughout with crown molding, creating a clean, cohesive look with timeless appeal. Both bathrooms have been tastefully remodeled with updated sinks, modern lighting, quartz countertops, new faucets, mirrors, shelving, and toilets, delivering a fresh, spa-like feel. The spacious great room is filled with natural light, offering peaceful lake views and a flexible layout ideal for both comfor
Key facts
- Quartz countertops
- Natural light
- First floor living
Tags
Property features AI
Finance
- Financial info: Total monthly fees $767; total annual fees $9,204; Lease restrictions apply
- HOA & community: Monthly association fee of $767 (includes cable TV, common area taxes, pool, escrow reserves, fidelity bond, internet, building and grounds maintenance, management, pest control, recreational facilities, sewer, trash, water); Association approval required; Association recreation owned, clubhouse, fitness center, park, pool, sidewalks, tennis courts; Senior community; Pets not allowed
Exterior
- Parking: Covered carport (1 space); Guest parking available
- Utilities: Public water; Public sewer; Electricity connected; Cable connected; Internet available
- Home design: Residential condominium; One-story; Faces west; On waterfront with lake view and saltwater canal access
- Construction: Block construction; Shingle roof; Slab foundation; Building number 4868
- Exterior features: Storage; Mature landscaping with trees
Interior
- Kitchen: Dishwasher; Microwave; Range; Refrigerator; Exhaust fan
- Bedrooms: 2 bedrooms (first floor)
- Flooring: Tile
- Bathrooms: 2 full bathrooms
- Heating & cooling: Heat pump heating; Central air conditioning; Humidity control
- Interior features: Ceiling fans; Exhaust fan
- Laundry & utility: Washer; Dryer; Electric dryer hookup; Laundry area in kitchen
Neighborhood map
What this means for you Summary
Snapshot
- This is a 2-bed/2.0-bath condo listed at $190k.
Deal economics
- At list price, monthly cash flow is $-117 ($-1k/yr) — negative.
- To cash-flow at today's rent, offer at most $169k (10.8% below list).
- Meets the 1% rule at list price ($3k rent vs $190k).
- Recommended offer: $167k (12.0% below list) — sets the bar for market timing.
- Cap rate 6.0% vs local median 1.8% in Cortez — top-decile yield for the area; either an underpriced asset or a hidden risk that comps aren't pricing in. Stress-test before assuming the spread holds.
Location & tenants
- Location reads 69/100 on livability (#486 in FL) — a middle-class / working-renter tenant base. Strengths: crime A+, commute A+, housing A+; Watch: cost of living C-, schools D-, amenities F.
- Manatee (suburban): math 54% / reading 50% proficiency, ranked #26 of 73 in FL (top 36%) — acceptable for families but not a draw, mixed tenant base, ~2y average lease.
- Market conditions: Rents falling (-6.1%/yr); 549 active listings in the ZIP; 17 comparable units currently listed for rent nearby; rentals at typical pace (median 24d on market — plan ~3-4 weeks tenant-placement turnaround); 7,472 units permitted in Manatee County in 2024 (1,782 in 5+ unit buildings).
- At $2,592/mo this rent would consume 48% of the median local household income ($64k/yr) (locally 895% of renters already pay >50% of income on rent) — very limited rent-growth headroom before tenants either downsize or default.
Forward outlook
- Local home prices are declining (-3.0%/yr); year-one equity from $1k of loan paydown is wiped out by about $6k of value loss. Plan a longer hold.
- Manatee County population projected at +43% by 2050 — long-run rental-demand tailwind backs the buy-and-hold thesis.
Negotiation context
- It's been on market 147 days — a 12% lower offer ($167k) is reasonable based on typical stale-listing flexibility.
Risks & watch-outs
- Watch-outs: flood insurance adds $66/mo; HOA is 30% of rent.
- Climate carrying-cost: major flood risk; severe wind risk, 99% chance of damaging wind over 30y; extreme-heat days projected 7→29/yr by 2055 (HVAC capex compounding) — expect insurance premiums to compound above CPI over the hold.
Questions for the listing agent
- What do current leases actually rent for vs. the listed asking? Can we see a recent rent roll and the last 12 months of T-12 income?
- It's been on market 147 days. Have you received any prior offers? Is the seller open to a 12% concession, seller financing, or rate buy-down credit?
- What's the actual annual flood-insurance premium (NFIP or private), and is the property in a SFHA with mandatory coverage?
- What does the HOA fee cover, when was the last increase, and are there any pending special assessments or reserve-fund shortfalls?
- Any open or pending special assessments — roof, HVAC, plumbing, elevator, façade? What's the per-unit balance and payoff schedule, and is the seller paying it off at close or rolling it to the buyer?
- Why hasn't it sold? Are there any deal-killer items the seller is aware of (foundation, flood, title, zoning, code violations)?
- Is there a deadline driving the sale (1031 exchange, divorce, estate, relocation)? That informs how much negotiation room exists.
- Schools are D-rated, which usually means shorter tenancies and higher turnover. Who's the typical renter profile here, and what's been the actual vacancy rate?
- The area grade is low — what's the realistic commute time and amenity access for the typical tenant pool here? Any planned neighborhood developments (good or bad) we should know about?
- What's the average days-on-market for RENTAL listings here right now (not sales)? A rising rental-DOM trend means longer vacancies and softer asking-rent achievability than the comps imply.
- What's the recent tenant-quality profile in this submarket — average credit score on applications, eviction rate, late-payment / NSF rate, and stable-employment percentage? A property-management company in the area should have these aggregated.
- How much new apartment / multifamily construction is in the pipeline within 1–3 miles? Heavy new supply (>2% of stock underway) typically softens rents 12–24 months out; light construction supports rent growth.
Investment metrics
- 1% rule
- 1.36% ✓
- Cap rate
- 5.98%
- Cash-on-cash
- -1.13%
- DSCR
- 0.95
- GRM
- 6.1
CMA / ARV
No comps found within radius.
Projected returns pro-forma
-3.0% appreciation · 0.0% rent growth · sell at horizon
- IRR
- -26.3%
- Equity multiple
- 0.15×
- Total profit
- $-45,245
- Equity at exit
- $28,330
- IRR
- -57.1%
- Equity multiple
- -0.43×
- Total profit
- $-76,027
- Equity at exit
- $16,428
Cash invested: $53,200 (down + closing). Projections, not guarantees.
Landlord ↔ Tenant lean methodology
- Overall (STATE)
- 87 Strongly Landlord-Friendly
- State Florida
- 87 Strongly Landlord-Friendly · R+3
- County
- — inherits STATE
- City
- — inherits STATE
ZIP-level market 34210
- Rents YoY
- -6.1%
- Active inventory
- 549
- Price-to-rent
- 6.1×
Monthly cashflow live
- Estimated rent
- $2,592 high interval (Pro) →
- Mortgage (P&I)
- −$996
- Tax from tax record
- −$255 /mo · $3,061/yr
- Insurance
- −$79
- Flood insurance flood zone
- −$66 /mo · $798/yr
- HOA
- −$767
- Vacancy / Maint / Mgmt
- −$544
- Net cashflow
- $-117
Break-even live
UW: 25.0% down · 7.5% · 30yr · 1.5% tax · 5.0% vac · 8.0% maint · 8.0% mgmt
Financing live
Cash to close
- Down payment
- $47,500
- Closing costs
- $5,700
- Reserves months
- —
- Total cash needed
- —
Loan-product check · same deal, 3 products live
Conventional
25% down · 7.5% · 30yr
- Down + closing
- —
- Monthly P&I
- —
- Monthly cashflow
- —
- DSCR
- —
- Eligible?
- —
Personal DTI + credit; lowest rate.
DSCR
20% down · 8.5% · 30yr
- Down + closing
- —
- Monthly P&I
- —
- Monthly cashflow
- —
- DSCR
- —
- Eligible?
- —
No personal income docs; deal must DSCR.
Hard money
10% down · 12.0% · 12mo
- Down + closing
- —
- Monthly P&I
- —
- Monthly cashflow
- —
- DSCR
- —
- Eligible?
- —
Short-term bridge; refi at stabilization.
Rent comps 17 comps
| Address | Beds | Baths | Sqft | Rent | $/sqft | DOM | Units | Dist |
|---|---|---|---|---|---|---|---|---|
| 4813 Independence Dr Bradenton, FL | 2.0 | 2.0 | 1147 | $1,695 | $1.48 | 24d | 1 | 0.03mi |
| 4782 Independence Dr #4782 Bradenton, FL | 2.0 | 2.0 | 1188 | $2,000 | $1.68 | 24d | 1 | 0.07mi |
| 4765 Independence Dr Bradenton, FL | 2.0 | 2.0 | 1350 | $4,300 | $3.19 | 24d | 1 | 0.08mi |
| 9819 Hernando Ct Unit 29-A Bradenton, FL | 2.0 | 2.0 | 1078 | $2,500 | $2.32 | 24d | 1 | 0.48mi |
| 4607 103rd Street Ct W Bradenton, FL | 2.0 | 2.0 | 930 | $2,100 | $2.26 | 11d | 1 | 0.63mi |
| 8626 54th Ave W #29 Bradenton, FL | 2.0 | 2.0 | 1561 | $2,400 | $1.54 | 16d | 1 | 0.64mi |
| 4326 80th St W Bradenton, FL | 2.0 | 2.0 | 1564 | $1,600 | $1.02 | 2d | 1 | 1.12mi |
| 4325 80th St W Bradenton, FL | 3.0 | 1.5 | 1000 | $2,200 | $2.20 | 24d | 1 | 1.14mi |
| 3426 79th Street Cir W #203 Bradenton, FL | 3.0 | 2.5 | 1857 | $5,100 | $2.75 | 24d | 1 | 1.30mi |
| 3418 79th Street Cir W #302 Bradenton, FL | 2.0 | 2.0 | 1657 | $2,949 | $1.78 | 16d | 1 | 1.32mi |
| 3412 79th Street Cir W #103 Bradenton, FL | 3.0 | 2.5 | 1854 | $3,500 | $1.89 | 24d | 1 | 1.34mi |
| 4005 78th St W Bradenton, FL | 3.0 | 2.0 | 1000 | $1,895 | $1.90 | 3d | 1 | 1.35mi |
| 7930 34th Ave W #303 Bradenton, FL | 3.0 | 2.5 | 1854 | $4,000 | $2.16 | 16d | 1 | 1.38mi |
| 7930 34th Ave W #102 Bradenton, FL | 2.0 | 2.0 | 1657 | $6,000 | $3.62 | 24d | 1 | 1.38mi |
| 3450 77th St W #303 Bradenton, FL | 3.0 | 2.5 | 1857 | $5,400 | $2.91 | 24d | 1 | 1.43mi |
| 7840 34th Ave W #102 Bradenton, FL | 2.0 | 2.0 | 1650 | $2,800 | $1.70 | 24d | 1 | 1.44mi |
| 7840 34th Ave W #202 Bradenton, FL | 2.0 | 2.0 | 1650 | $3,000 | $1.82 | 24d | 1 | 1.44mi |
HOA detail condo
- Monthly dues
- $767 · $9,204/yr
- Likely covers
- water
- Assessments
- None detected in remarks — confirm with the listing agent.
Listing history 21 events
-
2026-06-18days on market $190,000 Active 147 DOM
-
2026-06-17days on market $190,000 Active 146 DOM
-
2026-06-16days on market $190,000 Active 145 DOM
-
2026-06-15days on market $190,000 Active 144 DOM
-
2026-06-13days on market $190,000 Active 142 DOM
-
2026-06-13days on market $190,000 Active 141 DOM
-
2026-06-10days on market $190,000 Active 139 DOM
-
2026-06-09days on market $190,000 Active 138 DOM
-
2026-06-08days on market $190,000 Active 137 DOM
-
2026-06-08days on market $190,000 Active 136 DOM
-
2026-06-03days on market $190,000 Active 132 DOM
-
2026-06-02days on market $190,000 Active 131 DOM
-
2026-06-01days on market $190,000 Active 130 DOM
-
2026-05-31days on market $190,000 Active 129 DOM
-
2026-04-23price $190,000
-
2026-02-27price $230,000
-
2026-01-22$255,000 Active
-
2005-05-18soldstatus $230,000
-
2001-12-05soldstatus $100,000
-
1992-02-05soldstatus $68,500
-
1980-06-01soldstatus $60,000
ⓘ Source: listings_history table (triggers on properties + properties_extension) + one-shot
backfill from property_details.listing_events for pre-trigger history.
Tax reassessment forecast FL · Resets to sale price
- Current annual tax
- $3,061 · $255/mo
- Projected year-2 tax
- $3,061 · $255/mo
- Expected delta
- $0/yr ($0/mo · -0.0%)
ⓘ Screening estimate from a state-policy table — verify with the county assessor before closing.
Climate risk First Street
- Flood 7/10 Severe FEMA zone X (shaded) · 92% chance over 30 yrs
- Wildfire 3/10 Moderate
- Heat 10/10 Extreme 7 d/yr ≥106°F today · 29 d/yr by 30 yrs out
- Wind 10/10 Extreme 99% chance of damaging wind over 30 yrs
- Air quality 3/10 Moderate 2 unhealthy d/yr today · 2 by 30 yrs out
Nearby sold comps map
Loading sold comps map…
Walkable amenities ~0.75 mi
Loading nearby amenities…
Taxation est. · year 1
- Rental income
- $31,102
- − Mortgage interest
- −$10,643
- − Property taxes
- −$3,061
- − Insurance
- −$1,748
- − Repairs & maintenance
- −$2,488
- − Management
- −$2,488
- − HOA
- −$9,204
- − Depreciation
- −$5,527
- Taxable loss
- −$4,057
- Est. tax savings @ 24.0%
- +$974
- After-tax cash flow
- $-425/yr
For passive investors: Depreciation is non-cash, so a rental often shows a tax loss while cash-flowing — sheltering income. Rental losses are passive: they offset passive income freely, and up to $25,000/yr can offset ordinary (W-2) income if you actively participate and your MAGI is under $100k (phasing out to $0 by $150k); unused losses carry forward. On sale, claimed depreciation is recaptured at up to 25%, and gains may owe capital-gains tax (a 1031 exchange can defer both). Figures are a year-1 estimate at your 24.0% rate — not tax advice; consult a CPA.
Schools (NCES district)
- District
- Manatee
- NCES district ID
- 1201230
- Math proficiency
- 54% ▼ -6.00%
- Reading proficiency
- 50% ▼ -2.00%
- Median HH income
- $49,607
- Composite
- 44.43/100
- National rank
- #2806
- State rank
- #26 of 73 in FL
Livability — Cortez
- Score
- 69/100
- State rank
- #486
- US rank
- #8944
Category grades
Schools grade is shown separately in the Schools card above.
Census & demographics
- Census place
- Cortez, FL
- County
- Manatee County · 416,364 people
- City population
- 759
- Metro
- North Port-Sarasota-Bradenton, FL
- Population (ZIP)
- 17,682
- Household income
- $64,244
- Rent vs Own
- Severe rent burden
- 895.0
Population outlook (Manatee County) Hauer SSP2
- Today (2025)
- 447,342 people
- By 2030
- 488,911 · +9.3%
- By 2040
- 567,934 · +27.0%
- By 2050
- 637,995 · +42.6%
- By 2075
- 781,970 · +74.8%
- By 2100
- 848,272 · +89.6%
Race, ethnicity, and origin ACS 2023
- Neighborhood character
- Predominantly White (68%)
- Race & ethnicity
- White 68% Hispanic / Latino 20% Black 8% Two or more races 7% Asian 2%
- Hispanic origin (detail)
- Mexican 4% Puerto Rican 3% Cuban 7%
- Common ancestry
- Hispanic 4% Romanian 3% Lithuanian 3%
- Foreign-born
- 17% · Canada, China, Jamaica
- Languages at home
- 76% English-only · Spanish 15% French/Haitian/Cajun 4% Other Indo-European 1%
Political lean MEDSL · Manatee
- 2024 margin
- Strong R (+23.5) · D 37.9% · R 61.4%
- 2008→2024 swing
- -16.5pp toward R · 2008: -7.0pp · 2024: -23.5pp
- All cycles
- 2024: R+23.5 2020: R+16.1 2016: R+17.1 2012: R+12.5 2008: R+7.0
Not yet ingested
- Civics
- —
Market trends
- HPI YoY
- ▼ -162.68%
- Current HPI
- 246.9247
- Rent YoY
- ▼ -6.08%
- Metro
- North Port-Sarasota-Bradenton, FL
- State GDP YoY
- ▲ 3.28%
- F500 in state
- 36
Industry mix (Fortune 500 HQ in FL)
| Industry | F500 HQs | Revenue |
|---|---|---|
| Industrial Technology | 2 | $29B |
|
||
| Insurance | 2 | $17B |
|
||
| Retail | 1 | $60B |
|
||
| Technology Distribution | 1 | $58B |
|
||
| Homebuilding | 1 | $35B |
|
||
| Technology Manufacturing | 1 | $35B |
|
||
Price history
+216.7% since first listed7 events — show timeline
- 2026-04-23 Price Changed $190,000 Stellar MLS as Distributed by MLS Grid
- 2026-02-27 Price Changed $230,000 Stellar MLS as Distributed by MLS Grid
- 2026-01-22 Listed $255,000 Stellar MLS as Distributed by MLS Grid
- 2005-05-18 Sold (Public Records) $230,000 Public Records
- 2001-12-05 Sold (Public Records) $100,000 Public Records
- 1992-02-05 Sold (Public Records) $68,500 Public Records
- 1980-06-01 Sold (Public Records) $60,000 Public Records
Property tax history
+5.1%/yrLatest (2025): $3,061 · -12.3% YoY. Source: county tax records.
Cash-flow waterfall
monthlySold comps — $/sqft
last 12 mo · ≤1 miLoading sold comps…