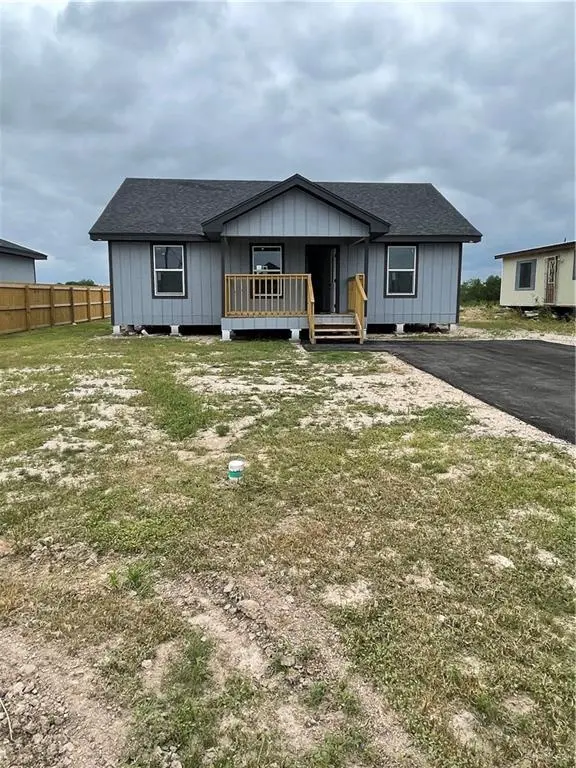
2421 Trinidad Ln · Alton, TX
Flood risk 1/10 · Minimal
- FEMA flood zone
- X
- Chance of flooding over 30 yrs
- 0.0%
- Est. flood insurance / yr
- $507 – $1,088
Fire risk 6/10 · Moderate
- Est. fire insurance / yr
- $1,222 – $2,270
Heat risk 8/10 · Major
- Hot days now (above 112°F)
- 6 days/yr
- Hot days in 30 yrs
- 17 days/yr
Wind risk 8/10 · Major
- Chance of severe wind over 30 yrs
- 99.0%
Air-quality risk 2/10 · Minimal
- Unhealthy air days now
- 0 days/yr
- Unhealthy air days in 30 yrs
- 1 days/yr
Risk factors via First Street. Map © Google.
Why this score? — see what drove the D- grade
The composite is a weighted blend of 9 inputs, each scored 0–100. Each bar is that input's sub-score; the figure is the points it added to the 100-point composite (weight × sub-score).
- Appreciation +10.0/10.0
- ARV discount +9.5/15.0
- Cash flow +6.3/30.0
- Rent growth +3.1/5.0
- Livability +2.9/5.0
- Condition / age +2.5/5.0
- Schools +1.7/10.0
- 1% rule +1.5/10.0
- DSCR +0.6/10.0
$178,000
🖨 Deal sheet (PDF) 📄 Offer letter ✓ Due diligence
Listing remarks
NEW Construction home!! this beautifully designed 3-bedroom, 2-bath home offering the perfect blend of comfort, space, and everyday convenience. Sitting on a generous 0.18 acre lot outside city limits. The home features a bright, open layout that flows effortlessly, making great for a growing family. This is a quality built home ready for you to move in!! Located just minutes from schools, shopping, and dining, this home is just perfect for you!
Key facts
- 8,259 sq ft lot
- Built 2026
- Listed 44 days
Property features AI
Finance
- Other: Property listed by Zapphire Real Estate Group
- HOA & community: No homeowners association; Community features: Other
Exterior
- Parking: No garage
- Security: Smoke detector(s)
- Utilities: City sewer
- Home design: Seller-measured living area
- Construction: Siding exterior; Pillar/post/pier foundation
- Exterior features: Wood fencing; Covered patio; Patio; Paved road access; Shingle roof
Interior
- Kitchen: No conveying appliances (kitchen appliances not included)
- Bedrooms: Master bedroom with walk-in closet(s)
- Flooring: Laminate; Other flooring
- Bathrooms: 2 full bathrooms
- Heating & cooling: Central heating (electric); Central air conditioning (electric)
- Interior features: Quartz countertops; Ceiling fans; Walk-in closet(s); Double-pane energy-efficient windows; Window coverings (other); No window coverings in some windows
- Laundry & utility: Laundry room with washer/dryer connection; Electric water heater; Tankless water heater
Neighborhood map
What this means for you Summary
Snapshot
- This is a 3-bed/2.0-bath single-family listed at $178k.
Deal economics
- At list price, monthly cash flow is $-316 ($-4k/yr) — negative.
- To cash-flow at today's rent, offer at most $132k (25.7% below list).
- To meet the 1% rule (rent ≥ 1% of price), the offer needs to be $116k (35.0% below list).
- Recommended offer: $116k (35.0% below list) — sets the bar for 1% rule.
- Cap rate 4.2% vs local median 2.6% in Alton — top-decile yield for the area; either an underpriced asset or a hidden risk that comps aren't pricing in. Stress-test before assuming the spread holds.
Location & tenants
- Location reads 58/100 on livability (#1,230 in TX) — a working-class tenant base; expect higher turnover. Strengths: cost of living A+, housing A; Watch: crime F, amenities F, commute F.
- Mission CISD (urban): math 15% / reading 28% proficiency, ranked #775 of 826 in TX (top 94%) — low school quality limits family demand, transient renter base, plan for 1-2y turnover; 78% free/reduced lunch — lower-income household profile, screen leases tightly.
- Zoned schools: Alton El (math 17% / reading 32%, grade F, #3,052 of 4,322 statewide, top 74%, 390 students, 95% FRL); Mission H S (math 18% / reading 28%, grade F, #1,348 of 1,632 statewide, top 83%, 2,218 students, 91% FRL).
- Market conditions: Rents rising (+2.5%/yr); 624 active listings in the ZIP; 27 comparable units currently listed for rent nearby; rentals at typical pace (median 25d on market — plan ~3-4 weeks tenant-placement turnaround); 7,378 units permitted in Hidalgo County in 2024 (641 in 5+ unit buildings).
Forward outlook
- In year one you build about $19k of equity ($1k loan paydown + $18k appreciation (10.0% local appreciation)).
- Hidalgo County population projected at +28% by 2050 — long-run rental-demand tailwind backs the buy-and-hold thesis.
- By year 2, paydown + projected appreciation supports a ~$31k cash-out refi (75% LTV) — recoverable capital for the next deal without selling this one.
Negotiation context
- It's been on market 45 days — a 3% lower offer ($173k) is reasonable based on typical stale-listing flexibility.
Risks & watch-outs
- Climate carrying-cost: severe wind risk, 99% chance of damaging wind over 30y; major wildfire risk; extreme-heat days projected 6→17/yr by 2055 (HVAC capex compounding) — expect insurance premiums to compound above CPI over the hold.
Questions for the listing agent
- What do current leases actually rent for vs. the listed asking? Can we see a recent rent roll and the last 12 months of T-12 income?
- It's been on market 45 days. Have you received any prior offers? Is the seller open to a 35% concession, seller financing, or rate buy-down credit?
- Is there a deadline driving the sale (1031 exchange, divorce, estate, relocation)? That informs how much negotiation room exists.
- Schools are F-rated, which usually means shorter tenancies and higher turnover. Who's the typical renter profile here, and what's been the actual vacancy rate?
- Crime grade is F in this area — have there been break-ins, vandalism, or insurance claims at this property in the last 3 years? What carrier currently insures it and at what premium?
- The area grade is low — what's the realistic commute time and amenity access for the typical tenant pool here? Any planned neighborhood developments (good or bad) we should know about?
- What's the average days-on-market for RENTAL listings here right now (not sales)? A rising rental-DOM trend means longer vacancies and softer asking-rent achievability than the comps imply.
- What's the recent tenant-quality profile in this submarket — average credit score on applications, eviction rate, late-payment / NSF rate, and stable-employment percentage? A property-management company in the area should have these aggregated.
- How much new for-sale + rental construction is in the pipeline within 1–3 miles? Heavy new supply typically softens prices + rents 12–24 months out; constrained supply supports both.
Investment metrics
- 1% rule
- 0.65% ✗
- Cap rate
- 4.16%
- Cash-on-cash
- -7.62%
- DSCR
- 0.66
- GRM
- 12.8
CMA / ARV
- ARV (median comp)
- $186,434
- List price
- $178,000
- Delta
- -4.52%
- Verdict
- FAIR
- Comps
- 19 within 1.0 mi
Show comp detail 4 sales within ~0.75 mi
| Address | Dist | Beds/Ba | Sqft | Sold | Price | $/sf | Match |
|---|---|---|---|---|---|---|---|
| 2207 109th St | 0.22mi | 3/2.0 | 1,120 (-3%) | 17mo | $189,900 | $170 | 72 |
| 7734 Teo Dr | 0.61mi | 3/2.0 | 1,200 (+4%) | 6mo | $189,000 | $158 | 59 |
| 2903 N CR 110 St | 0.50mi | 3/2.0 | 1,008 (-12%) | 15mo | $165,000 | $164 | 44 |
| 604 W Stevenson Ave | 0.54mi | 3/2.0 | 1,310 (+14%) | 13mo | $229,000 | $175 | 41 |
Match score weights: distance 35% · size 25% · config 20% · recency 20%. Top-matched comps best support the ARV.
Projected returns pro-forma
10.0% appreciation · 2.45% rent growth · sell at horizon
- IRR
- 18.8%
- Equity multiple
- 2.53×
- Total profit
- $76,175
- Equity at exit
- $160,357
- IRR
- 17.3%
- Equity multiple
- 5.79×
- Total profit
- $238,941
- Equity at exit
- $345,815
Cash invested: $49,840 (down + closing). Projections, not guarantees.
Landlord ↔ Tenant lean methodology
- Overall (STATE)
- 87 Strongly Landlord-Friendly
- State Texas
- 87 Strongly Landlord-Friendly · R+5
- County
- — inherits STATE
- City
- — inherits STATE
ZIP-level market 78573
- Home prices YoY
- 8.0%
- Rents YoY
- 2.5%
- Active inventory
- 624
- Price-to-rent
- 12.8×
Monthly cashflow live
- Estimated rent
- $1,157 high interval (Pro) →
- Mortgage (P&I)
- −$933
- Tax est. 1.5%
- −$222 /mo · $2,670/yr
- Insurance
- −$74
- HOA
- −$0
- Vacancy / Maint / Mgmt
- −$243
- Net cashflow
- $-316
Break-even live
Sensitivity live
| Price | -10% $-193 | -5% $-255 | +0% $-316 | +5% $-378 | +10% $-439 |
|---|---|---|---|---|---|
| Rent | -10% $-408 | -5% $-362 | +0% $-316 | +5% $-271 | +10% $-225 |
| Rate | -1.0pp $-227 | -0.5pp $-271 | base $-316 | +0.5pp $-362 | +1.0pp $-409 |
UW: 25.0% down · 7.5% · 30yr · 1.5% tax · 5.0% vac · 8.0% maint · 8.0% mgmt
Financing live
Cash to close
- Down payment
- $44,500
- Closing costs
- $5,340
- Reserves months
- —
- Total cash needed
- —
Loan-product check · same deal, 3 products live
Conventional
25% down · 7.5% · 30yr
- Down + closing
- —
- Monthly P&I
- —
- Monthly cashflow
- —
- DSCR
- —
- Eligible?
- —
Personal DTI + credit; lowest rate.
DSCR
20% down · 8.5% · 30yr
- Down + closing
- —
- Monthly P&I
- —
- Monthly cashflow
- —
- DSCR
- —
- Eligible?
- —
No personal income docs; deal must DSCR.
Hard money
10% down · 12.0% · 12mo
- Down + closing
- —
- Monthly P&I
- —
- Monthly cashflow
- —
- DSCR
- —
- Eligible?
- —
Short-term bridge; refi at stabilization.
Rent comps 27 comps
| Address | Beds | Baths | Sqft | Rent | $/sqft | DOM | Units | Dist |
|---|---|---|---|---|---|---|---|---|
| 1001 W Sunset Valley St Unit 4 Alton, TX | 3.0 | 2.0 | 1092 | $1,100 | $1.01 | 24d | 1 | 0.63mi |
| 1001 W Sunset Valley St Unit 4 Alton, TX | 3.0 | 2.0 | 1092 | $1,100 | $1.01 | 44d | 1 | 0.63mi |
| 1001 N Maryland St Apt 1 Alton, TX | 3.0 | 2.0 | 1092 | $1,075 | $0.98 | 15d | 1 | 0.63mi |
| 1000 Kentucky St Unit 1 Alton, TX | 2.0 | 2.0 | 928 | $1,075 | $1.16 | 44d | 1 | 0.64mi |
| 1001 W Sunset Valley St Alton, TX | 3.0 | 2.0 | 1050 | $1,200 | $1.14 | 44d | 1 | 0.64mi |
| 913 W Sunset Valley St Mission, TX | 3.0 | 2.0 | 1040 | $1,300 | $1.25 | 44d | 1 | 0.64mi |
| 805 W Sunset Valley St Unit 3 Alton, TX | 2.0 | 2.0 | 928 | $1,050 | $1.13 | 24d | 1 | 0.65mi |
| 912 Kentucky St #3 Alton, TX | 2.0 | 2.0 | 950 | $1,100 | $1.16 | 15d | 1 | 0.66mi |
| 908 Kentucky St Unit 3 Alton, TX | 2.0 | 2.0 | 928 | $1,075 | $1.16 | 24d | 1 | 0.68mi |
| 1005 W La Pointe Ave Unit 3 Alton, TX | 3.0 | 2.0 | 1100 | $1,175 | $1.07 | 44d | 1 | 0.69mi |
| 1005 W La Pointe Ave Unit 3 Alton, TX | 3.0 | 2.0 | 1100 | $1,175 | $1.07 | 24d | 1 | 0.69mi |
| 904 W Mahala Ave Unit 3 Alton, TX | 2.0 | 2.0 | 900 | $925 | $1.03 | 24d | 1 | 0.75mi |
| 805 N Maryland St Unit 3 Mission, TX | 2.0 | 2.0 | 893 | $1,115 | $1.25 | 22d | 1 | 0.76mi |
| 908 W Kohala Ave Unit 1 Alton, TX | 2.0 | 2.0 | 900 | $950 | $1.06 | 15d | 1 | 0.79mi |
| 713 N Maryland St Unit 4 Alton, TX | 3.0 | 2.0 | 1000 | $1,100 | $1.10 | 24d | 1 | 0.80mi |
| 909 W Kohala Ave Unit 1 Alton, TX | 3.0 | 2.0 | 1100 | $1,050 | $0.95 | 15d | 1 | 0.81mi |
| 1413 N Inspiration Blvd Alton, TX | 2.0 | 2.0 | 1050 | $950 | $0.90 | 24d | 1 | 0.93mi |
| 1413 N Inspiration Blvd Unit 200 Alton, TX | 2.0 | 2.0 | 1050 | $950 | $0.90 | 44d | 1 | 0.93mi |
| 308 W Campeche Ave Unit 1 Alton, TX | 2.0 | 2.0 | 916 | $1,000 | $1.09 | 44d | 1 | 1.01mi |
| 312 W Campeche Ave Unit 4 Alton, TX | 3.0 | 2.0 | 1000 | $1,165 | $1.17 | 24d | 1 | 1.01mi |
| 312 W Campeche Ave Unit 1 Alton, TX | 2.0 | 2.0 | 1000 | $1,065 | $1.06 | 24d | 1 | 1.01mi |
| 307 W Campeche Ave Unit 3 Alton, TX | 2.0 | 2.0 | 980 | $1,100 | $1.12 | 24d | 1 | 1.05mi |
| 307 W Campeche Ave Unit 4 Alton, TX | 3.0 | 2.0 | 1148 | $1,300 | $1.13 | 24d | 1 | 1.05mi |
| 120 W Diamond Ave Unit 3 Alton, TX | 2.0 | 2.0 | 958 | $1,100 | $1.15 | 24d | 1 | 1.08mi |
| 308 W Campeche Ave Unit 2 Alton, TX | 3.0 | 2.0 | 1184 | $1,165 | $0.98 | 44d | 1 | 1.08mi |
| 116 W Campeche Ave Unit 4 Alton, TX | 3.0 | 2.0 | 1175 | $1,200 | $1.02 | 44d | 1 | 1.14mi |
| 116 W Campeche Ave Unit 3 Alton, TX | 2.0 | 2.0 | 900 | $1,100 | $1.22 | 44d | 1 | 1.14mi |
Listing history 16 events
-
2026-06-21days on market $178,000 Active 45 DOM
-
2026-06-18days on market $178,000 Active 42 DOM
-
2026-06-17days on market $178,000 Active 41 DOM
-
2026-06-16days on market $178,000 Active 40 DOM
-
2026-06-15days on market $178,000 Active 39 DOM
-
2026-06-14days on market $178,000 Active 37 DOM
-
2026-06-10days on market $178,000 Active 34 DOM
-
2026-06-09days on market $178,000 Active 33 DOM
-
2026-06-08days on market $178,000 Active 32 DOM
-
2026-06-07days on market $178,000 Active 31 DOM
-
2026-06-03days on market $178,000 Active 27 DOM
-
2026-06-02days on market $178,000 Active 26 DOM
-
2026-06-01days on market $178,000 Active 25 DOM
-
2026-05-31days on market $178,000 Active 24 DOM
-
2026-05-31days on market $178,000 Active 23 DOM
-
2026-05-06$182,500 Active 449-char remark
ⓘ Source: listings_history table (triggers on properties + properties_extension) + one-shot
backfill from property_details.listing_events for pre-trigger history.
Climate risk First Street
- Flood 1/10 Low FEMA zone X · 0% chance over 30 yrs
- Wildfire 6/10 Major
- Heat 8/10 Severe 6 d/yr ≥112°F today · 17 d/yr by 30 yrs out
- Wind 8/10 Severe 99% chance of damaging wind over 30 yrs
- Air quality 2/10 Low 0 unhealthy d/yr today · 1 by 30 yrs out
Nearby sold comps map
Loading sold comps map…
Walkable amenities ~0.75 mi
Loading nearby amenities…
Taxation est. · year 1
- Rental income
- $13,880
- − Mortgage interest
- −$9,971
- − Property taxes
- −$2,670
- − Insurance
- −$890
- − Repairs & maintenance
- −$1,110
- − Management
- −$1,110
- − Depreciation
- −$5,178
- Taxable loss
- −$7,050
- Est. tax savings @ 24.0%
- +$1,692
- After-tax cash flow
- $-2,104/yr
For passive investors: Depreciation is non-cash, so a rental often shows a tax loss while cash-flowing — sheltering income. Rental losses are passive: they offset passive income freely, and up to $25,000/yr can offset ordinary (W-2) income if you actively participate and your MAGI is under $100k (phasing out to $0 by $150k); unused losses carry forward. On sale, claimed depreciation is recaptured at up to 25%, and gains may owe capital-gains tax (a 1031 exchange can defer both). Figures are a year-1 estimate at your 24.0% rate — not tax advice; consult a CPA.
Schools (NCES district)
- District
- Mission CISD
- NCES district ID
- 4831040
- Math proficiency
- 15% ▼ -35.00%
- Reading proficiency
- 28% ▼ -15.00%
- Median HH income
- $32,855
- Composite
- 17.47/100
- National rank
- #9061
- State rank
- #775 of 826 in TX
Livability — Alton
- Score
- 58/100
- State rank
- #1230
- US rank
- #21479
Category grades
Schools grade is shown separately in the Schools card above.
Census & demographics
- Census place
- Alton, TX
- County
- Hidalgo County · 623,128 people
- City population
- 44,809
- Metro
- McAllen-Edinburg-Mission, TX
- Population (ZIP)
- 44,809
- Household income
- $55,000
- Rent vs Own
- Severe rent burden
- 855.0
Population outlook (Hidalgo County) Hauer SSP2
- Today (2025)
- 955,232 people
- By 2030
- 1,009,774 · +5.7%
- By 2040
- 1,120,332 · +17.3%
- By 2050
- 1,225,036 · +28.2%
- By 2075
- 1,439,189 · +50.7%
- By 2100
- 1,533,429 · +60.5%
Race, ethnicity, and origin ACS 2023
- Neighborhood character
- Predominantly Hispanic (96%)
- Race & ethnicity
- Hispanic / Latino 96% Two or more races 63% White 3%
- Hispanic origin (detail)
- Mexican 94%
- Foreign-born
- 28% · Canada
- Languages at home
- 12% English-only · Spanish 88%
Political lean MEDSL · Hidalgo
- 2024 margin
- Toss-up / Even · D 48.1% · R 51.0%
- 2008→2024 swing
- -41.6pp toward R · 2008: 38.7pp · 2024: -2.9pp
- All cycles
- 2024: R+2.9 2020: D+17.1 2016: D+40.5 2012: D+41.8 2008: D+38.7
Not yet ingested
- Civics
- —
Market trends
- HPI YoY
- ▲ 17.95%
- Current HPI
- 242.0711
- Rent YoY
- ▲ 2.45%
- Metro
- McAllen-Edinburg-Mission, TX
- State GDP YoY
- ▲ 3.95%
- F500 in state
- 110
Industry mix (Fortune 500 HQ in TX)
| Industry | F500 HQs | Revenue |
|---|---|---|
| Energy | 16 | $1,198B |
|
||
| Technology | 5 | $198B |
|
||
| Engineering / Construction | 4 | $72B |
|
||
| Energy Services | 3 | $60B |
|
||
| Utilities | 3 | $41B |
|
||
| Healthcare | 2 | $330B |
|
||
Price history
-2.5% since first listed2 events — show timeline
- 2026-05-28 Price Changed $178,000 MCALLENMLS
- 2026-05-06 Listed $182,500 MCALLENMLS
Cash-flow waterfall
monthlySold comps — $/sqft
last 12 mo · ≤1 miLoading sold comps…