 Fourplex
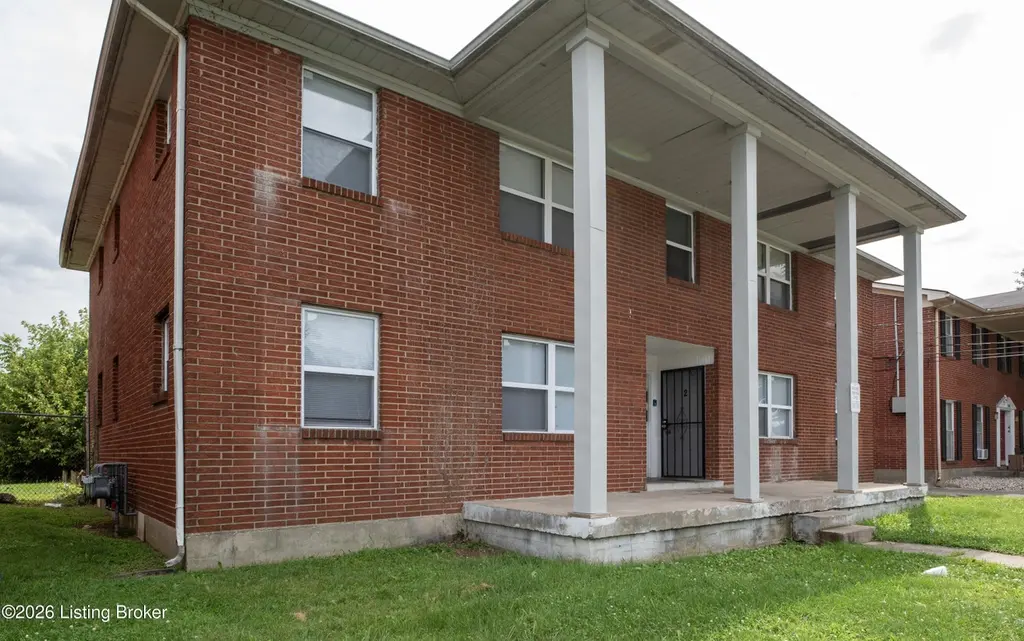
1704 Valley Forge Way · Louisville, KY
Flood risk 1/10 · Minimal
- FEMA flood zone
- X (unshaded)
- Chance of flooding over 30 yrs
- 0.0%
- Est. flood insurance / yr
- $507 – $1,088
Fire risk 1/10 · Minimal
- Est. fire insurance / yr
- $839 – $1,559
Heat risk 5/10 · Moderate
- Hot days now (above 104°F)
- 7 days/yr
- Hot days in 30 yrs
- 20 days/yr
Wind risk 2/10 · Minimal
- Chance of severe wind over 30 yrs
- 1.0%
Air-quality risk 2/10 · Minimal
- Unhealthy air days now
- 1 days/yr
- Unhealthy air days in 30 yrs
- 3 days/yr
Risk factors via First Street. Map © Google.
Why this score? — see what drove the B- grade
The composite is a weighted blend of 9 inputs, each scored 0–100. Each bar is that input's sub-score; the figure is the points it added to the 100-point composite (weight × sub-score).
- Cash flow +29.7/30.0
- DSCR +10.0/10.0
- 1% rule +7.9/10.0
- ARV discount +7.5/15.0
- Rent growth +3.8/5.0
- Livability +3.2/5.0
- Condition / age +2.5/5.0
- Schools +2.3/10.0
- Appreciation +0.0/10.0
$337,500
🖨 Deal sheet 📄 Offer letter ✓ Due diligence
Multi-family units
County records classify this as Multi-Family (5+ Unit). Listing-text estimate: 4 units. estimate disagrees with records
5+ unit building — per-unit beds/baths from public records are typically unavailable; the breakdown below (if shown) is an estimate from the listing text.
Listing remarks MLS
INVESTMENT OPPORTUNITY!!! 4-unit apartment building. Dedicated parking, well managed. Opportunity for higher rent revenue. Building is located close to Downtown and easy convenient access I 264. Contact listing agent with any questions.
Key facts
- 5 parking spots
- Built 1965
- Listed 60 days
Property features AI
Finance
- Other: Building area reported as 3,430 (source: other)
- Financial info: Designed as income-producing multifamily with separate meters (tenant pays electric and gas; owner pays water)
- HOA & community: No association fee
Exterior
- Parking: Five parking spaces; No covered parking
- Utilities: Electricity connected; Tenant pays electric and gas; Owner pays water
- Home design: Multifamily property with multiple units; Built in 1965; Other architectural style; Shingle roof; Brick construction; Entry level information not specified; Facing direction not specified
- Construction: Brick construction; Shingle roof; Year built: 1965; Foundation details not specified
- Exterior features: No additional exterior features listed; Sidewalk along the lot
Interior
- Kitchen: Each unit has a kitchen; Ranges present in each unit; Refrigerators present in each unit
- Bedrooms: Eight total bedrooms (four on the first level, four on the second level)
- Bathrooms: Four full bathrooms (two on the first level, two on the second level)
- Heating & cooling: Electric heating; Central air conditioning
- Interior features: Two residential units per floor (total of 4 units); Each unit includes a living room and kitchen; Separate meters for utilities
- Laundry & utility: Laundry facilities on both first and second levels (two laundry areas per level); Four furnaces
Neighborhood map
What this means for you Summary
Snapshot
- This is a 4 × 2-bed/1.0-bath units multifamily listed at $338k.
Deal economics
- At list price, monthly cash flow is $1k ($15k/yr) — positive. Per door: $307/mo.
- The deal already cash-flows at list — no discount required.
- Meets the 1% rule at list price ($4k rent vs $338k).
- Recommended offer: $327k (3.0% below list) — sets the bar for market timing.
- Cap rate 10.7% vs local median 5.0% in Louisville — top-decile yield for the area; either an underpriced asset or a hidden risk that comps aren't pricing in. Stress-test before assuming the spread holds.
Location & tenants
- Location reads 63/100 on livability (#333 in KY) — a middle-class / working-renter tenant base. Strengths: cost of living A+, housing A+; Watch: employment C-, health & safety D+, schools D-.
- Jefferson County (urban): math 19% / reading 35% proficiency, ranked #121 of 165 in KY (top 73%) — low school quality limits family demand, transient renter base, plan for 1-2y turnover.
- Market conditions: Rents rising fast (+5.2%/yr); 121 active listings in the ZIP; lower-income renter base — watch delinquency; 2,836 units permitted in Jefferson County in 2024 (1,558 in 5+ unit buildings).
- At $4,360/mo this rent would consume 120% of the median local household income ($44k/yr) (locally 997% of renters already pay >50% of income on rent) — very limited rent-growth headroom before tenants either downsize or default.
Forward outlook
- Local home prices are declining (-3.0%/yr); year-one equity from $2k of loan paydown is wiped out by about $10k of value loss. Plan a longer hold.
- Jefferson County population projected at +13% by 2050 — modest demand growth; plan on rents tracking national, not racing it.
- At projected returns (-3.0% appreciation + 5.2% rent growth), your $94k cash investment doubles in ~7 years — after that, you're playing with house money.
Negotiation context
- It's been on market 60 days — a 3% lower offer ($327k) is reasonable based on typical stale-listing flexibility.
- 5 sale attempts since 4y ago; this cycle's ask is 5% above the opening price — seller raised mid-cycle; expect resistance to lowballs.
- Current owner paid $293k; 15% above their basis — modest negotiation headroom, anchor on the comps not their cost.
Risks & watch-outs
- Climate carrying-cost: extreme-heat days projected 7→20/yr by 2055 (HVAC capex compounding) — expect insurance premiums to compound above CPI over the hold.
Questions for the listing agent
- It's been on market 60 days. Have you received any prior offers? Is the seller open to a 3% concession, seller financing, or rate buy-down credit?
- Can we see the unit-by-unit rent roll, current vacancy, and any below-market leases? What's the average tenancy length?
- What capital expenditures (roof, boiler, parking lot, exteriors) have been made in the last 5 years, and what's planned in the next 2?
- Built in 1965 — when were the roof, HVAC, electrical panel, plumbing, and water heater last replaced?
- Is there a deadline driving the sale (1031 exchange, divorce, estate, relocation)? That informs how much negotiation room exists.
- Schools are D-rated, which usually means shorter tenancies and higher turnover. Who's the typical renter profile here, and what's been the actual vacancy rate?
- Crime grade is F in this area — have there been break-ins, vandalism, or insurance claims at this property in the last 3 years? What carrier currently insures it and at what premium?
- What's the average days-on-market for RENTAL listings here right now (not sales)? A rising rental-DOM trend means longer vacancies and softer asking-rent achievability than the comps imply.
- What's the recent tenant-quality profile in this submarket — average credit score on applications, eviction rate, late-payment / NSF rate, and stable-employment percentage? A property-management company in the area should have these aggregated.
- How much new apartment / multifamily construction is in the pipeline within 1–3 miles? Heavy new supply (>2% of stock underway) typically softens rents 12–24 months out; light construction supports rent growth.
Investment metrics
- 1% rule
- 1.29% ✓
- Cap rate
- 10.65%
- Cash-on-cash
- 15.57%
- DSCR
- 1.69
- GRM
- 6.5
CMA / ARV
No comps found within radius.
Projected returns pro-forma
-3.0% appreciation · 5.16% rent growth · sell at horizon
- IRR
- 8.7%
- Equity multiple
- 1.35×
- Total profit
- $33,085
- Equity at exit
- $50,322
- IRR
- 19.6%
- Equity multiple
- 2.81×
- Total profit
- $170,874
- Equity at exit
- $29,181
Cash invested: $94,500 (down + closing). Projections, not guarantees.
Landlord ↔ Tenant lean methodology
- Overall (STATE)
- 83 Strongly Landlord-Friendly
- State Kentucky
- 83 Strongly Landlord-Friendly · R+16
- County
- — inherits STATE
- City
- — inherits STATE
ZIP-level market 40215
- Home prices YoY
- -34.4%
- Rents YoY
- 5.2%
- Active inventory
- 121
- Price-to-rent
- 25.8×
Monthly cashflow live
- Estimated rent
- $4,360 high interval (Pro) →
- Mortgage (P&I)
- −$1,770
- Tax from tax record
- −$308 /mo · $3,692/yr
- Insurance
- −$141
- HOA
- −$0
- Vacancy / Maint / Mgmt
- −$916
- Net cashflow
- $1,226
Break-even live
4-unit breakdown (identical units grouped — click to expand)
| Units | Beds | Baths | Est. rent |
|---|---|---|---|
| 4× units | 2 | 1 | $4,360 |
| #1 | 2 | 1 | $1,090 |
| #2 | 2 | 1 | $1,090 |
| #3 | 2 | 1 | $1,090 |
| #4 | 2 | 1 | $1,090 |
| Total (4 units) | $4,360 | ||
UW: 25.0% down · 7.5% · 30yr · 1.5% tax · 5.0% vac · 8.0% maint · 8.0% mgmt
Financing live
Cash to close
- Down payment
- $84,375
- Closing costs
- $10,125
- Reserves months
- —
- Total cash needed
- —
Loan-product check · same deal, 3 products live
Conventional
25% down · 7.5% · 30yr
- Down + closing
- —
- Monthly P&I
- —
- Monthly cashflow
- —
- DSCR
- —
- Eligible?
- —
Personal DTI + credit; lowest rate.
DSCR
20% down · 8.5% · 30yr
- Down + closing
- —
- Monthly P&I
- —
- Monthly cashflow
- —
- DSCR
- —
- Eligible?
- —
No personal income docs; deal must DSCR.
Hard money
10% down · 12.0% · 12mo
- Down + closing
- —
- Monthly P&I
- —
- Monthly cashflow
- —
- DSCR
- —
- Eligible?
- —
Short-term bridge; refi at stabilization.
Listing history 33 events
-
2026-06-18days on market $337,500 Active 60 DOM
-
2026-06-17days on market $337,500 Active 59 DOM
-
2026-06-16days on market $337,500 Active 58 DOM
-
2026-06-15days on market $337,500 Active 57 DOM
-
2026-06-13days on market $337,500 Active 55 DOM
-
2026-06-10days on market $337,500 Active 52 DOM
-
2026-06-09days on market $337,500 Active 51 DOM
-
2026-06-08days on market $337,500 Active 50 DOM
-
2026-06-07statusdays on market $337,500 Active 49 DOM
-
2026-06-03days on market $337,500 Active Under Contract 45 DOM
-
2026-06-02days on market $337,500 Active Under Contract 44 DOM
-
2026-06-01days on market $337,500 Active Under Contract 43 DOM
-
2026-05-31days on market $337,500 Active Under Contract 42 DOM
-
2026-04-26historical Active Under Contract
-
2026-04-26price $337,500
-
2026-04-19$320,000 Active
-
2024-05-16soldstatus $293,000
-
2024-05-13soldstatus $293,000 Closed 237-char remark
Show marketing remark (237 chars)
INVESTMENT OPPORTUNITY!!! 4-unit apartment building. Dedicated parking, well managed. Opportunity for higher rent revenue. Building is located close to Downtown and easy convenient access I 264. Contact listing agent with any questions.
-
2024-04-30historical Active Under Contract 237-char remark
Show marketing remark (237 chars)
INVESTMENT OPPORTUNITY!!! 4-unit apartment building. Dedicated parking, well managed. Opportunity for higher rent revenue. Building is located close to Downtown and easy convenient access I 264. Contact listing agent with any questions.
-
2024-03-29status Pending 237-char remark
Show marketing remark (237 chars)
INVESTMENT OPPORTUNITY!!! 4-unit apartment building. Dedicated parking, well managed. Opportunity for higher rent revenue. Building is located close to Downtown and easy convenient access I 264. Contact listing agent with any questions.
-
2024-03-27$300,000 Active 237-char remark
Show marketing remark (237 chars)
INVESTMENT OPPORTUNITY!!! 4-unit apartment building. Dedicated parking, well managed. Opportunity for higher rent revenue. Building is located close to Downtown and easy convenient access I 264. Contact listing agent with any questions.
-
2024-03-14historical $895
-
2024-01-07$895
-
2022-03-18soldstatus $300,000 Closed 225-char remark
Show marketing remark (225 chars)
Turn-key Fourplex off taylor blvd. The building was remodeled in 2018. Including new plumbing, Hvac units, Electrical panels, Cabinets, Flooring and roofing. $3,000 in monthly rent. All units are 2 bedroom 1 bath. Owner/agent
-
2022-03-14soldstatus $300,000
-
2022-02-05status Pending 225-char remark
Show marketing remark (225 chars)
Turn-key Fourplex off taylor blvd. The building was remodeled in 2018. Including new plumbing, Hvac units, Electrical panels, Cabinets, Flooring and roofing. $3,000 in monthly rent. All units are 2 bedroom 1 bath. Owner/agent
-
2022-02-04$300,000 Active 225-char remark
Show marketing remark (225 chars)
Turn-key Fourplex off taylor blvd. The building was remodeled in 2018. Including new plumbing, Hvac units, Electrical panels, Cabinets, Flooring and roofing. $3,000 in monthly rent. All units are 2 bedroom 1 bath. Owner/agent
-
2022-02-03historical
-
2022-02-03$300,000 Active
-
2018-07-20soldstatus $22,000
-
2018-03-09soldstatus $42,000
-
2006-12-29soldstatus $147,500
-
2004-11-18soldstatus $128,000
ⓘ Source: listings_history table (triggers on properties + properties_extension) + one-shot
backfill from property_details.listing_events for pre-trigger history.
Tax reassessment forecast KY · Resets to sale price
- Current annual tax
- $3,692 · $308/mo
- Projected year-2 tax
- $3,692 · $308/mo
- Expected delta
- $0/yr ($0/mo · 0.0%)
ⓘ Screening estimate from a state-policy table — verify with the county assessor before closing.
Climate risk First Street
- Flood 1/10 Low FEMA zone X (unshaded) · 0% chance over 30 yrs
- Wildfire 1/10 Low
- Heat 5/10 Major 7 d/yr ≥104°F today · 20 d/yr by 30 yrs out
- Wind 2/10 Low 100% chance of damaging wind over 30 yrs
- Air quality 2/10 Low 1 unhealthy d/yr today · 3 by 30 yrs out
Nearby sold comps map
Loading sold comps map…
Walkable amenities ~0.75 mi
Loading nearby amenities…
Taxation est. · year 1
- Rental income
- $52,320
- − Mortgage interest
- −$18,905
- − Property taxes
- −$3,692
- − Insurance
- −$1,688
- − Repairs & maintenance
- −$4,186
- − Management
- −$4,186
- − Depreciation
- −$9,818
- Taxable income
- $9,846
- Est. tax owed @ 24.0%
- −$2,363
- After-tax cash flow
- $12,352/yr
For passive investors: Depreciation is non-cash, so a rental often shows a tax loss while cash-flowing — sheltering income. Rental losses are passive: they offset passive income freely, and up to $25,000/yr can offset ordinary (W-2) income if you actively participate and your MAGI is under $100k (phasing out to $0 by $150k); unused losses carry forward. On sale, claimed depreciation is recaptured at up to 25%, and gains may owe capital-gains tax (a 1031 exchange can defer both). Figures are a year-1 estimate at your 24.0% rate — not tax advice; consult a CPA.
Schools (NCES district)
- District
- Jefferson County
- NCES district ID
- 2102990
- Math proficiency
- 19% ▼ -17.00%
- Reading proficiency
- 35% ▼ -11.00%
- Median HH income
- $47,885
- Composite
- 23.45/100
- National rank
- #7884
- State rank
- #121 of 165 in KY
Livability — Louisville
- Score
- 63/100
- State rank
- #333
- US rank
- #15887
Category grades
Schools grade is shown separately in the Schools card above.
Census & demographics
- Census place
- Louisville, KY
- County
- Jefferson County · 790,184 people
- City population
- 769,292
- Metro
- Louisville/Jefferson County, KY-IN
- Population (ZIP)
- 20,532
- Household income
- $43,725
- Rent vs Own
- Severe rent burden
- 997.0
Population outlook (Jefferson County) Hauer SSP2
- Today (2025)
- 823,112 people
- By 2030
- 849,343 · +3.2%
- By 2040
- 895,696 · +8.8%
- By 2050
- 933,630 · +13.4%
- By 2075
- 1,028,262 · +24.9%
- By 2100
- 1,072,675 · +30.3%
Race, ethnicity, and origin ACS 2023
- Neighborhood character
- Diverse neighborhood (Simpson 0.63)
- Race & ethnicity
- White 51% Black 33% Two or more races 11% Hispanic / Latino 6% Asian 2%
- Hispanic origin (detail)
- Mexican 2% Cuban 3%
- Common ancestry
- Slovak 1% Romanian 1% Serbian 1%
- Foreign-born
- 9% · Canada, Vietnam
- Languages at home
- 88% English-only · Spanish 5% Other Indo-European 2% Arabic 1%
Political lean MEDSL · Jefferson
- 2024 margin
- D (+16.6) · D 57.4% · R 40.9% · Other 1.7%
- 2008→2024 swing
- +4.5pp toward D · 2008: 12.0pp · 2024: 16.6pp
- All cycles
- 2024: D+16.6 2020: D+20.1 2016: D+13.3 2012: D+11.1 2008: D+12.0
Not yet ingested
- Civics
- —
Market trends
- HPI YoY
- ▼ -119.35%
- Current HPI
- 227.8248
- Rent YoY
- ▲ 5.16%
- Metro
- Louisville/Jefferson County, KY-IN
- State GDP YoY
- ▲ 1.81%
- F500 in state
- 4
Industry mix (Fortune 500 HQ in KY)
| Industry | F500 HQs | Revenue |
|---|---|---|
| Healthcare | 1 | $118B |
|
||
| Food / Beverage | 1 | $7B |
|
||
Price history
+163.7% since first listed20 events — show timeline
- 2026-04-26 Contingent — Metro Search MLS
- 2026-04-26 Price Changed $337,500 Metro Search MLS
- 2026-04-19 Listed $320,000 Metro Search MLS
- 2024-05-16 Sold (Public Records) $293,000 Public Records
- 2024-05-13 Sold (MLS) $293,000 Metro Search MLS
- 2024-04-30 Contingent — Metro Search MLS
- 2024-03-29 Pending — Metro Search MLS
- 2024-03-27 Listed $300,000 Metro Search MLS
- 2024-03-14 Rental Removed $895 APPFOLIO
- 2024-01-07 Listed for Rent $895 APPFOLIO
- 2022-03-18 Sold (MLS) $300,000 Metro Search MLS
- 2022-03-14 Sold (Public Records) $300,000 Public Records
- 2022-02-05 Pending — Metro Search MLS
- 2022-02-04 Listed $300,000 Metro Search MLS
- 2022-02-03 Listed $300,000 Metro Search MLS
- 2022-02-03 Listing Removed — Metro Search MLS
- 2018-07-20 Sold (Public Records) $22,000 Public Records
- 2018-03-09 Sold (Public Records) $42,000 Public Records
- 2006-12-29 Sold (Public Records) $147,500 Public Records
- 2004-11-18 Sold (Public Records) $128,000 Public Records
Property tax history
+0.6%/yrLatest (2025): $3,692 · -4.2% YoY. Source: county tax records.
Cash-flow waterfall
monthlySold comps — $/sqft
last 12 mo · ≤1 miLoading sold comps…