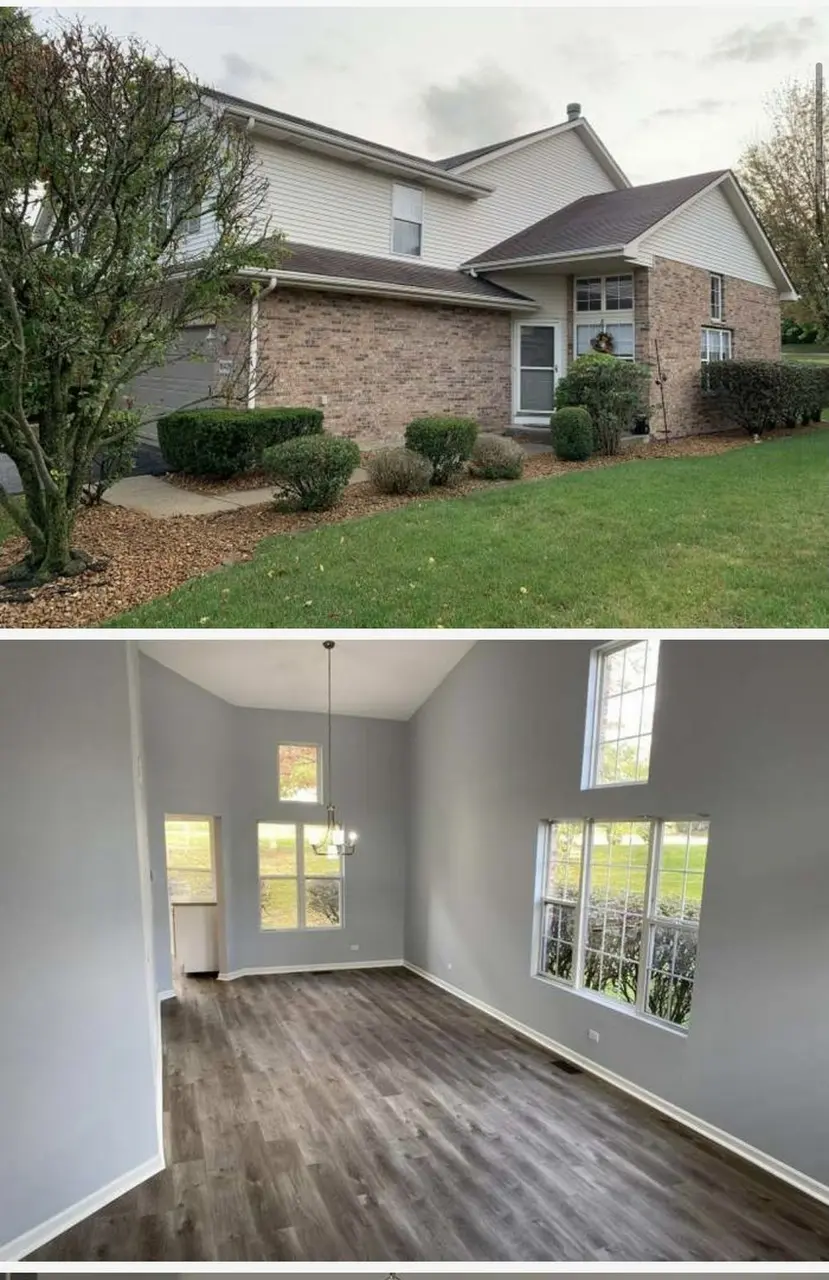
16426 Francis Ct · Orland Park, IL
Flood risk 1/10 · Minimal
- FEMA flood zone
- X (unshaded)
- Chance of flooding over 30 yrs
- 0.0%
- Est. flood insurance / yr
- $473 – $860
Fire risk 2/10 · Minimal
- Est. fire insurance / yr
- $804 – $1,492
Heat risk 3/10 · Minor
- Hot days now (above 102°F)
- 7 days/yr
- Hot days in 30 yrs
- 15 days/yr
Wind risk 2/10 · Minimal
- Chance of severe wind over 30 yrs
- 0.0%
Air-quality risk 2/10 · Minimal
- Unhealthy air days now
- 1 days/yr
- Unhealthy air days in 30 yrs
- 1 days/yr
Risk factors via First Street. Map © Google.
Why this score? — see what drove the D+ grade
The composite is a weighted blend of 9 inputs, each scored 0–100. Each bar is that input's sub-score; the figure is the points it added to the 100-point composite (weight × sub-score).
- Cash flow +17.2/30.0
- ARV discount +8.8/15.0
- DSCR +5.4/10.0
- 1% rule +4.6/10.0
- Livability +4.2/5.0
- Schools +3.4/10.0
- Rent growth +2.5/5.0
- Condition / age +2.5/5.0
- Appreciation +0.0/10.0
$379,900
🖨 Deal sheet (PDF) 📄 Offer letter ✓ Due diligence
Listing remarks MLS
Highest and Best due TUESDAY, Nov. 10 at 6pm. HUGE Price Improvement. Absolute best value at this pricepoint. MUST SEE. Located in the Alpine Heights Subdivision, this unit has So. Much. Space. Gorgeous four bedroom (two up and two down), 2.1 bathroom home with THREE separate family spaces. Completely move-in ready with brand new flooring throughout; beautiful waterproof vinyl on the main level and plush, nuetral carpeting in the bedrooms and basement. You step into the foyer of this home and immediately notice the grand cathedral ceiling and large windows in the living room and dining room. The adjacent kitchen is full of natural light and large enough for a table. The kitchen flows nicely into the main level family room complete with a fireplace AND glass door access leading to a patio perfect for grilling out or sitting around a firepit. The second level offers a generous master bedroom with walk-in closet and full en suite with separate soaker tub, a large second bedroom PLUS A LOFT SPACE that could easily be converted into an additional bedroom. Yet more space can be found in the finished basement. Two additional bedrooms that share a HUGE closet, an open recreational space with endless possibilities and storage in the utility room complete the lower level. All this with an attached 2-car garage AND main level laundry. Electrical has been upgraded and the entire home freshly painted in a neutral pallet. All appliances stay except the freezer in the garage and the grill on the patio.
Key facts
- Large windows
- Waterproof vinyl
- Natural light
Tags
Property features AI
Exterior
- Home design: Townhouse
- Exterior features: Lot approximately 2,625 sq ft
Neighborhood map
What this means for you Summary
Snapshot
- This is a 2-bed/1.5-bath townhouse listed at $380k.
Deal economics
- At list price, monthly cash flow is $271 ($3k/yr) — positive.
- The deal already cash-flows at list — no discount required.
- To meet the 1% rule (rent ≥ 1% of price), the offer needs to be $366k (3.6% below list).
- Recommended offer: $366k (3.6% below list) — sets the bar for 1% rule.
- Cap rate 7.1% vs local median 4.3% in Orland Park — top-decile yield for the area; either an underpriced asset or a hidden risk that comps aren't pricing in. Stress-test before assuming the spread holds.
Location & tenants
- Location reads 85/100 on livability (#29 in IL, #529 nationally) — a professional / high-income tenant draw. Strengths: crime A+, amenities A+, commute A+.
- Cons Hsd 230 (suburban): math 35% / reading 39% proficiency, ranked #146 of 620 in IL (top 24%) — families likely to look elsewhere, expect single-tenant / working-renter base with shorter leases.
- Market conditions: 118 active listings in the ZIP; 5 comparable units currently listed for rent nearby; rentals at typical pace (median 16d on market — plan ~3-4 weeks tenant-placement turnaround); 6,272 units permitted in Cook County in 2024 (4,658 in 5+ unit buildings).
Forward outlook
- Local home prices are declining (-3.0%/yr); year-one equity from $3k of loan paydown is wiped out by about $11k of value loss. Plan a longer hold.
Negotiation context
- It's been on market 17 days — a 2% lower offer ($374k) is reasonable based on typical stale-listing flexibility.
- 3 sale attempts since 13y ago with the ask held roughly flat each time — persistent listings suggest the price (not the market) is what's stuck; bring a comps-based counter.
- Current owner paid $261k; 46% above their basis — modest negotiation headroom, anchor on the comps not their cost.
Questions for the listing agent
- Is there a deadline driving the sale (1031 exchange, divorce, estate, relocation)? That informs how much negotiation room exists.
- The area grade is low — what's the realistic commute time and amenity access for the typical tenant pool here? Any planned neighborhood developments (good or bad) we should know about?
- What's the average days-on-market for RENTAL listings here right now (not sales)? A rising rental-DOM trend means longer vacancies and softer asking-rent achievability than the comps imply.
- What's the recent tenant-quality profile in this submarket — average credit score on applications, eviction rate, late-payment / NSF rate, and stable-employment percentage? A property-management company in the area should have these aggregated.
- How much new for-sale + rental construction is in the pipeline within 1–3 miles? Heavy new supply typically softens prices + rents 12–24 months out; constrained supply supports both.
Investment metrics
- 1% rule
- 0.96% ✗
- Cap rate
- 7.15%
- Cash-on-cash
- 3.06%
- DSCR
- 1.14
- GRM
- 8.6
CMA / ARV
- ARV (on-the-fly)
- $391,347
- Comps found
- 10
Show comp detail 10 sales within ~0.75 mi
| Address | Dist | Beds/Ba | Sqft | Sold | Price | $/sf | Match |
|---|---|---|---|---|---|---|---|
| 11130 Alpine Ln | 0.07mi | 2/2.5 | 1,866 (-4%) | 11mo | $489,999 | $263 | 76 |
| 16521 Timber Trl | 0.13mi | 2/2.5 | 2,000 (+3%) | 14mo | $409,000 | $205 | 73 |
| 16516 Timber Trl | 0.11mi | 3/3.5 (+1) | 1,988 (+2%) | 9mo | $430,000 | $216 | 71 |
| 16620 Grants Trl | 0.48mi | 2/2.5 | 1,850 (-5%) | 7mo | $331,000 | $179 | 59 |
| 16533 Timber Trl | 0.16mi | 3/3.5 (+1) | 1,988 (+2%) | 23mo | $400,000 | $201 | 57 |
| 11104 Karen Dr | 0.27mi | 2/2.0 | 1,717 (-12%) | 11mo | $355,000 | $207 | 56 |
| 16513 Timber Trl | 0.10mi | 3/2.5 (+1) | 2,147 (+10%) | 18mo | $400,000 | $186 | 54 |
| 16717 Summercrest Ave | 0.47mi | 2/2.5 | 1,762 (-10%) | 13mo | $347,000 | $197 | 47 |
| 16629 Grants Trl | 0.51mi | 3/2.5 (+1) | 1,762 (-10%) | 7mo | $319,900 | $182 | 45 |
| 16625 Grants Trl | 0.51mi | 3/2.5 (+1) | 1,762 (-10%) | 20mo | $329,900 | $187 | 34 |
Match score weights: distance 35% · size 25% · config 20% · recency 20%. Top-matched comps best support the ARV.
Projected returns pro-forma
-3.0% appreciation · 3.0% rent growth · sell at horizon
- IRR
- -11.5%
- Equity multiple
- 0.58×
- Total profit
- $-44,240
- Equity at exit
- $56,644
- IRR
- -2.2%
- Equity multiple
- 0.85×
- Total profit
- $-16,072
- Equity at exit
- $32,847
Cash invested: $106,372 (down + closing). Projections, not guarantees.
Landlord ↔ Tenant lean methodology
- Overall (STATE)
- 43 Moderately Tenant-Leaning
- State Illinois
- 43 Moderately Tenant-Leaning · D+7
- County
- — inherits STATE
- City
- — inherits STATE
ZIP-level market 60467
- Home prices YoY
- -30.4%
- Active inventory
- 118
- Price-to-rent
- 8.6×
Monthly cashflow live
- Estimated rent
- $3,663 high interval (Pro) →
- Mortgage (P&I)
- −$1,992
- Tax from tax record
- −$472 /mo · $5,664/yr
- Insurance
- −$158
- HOA
- −$0
- Vacancy / Maint / Mgmt
- −$769
- Net cashflow
- $271
Break-even live
Sensitivity live
| Price | -10% $486 | -5% $379 | +0% $271 | +5% $164 | +10% $56 |
|---|---|---|---|---|---|
| Rent | -10% $-18 | -5% $126 | +0% $271 | +5% $416 | +10% $560 |
| Rate | -1.0pp $462 | -0.5pp $368 | base $271 | +0.5pp $173 | +1.0pp $73 |
UW: 25.0% down · 7.5% · 30yr · 1.5% tax · 5.0% vac · 8.0% maint · 8.0% mgmt
Financing live
Cash to close
- Down payment
- $94,975
- Closing costs
- $11,397
- Reserves months
- —
- Total cash needed
- —
Loan-product check · same deal, 3 products live
Conventional
25% down · 7.5% · 30yr
- Down + closing
- —
- Monthly P&I
- —
- Monthly cashflow
- —
- DSCR
- —
- Eligible?
- —
Personal DTI + credit; lowest rate.
DSCR
20% down · 8.5% · 30yr
- Down + closing
- —
- Monthly P&I
- —
- Monthly cashflow
- —
- DSCR
- —
- Eligible?
- —
No personal income docs; deal must DSCR.
Hard money
10% down · 12.0% · 12mo
- Down + closing
- —
- Monthly P&I
- —
- Monthly cashflow
- —
- DSCR
- —
- Eligible?
- —
Short-term bridge; refi at stabilization.
Rent comps 5 comps
| Address | Beds | Baths | Sqft | Rent | $/sqft | DOM | Units | Dist |
|---|---|---|---|---|---|---|---|---|
| 16527 Orange Ave Orland Park, IL | 3.0 | 3.5 | 1870 | $3,800 | $2.03 | 4d | 1 | 0.17mi |
| 10652 Dani Ln Orland Park, IL | 3.0 | 2.5 | 2010 | $2,950 | $1.47 | 16d | 1 | 1.14mi |
| 10616 Alice Mae Ct Orland Park, IL | 3.0 | 3.5 | 2200 | $3,708 | $1.69 | 25d | 1 | 1.30mi |
| 10600 Alice Mae Ct Unit 10604 Orland Park, IL | 3.0 | 3.5 | 2200 | $3,300 | $1.50 | 0d | 1 | 1.31mi |
| 10608 Alice Mae Ct Orland Park, IL | 3.0 | 3.5 | 2200 | $3,708 | $1.69 | 25d | 1 | 1.32mi |
Listing history 11 events
-
2026-06-21days on market $379,900 Active 17 DOM
-
2026-06-18days on market $379,900 Active 14 DOM
-
2026-06-17days on market $379,900 Active 13 DOM
-
2026-06-16days on market $379,900 Active 12 DOM
-
2026-06-15days on market $379,900 Active 11 DOM
-
2026-06-13days on market $379,900 Active 9 DOM
-
2026-06-09days on market $379,900 Active 5 DOM
-
2026-06-08days on market $379,900 Active 4 DOM
-
2026-06-07days on market $379,900 Active 3 DOM
-
2026-06-04remarks 699-char remark
-
2026-06-04$379,900 Active 1 DOM
ⓘ Source: listings_history table (triggers on properties + properties_extension) + one-shot
backfill from property_details.listing_events for pre-trigger history.
Tax reassessment forecast IL · Partial reset (capped growth)
- Current annual tax
- $5,664 · $472/mo
- Projected year-2 tax
- $7,144 · $595/mo
- Expected delta
- +$1,480/yr (+$123/mo · 26.1%)
ⓘ Screening estimate from a state-policy table — verify with the county assessor before closing.
Climate risk First Street
- Flood 1/10 Low FEMA zone X (unshaded) · 0% chance over 30 yrs
- Wildfire 2/10 Low
- Heat 3/10 Moderate 7 d/yr ≥102°F today · 15 d/yr by 30 yrs out
- Wind 2/10 Low 0% chance of damaging wind over 30 yrs
- Air quality 2/10 Low 1 unhealthy d/yr today · 1 by 30 yrs out
Nearby sold comps map
Loading sold comps map…
Walkable amenities ~0.75 mi
Loading nearby amenities…
Taxation est. · year 1
- Rental income
- $43,954
- − Mortgage interest
- −$21,280
- − Property taxes
- −$5,664
- − Insurance
- −$1,900
- − Repairs & maintenance
- −$3,516
- − Management
- −$3,516
- − Depreciation
- −$11,052
- Taxable loss
- −$2,974
- Est. tax savings @ 24.0%
- +$714
- After-tax cash flow
- $3,967/yr
For passive investors: Depreciation is non-cash, so a rental often shows a tax loss while cash-flowing — sheltering income. Rental losses are passive: they offset passive income freely, and up to $25,000/yr can offset ordinary (W-2) income if you actively participate and your MAGI is under $100k (phasing out to $0 by $150k); unused losses carry forward. On sale, claimed depreciation is recaptured at up to 25%, and gains may owe capital-gains tax (a 1031 exchange can defer both). Figures are a year-1 estimate at your 24.0% rate — not tax advice; consult a CPA.
Schools (NCES district)
- District
- Cons Hsd 230
- NCES district ID
- 1708400
- Math proficiency
- 35% ▼ -8.00%
- Reading proficiency
- 39% ▼ -6.00%
- Median HH income
- $73,953
- Composite
- 34.29/100
- National rank
- #5244
- State rank
- #146 of 620 in IL
Livability — Orland Park
- Score
- 85/100
- State rank
- #29
- US rank
- #529
Category grades
Schools grade is shown separately in the Schools card above.
Census & demographics
- City population
- 22,585
- Population (ZIP)
- 24,952
Population outlook (Cook County) Hauer SSP2
- Today (2025)
- 5,347,519 people
- By 2030
- 5,357,703 · +0.2%
- By 2040
- 5,324,924 · -0.4%
- By 2050
- 5,230,762 · -2.2%
- By 2075
- 4,785,735 · -10.5%
- By 2100
- 4,188,836 · -21.7%
Race, ethnicity, and origin ACS 2023
- Neighborhood character
- Predominantly White (83%)
- Race & ethnicity
- White 83% Hispanic / Latino 6% Asian 5% Two or more races 4% Black 4%
- Hispanic origin (detail)
- Mexican 5%
- Common ancestry
- Romanian 15% Armenian 2% Iranian 2%
- Foreign-born
- 14% · Canada, South Korea, China
- Languages at home
- 78% English-only · Arabic 9% Russian/Polish/Slavic 4% Other Indo-European 4%
Political lean MEDSL · Cook
- 2024 margin
- Solid D (+42.0) · D 70.4% · R 28.4% · Other 1.2%
- 2008→2024 swing
- -11.4pp toward R · 2008: 53.4pp · 2024: 42.0pp
- All cycles
- 2024: D+42.0 2020: D+50.3 2016: D+53.0 2012: D+49.4 2008: D+53.4
Not yet ingested
- Civics
- —
Market trends
- HPI YoY
- ▼ -82.13%
- Current HPI
- 188.3676
- Rent YoY
- —
- Metro
- —
- State GDP YoY
- ▲ 1.59%
- F500 in state
- 60
Industry mix (Fortune 500 HQ in IL)
| Industry | F500 HQs | Revenue |
|---|---|---|
| Insurance | 4 | $201B |
|
||
| Consumer Goods | 4 | $87B |
|
||
| Industrial Machinery | 3 | $64B |
|
||
| Healthcare | 2 | $55B |
|
||
| Retail / Pharmacy | 1 | $148B |
|
||
| Agriculture / Food | 1 | $86B |
|
||
Price history
+93.8% since first listed12 events — show timeline
- 2026-06-04 Listed $379,900 ForSaleByOwner.com
- 2021-04-06 Sold (Public Records) $261,000 Public Records
- 2020-12-22 Sold (MLS) $261,000 MRED as Distributed by MLS Grid
- 2020-11-11 Pending — MRED as Distributed by MLS Grid
- 2020-11-08 Price Changed $259,900 MRED as Distributed by MLS Grid
- 2020-10-18 Price Changed $269,900 MRED as Distributed by MLS Grid
- 2020-10-04 Listed $279,900 MRED as Distributed by MLS Grid
- 2013-09-30 Sold (MLS) $186,000 MRED as Distributed by MLS Grid
- 2013-08-17 Contingent — MRED as Distributed by MLS Grid
- 2013-08-07 Price Changed $196,500 MRED as Distributed by MLS Grid
- 2013-06-15 Listed $199,900 MRED as Distributed by MLS Grid
- 2002-06-19 Sold (Public Records) $196,000 Public Records
Property tax history
+1.3%/yrLatest (2023): $5,664 · -3.3% YoY. Source: county tax records.
Cash-flow waterfall
monthlySold comps — $/sqft
last 12 mo · ≤1 miLoading sold comps…