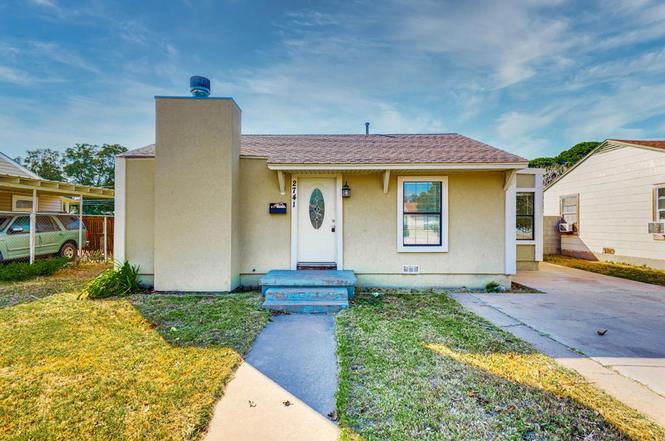
2741 Adams Ave · Odessa, TX
Flood risk 7/10 · Major
- FEMA flood zone
- AE
- Chance of flooding over 30 yrs
- 0.97%
- Est. flood insurance / yr
- $1,737 – $8,500
Fire risk 2/10 · Minimal
- Est. fire insurance / yr
- $1,222 – $2,270
Heat risk 5/10 · Moderate
- Hot days now (above 101°F)
- 7 days/yr
- Hot days in 30 yrs
- 20 days/yr
Wind risk 2/10 · Minimal
- Chance of severe wind over 30 yrs
- 3.0%
Air-quality risk 1/10 · Minimal
- Unhealthy air days now
- 0 days/yr
- Unhealthy air days in 30 yrs
- 0 days/yr
Risk factors via First Street. Map © Google.
Why this score? — see what drove the C grade
The composite is a weighted blend of 9 inputs, each scored 0–100. Each bar is that input's sub-score; the figure is the points it added to the 100-point composite (weight × sub-score).
- Cash flow +24.3/30.0
- DSCR +7.8/10.0
- ARV discount +7.5/15.0
- 1% rule +5.6/10.0
- Livability +3.8/5.0
- Rent growth +2.8/5.0
- Condition / age +2.5/5.0
- Schools +2.2/10.0
- Appreciation +0.0/10.0
$199,900
🖨 Deal sheet (PDF) 📄 Offer letter ✓ Due diligence
Listing remarks MLS
Wanting a large home in a quiet neighborhood? Then this one is for you! This extremely large 4 bed/ 3 bath home is updated with new tile and fresh paint ! This home can also be Rented or owner will finance with 6.2% down. Call Today!
Key facts
- 6,360 sq ft lot
- Built 1950
- Listed 245 days
Property features AI
Exterior
- Utilities: Public water
- Home design: Single-family residence; 1 story
- Construction: Stucco construction; Composition roof
- Exterior features: Wood fencing; Workshop on the property
Interior
- Flooring: Tile flooring
- Bathrooms: 3 full bathrooms
- Heating & cooling: Central heating (electric); Central air conditioning; Ceiling fan(s)
- Interior features: Living room fireplace; Electric water heater
Neighborhood map
What this means for you Summary
Snapshot
- This is a 4-bed/3.0-bath single-family listed at $200k.
Deal economics
- At list price, monthly cash flow is $-23 ($-279/yr) — negative.
- To cash-flow at today's rent, offer at most $196k (2.1% below list).
- Meets the 1% rule at list price ($2k rent vs $200k).
- Recommended offer: $176k (12.0% below list) — sets the bar for market timing.
Location & tenants
- Location reads 75/100 on livability (#132 in TX, #3,928 nationally) — a middle-class / working-renter tenant base. Strengths: cost of living A+, housing A+, health & safety A+; Watch: commute D+, amenities D.
- Ector County ISD (urban): math 22% / reading 27% proficiency, ranked #707 of 826 in TX (top 86%) — low school quality limits family demand, transient renter base, plan for 1-2y turnover.
- Zoned schools: Sam Houston El (math 27% / reading 22%, grade F, #3,052 of 4,322 statewide, top 74%, 392 students, 90% FRL); Bowie Middle (math 11% / reading 21%, grade F, #1,543 of 1,662 statewide, top 94%, 914 students, 74% FRL); Permian H S (math 19% / reading 29%, grade F, #1,333 of 1,632 statewide, top 82%, 3,978 students, 51% FRL) — zoned schools average 71% FRL vs 56% district-wide (15 pts higher); higher-poverty schools than district average — tighter screening recommended.
- Market conditions: Rents rising (+1.4%/yr); 267 active listings in the ZIP; 17 comparable units currently listed for rent nearby; rentals at typical pace (median 22d on market — plan ~3-4 weeks tenant-placement turnaround); solid renter incomes; 1,004 units permitted in Ector County in 2024 (0 in 5+ unit buildings).
- This rent runs 34% of the median local income ($75k/yr) — at the standard rent-burdened threshold; future hikes will face affordability resistance.
Forward outlook
- Local home prices are declining (-3.0%/yr); year-one equity from $1k of loan paydown is wiped out by about $6k of value loss. Plan a longer hold.
- Ector County population projected at +78% by 2050 — long-run rental-demand tailwind backs the buy-and-hold thesis.
Negotiation context
- It's been on market 245 days — a 12% lower offer ($176k) is reasonable based on typical stale-listing flexibility.
- 5 sale attempts since 23y ago; this cycle's ask is 6793% above the opening price — seller raised mid-cycle; expect resistance to lowballs.
Risks & watch-outs
- Watch-outs: flood insurance adds $427/mo; built in 1950 — expect roof / HVAC / electrical / plumbing capex.
- Climate carrying-cost: in FEMA flood zone AE (mandatory federal flood insurance); extreme-heat days projected 7→20/yr by 2055 (HVAC capex compounding) — expect insurance premiums to compound above CPI over the hold.
Questions for the listing agent
- What do current leases actually rent for vs. the listed asking? Can we see a recent rent roll and the last 12 months of T-12 income?
- It's been on market 245 days. Have you received any prior offers? Is the seller open to a 12% concession, seller financing, or rate buy-down credit?
- Built in 1950 — when were the roof, HVAC, electrical panel, plumbing, and water heater last replaced?
- What's the actual annual flood-insurance premium (NFIP or private), and is the property in a SFHA with mandatory coverage?
- Why hasn't it sold? Are there any deal-killer items the seller is aware of (foundation, flood, title, zoning, code violations)?
- Is there a deadline driving the sale (1031 exchange, divorce, estate, relocation)? That informs how much negotiation room exists.
- Schools are F-rated, which usually means shorter tenancies and higher turnover. Who's the typical renter profile here, and what's been the actual vacancy rate?
- What's the average days-on-market for RENTAL listings here right now (not sales)? A rising rental-DOM trend means longer vacancies and softer asking-rent achievability than the comps imply.
- What's the recent tenant-quality profile in this submarket — average credit score on applications, eviction rate, late-payment / NSF rate, and stable-employment percentage? A property-management company in the area should have these aggregated.
- How much new for-sale + rental construction is in the pipeline within 1–3 miles? Heavy new supply typically softens prices + rents 12–24 months out; constrained supply supports both.
Investment metrics
- 1% rule
- 1.06% ✓
- Cap rate
- 8.71%
- Cash-on-cash
- 8.65%
- DSCR
- 1.38
- GRM
- 7.9
CMA / ARV
No comps found within radius.
Projected returns pro-forma
-3.0% appreciation · 1.36% rent growth · sell at horizon
- IRR
- -19.3%
- Equity multiple
- 0.34×
- Total profit
- $-37,079
- Equity at exit
- $29,806
- IRR
- -16.4%
- Equity multiple
- 0.16×
- Total profit
- $-46,901
- Equity at exit
- $17,284
Cash invested: $55,972 (down + closing). Projections, not guarantees.
Landlord ↔ Tenant lean methodology
- Overall (STATE)
- 87 Strongly Landlord-Friendly
- State Texas
- 87 Strongly Landlord-Friendly · R+5
- County
- — inherits STATE
- City
- — inherits STATE
ZIP-level market 79762
- Rents YoY
- 1.4%
- Active inventory
- 267
- Price-to-rent
- 7.9×
Monthly cashflow live
- Estimated rent
- $2,111 high interval (Pro) →
- Mortgage (P&I)
- −$1,048
- Tax from tax record
- −$133 /mo · $1,596/yr
- Insurance
- −$83
- Flood insurance flood zone
- −$427 /mo · $5,118/yr
- HOA
- −$0
- Vacancy / Maint / Mgmt
- −$443
- Net cashflow
- $-23
Break-even live
Sensitivity live
| Price | -10% $90 | -5% $33 | +0% $-23 | +5% $-80 | +10% $-136 |
|---|---|---|---|---|---|
| Rent | -10% $-190 | -5% $-107 | +0% $-23 | +5% $60 | +10% $144 |
| Rate | -1.0pp $77 | -0.5pp $28 | base $-23 | +0.5pp $-75 | +1.0pp $-128 |
UW: 25.0% down · 7.5% · 30yr · 1.5% tax · 5.0% vac · 8.0% maint · 8.0% mgmt
Financing live
Cash to close
- Down payment
- $49,975
- Closing costs
- $5,997
- Reserves months
- —
- Total cash needed
- —
Loan-product check · same deal, 3 products live
Conventional
25% down · 7.5% · 30yr
- Down + closing
- —
- Monthly P&I
- —
- Monthly cashflow
- —
- DSCR
- —
- Eligible?
- —
Personal DTI + credit; lowest rate.
DSCR
20% down · 8.5% · 30yr
- Down + closing
- —
- Monthly P&I
- —
- Monthly cashflow
- —
- DSCR
- —
- Eligible?
- —
No personal income docs; deal must DSCR.
Hard money
10% down · 12.0% · 12mo
- Down + closing
- —
- Monthly P&I
- —
- Monthly cashflow
- —
- DSCR
- —
- Eligible?
- —
Short-term bridge; refi at stabilization.
Rent comps 17 comps
| Address | Beds | Baths | Sqft | Rent | $/sqft | DOM | Units | Dist |
|---|---|---|---|---|---|---|---|---|
| 2702 S Colonial Dr Odessa, TX | 3.0 | 1.0 | 1490 | $1,500 | $1.01 | 14d | 1 | 0.55mi |
| 1212 E Century Ave Odessa, TX | 3.0 | 1.0 | 1359 | $1,300 | $0.96 | 22d | 1 | 0.56mi |
| 3624 Walnut Ave Odessa, TX | 3.0 | 1.0 | 1488 | $1,950 | $1.31 | 44d | 1 | 0.62mi |
| 237 Orchard Dr Odessa, TX | 4.0 | 2.0 | 1768 | $2,000 | $1.13 | 14d | 1 | 0.64mi |
| 1401 E 18th St Odessa, TX | 3.0 | 2.0 | 1690 | $2,000 | $1.18 | 14d | 1 | 0.78mi |
| 2826 Hilltop Dr Odessa, TX | 4.0 | 2.0 | 1307 | $2,000 | $1.53 | 14d | 1 | 0.82mi |
| 3009 N Century Ave Odessa, TX | 3.0 | 2.0 | 1909 | $2,600 | $1.36 | 44d | 1 | 0.95mi |
| 1308 Alpine St Odessa, TX | 3.0 | 2.0 | 1800 | $2,195 | $1.22 | 14d | 1 | 0.97mi |
| 2901 Nabors Ln Odessa, TX | 3.0 | 1.0 | 1374 | $1,800 | $1.31 | 22d | 1 | 1.05mi |
| 2901 Nabors Ln Odessa, TX | 3.0 | 1.0 | 1508 | $1,800 | $1.19 | 14d | 1 | 1.05mi |
| 4207 Dakota Ave Odessa, TX | 3.0 | 2.0 | 1904 | $2,300 | $1.21 | 44d | 1 | 1.21mi |
| 2905 Byron Ave Odessa, TX | 3.0 | 2.0 | 1816 | $2,400 | $1.32 | 14d | 1 | 1.23mi |
| 1513 E 11th St Odessa, TX | 3.0 | 2.0 | 1728 | $3,300 | $1.91 | 44d | 1 | 1.26mi |
| 1506 N Alleghaney Ave Odessa, TX | 4.0 | 2.0 | 2400 | $2,650 | $1.10 | 22d | 1 | 1.29mi |
| 1706 Emerald Ave Odessa, TX | 3.0 | 2.0 | 1992 | $2,500 | $1.26 | 44d | 1 | 1.35mi |
| 1709 Byron Ave Odessa, TX | 3.0 | 2.0 | 1981 | $1,975 | $1.00 | 44d | 1 | 1.37mi |
| 2801 Redbud Ave Odessa, TX | 3.0 | 2.0 | 1558 | $1,800 | $1.16 | 14d | 1 | 1.43mi |
Listing history 22 events
-
2026-04-30status Pending
-
2026-04-22historical $2,900
-
2026-04-17historical Active Under Contract
-
2026-03-23status Active
-
2026-03-09historical Active Under Contract
-
2026-02-11price $199,900
-
2026-02-11price $199,900
-
2026-01-08price $205,000
-
2026-01-08price $205,000
-
2025-12-19$2,900
-
2025-11-19price $215,000
-
2025-11-19price $215,000
-
2025-09-16price $220,000
-
2025-09-15price $220,000
-
2025-08-28$225,000 Active
-
2017-06-22historical 233-char remark
Show marketing remark (233 chars)
Wanting a large home in a quiet neighborhood? Then this one is for you! This extremely large 4 bed/ 3 bath home is updated with new tile and fresh paint ! This home can also be Rented or owner will finance with 6.2% down. Call Today!
-
2016-08-25$160,000 233-char remark
Show marketing remark (233 chars)
Wanting a large home in a quiet neighborhood? Then this one is for you! This extremely large 4 bed/ 3 bath home is updated with new tile and fresh paint ! This home can also be Rented or owner will finance with 6.2% down. Call Today!
-
2006-09-08soldstatus
-
2005-10-04soldstatus
-
2003-05-23soldstatus
-
2003-05-05soldstatus
-
2003-03-10$11,200
ⓘ Source: listings_history table (triggers on properties + properties_extension) + one-shot
backfill from property_details.listing_events for pre-trigger history.
Tax reassessment forecast TX · Resets to sale price
- Current annual tax
- $1,596 · $133/mo
- Projected year-2 tax
- $3,658 · $305/mo
- Expected delta
- +$2,062/yr (+$172/mo · 129.2%)
ⓘ Screening estimate from a state-policy table — verify with the county assessor before closing.
Climate risk First Street
- Flood 7/10 Severe FEMA zone AE · 97% chance over 30 yrs
- Wildfire 2/10 Low
- Heat 5/10 Major 7 d/yr ≥101°F today · 20 d/yr by 30 yrs out
- Wind 2/10 Low 3% chance of damaging wind over 30 yrs
- Air quality 1/10 Low 0 unhealthy d/yr today · 0 by 30 yrs out
Nearby sold comps map
Loading sold comps map…
Walkable amenities ~0.75 mi
Loading nearby amenities…
Taxation est. · year 1
- Rental income
- $25,335
- − Mortgage interest
- −$11,198
- − Property taxes
- −$1,596
- − Insurance
- −$6,118
- − Repairs & maintenance
- −$2,027
- − Management
- −$2,027
- − Depreciation
- −$5,815
- Taxable loss
- −$3,445
- Est. tax savings @ 24.0%
- +$827
- After-tax cash flow
- $548/yr
For passive investors: Depreciation is non-cash, so a rental often shows a tax loss while cash-flowing — sheltering income. Rental losses are passive: they offset passive income freely, and up to $25,000/yr can offset ordinary (W-2) income if you actively participate and your MAGI is under $100k (phasing out to $0 by $150k); unused losses carry forward. On sale, claimed depreciation is recaptured at up to 25%, and gains may owe capital-gains tax (a 1031 exchange can defer both). Figures are a year-1 estimate at your 24.0% rate — not tax advice; consult a CPA.
Schools (NCES district)
- District
- Ector County ISD
- NCES district ID
- 4818000
- Math proficiency
- 22% ▼ -9.00%
- Reading proficiency
- 27% ▼ -4.00%
- Median HH income
- $52,740
- Composite
- 21.89/100
- National rank
- #8233
- State rank
- #707 of 826 in TX
Livability — Odessa
- Score
- 75/100
- State rank
- #132
- US rank
- #3928
Category grades
Schools grade is shown separately in the Schools card above.
Census & demographics
- Census place
- Odessa, TX
- County
- Ector County · 131,169 people
- City population
- 131,169
- Metro
- Odessa, TX
- Population (ZIP)
- 39,927
- Household income
- $75,272
- Rent vs Own
- Severe rent burden
- 1477.0
Population outlook (Ector County) Hauer SSP2
- Today (2025)
- 212,765 people
- By 2030
- 241,962 · +13.7%
- By 2040
- 306,582 · +44.1%
- By 2050
- 379,755 · +78.5%
- By 2075
- 568,991 · +167.4%
- By 2100
- 709,829 · +233.6%
Race, ethnicity, and origin ACS 2023
- Neighborhood character
- Diverse neighborhood (Simpson 0.58)
- Race & ethnicity
- Hispanic / Latino 52% White 38% Two or more races 22% Black 6% Asian 2% Native American 1%
- Hispanic origin (detail)
- Mexican 45% Cuban 3%
- Common ancestry
- Slovak 1% Lithuanian 1% Italian 1%
- Foreign-born
- 12% · Canada, Vietnam
- Languages at home
- 68% English-only · Spanish 30%
Political lean MEDSL · Ector
- 2024 margin
- Solid R (+52.9) · D 23.2% · R 76.1%
- 2008→2024 swing
- -4.9pp toward R · 2008: -48.0pp · 2024: -52.9pp
- All cycles
- 2024: R+52.9 2020: R+47.8 2016: R+40.6 2012: R+48.9 2008: R+48.0
Not yet ingested
- Civics
- —
Market trends
- HPI YoY
- ▼ -194.97%
- Current HPI
- 229.6022
- Rent YoY
- ▲ 1.36%
- Metro
- Odessa, TX
- State GDP YoY
- ▲ 3.95%
- F500 in state
- 110
Industry mix (Fortune 500 HQ in TX)
| Industry | F500 HQs | Revenue |
|---|---|---|
| Energy | 16 | $1,198B |
|
||
| Technology | 5 | $198B |
|
||
| Engineering / Construction | 4 | $72B |
|
||
| Energy Services | 3 | $60B |
|
||
| Utilities | 3 | $41B |
|
||
| Healthcare | 2 | $330B |
|
||
Price history
-74.1% since first listed22 events — show timeline
- 2026-04-30 Pending — PBBOR
- 2026-04-22 Rental Removed $2,900 APPFOLIO
- 2026-04-17 Contingent — PBBOR
- 2026-03-23 Relisted — PBBOR
- 2026-03-09 Contingent — PBBOR
- 2026-02-11 Price Changed $199,900 ODMLS
- 2026-02-11 Price Changed $199,900 PBBOR
- 2026-01-08 Price Changed $205,000 ODMLS
- 2026-01-08 Price Changed $205,000 PBBOR
- 2025-12-19 Listed for Rent $2,900 APPFOLIO
- 2025-11-19 Price Changed $215,000 ODMLS
- 2025-11-19 Price Changed $215,000 PBBOR
- 2025-09-16 Price Changed $220,000 ODMLS
- 2025-09-15 Price Changed $220,000 PBBOR
- 2025-08-28 Listed $225,000 PBBOR
- 2017-06-22 Delisted — ODMLS
- 2016-08-25 Listed $160,000 ODMLS
- 2006-09-08 Sold (Public Records) — Public Records
- 2005-10-04 Sold (Public Records) — Public Records
- 2003-05-23 Sold (Public Records) — Public Records
- 2003-05-05 Sold (MLS) — ODMLS
- 2003-03-10 Listed $11,200 ODMLS
Property tax history
-2.1%/yrLatest (2025): $1,596 · -40.4% YoY. Source: county tax records.
Cash-flow waterfall
monthlySold comps — $/sqft
last 12 mo · ≤1 miLoading sold comps…