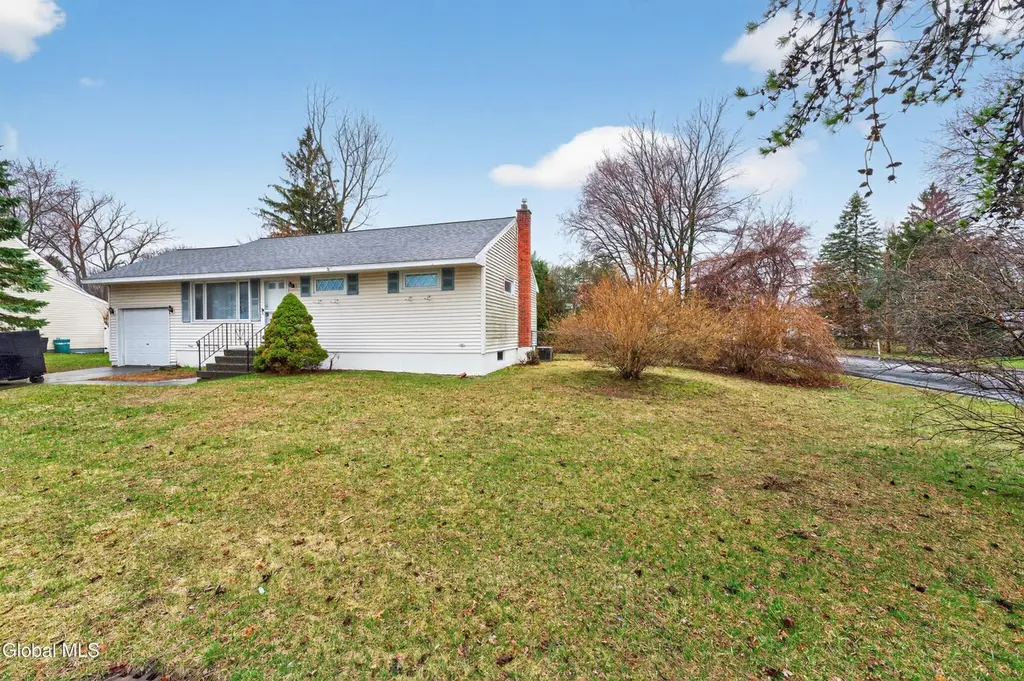
49 Tattersall Ln · Colonie, NY
Flood risk 1/10 · Minimal
- FEMA flood zone
- X (unshaded)
- Chance of flooding over 30 yrs
- 0.0%
- Est. flood insurance / yr
- $473 – $860
Fire risk 3/10 · Minor
- Est. fire insurance / yr
- $691 – $1,283
Heat risk 4/10 · Minor
- Hot days now (above 96°F)
- 7 days/yr
- Hot days in 30 yrs
- 16 days/yr
Wind risk 3/10 · Minor
- Chance of severe wind over 30 yrs
- 6.0%
Air-quality risk 1/10 · Minimal
- Unhealthy air days now
- 0 days/yr
- Unhealthy air days in 30 yrs
- 0 days/yr
Risk factors via First Street. Map © Google.
Why this score? — see what drove the D grade
The composite is a weighted blend of 9 inputs, each scored 0–100. Each bar is that input's sub-score; the figure is the points it added to the 100-point composite (weight × sub-score).
- Cash flow +11.7/30.0
- ARV discount +10.0/15.0
- Schools +5.3/10.0
- Livability +4.2/5.0
- DSCR +3.4/10.0
- 1% rule +3.1/10.0
- Rent growth +2.5/5.0
- Condition / age +2.5/5.0
- Appreciation +0.0/10.0
$254,900
🖨 Deal sheet 📄 Offer letter ✓ Due diligence
Listing remarks MLS
NEW WINDOWS THROUGHOUT/NEW KITCHEN CABINETS/HW FLRS IN BRS & KIT/FENCED YARD/DESIREABLE COLONIE NGHBRHD/NEW FURNACE/HEAT EXCHANGER/NEW GARAGE DR/FIN.REC RM&PLY RM IN BSMT/UPGRADED INSULA IN ATTIC&GARAGE/LOW TAXES -- Excellent Condition
Key facts
- Large corner lot
- Newer roof
- Vinyl siding
Tags
Neighborhood map
What this means for you Summary
Snapshot
- This is a 3-bed/1.0-bath single-family listed at $255k.
Deal economics
- At list price, monthly cash flow is $-74 ($-888/yr) — negative.
- To cash-flow at today's rent, offer at most $242k (5.1% below list).
- To meet the 1% rule (rent ≥ 1% of price), the offer needs to be $207k (18.6% below list).
- Recommended offer: $207k (18.6% below list) — sets the bar for 1% rule.
- Cap rate 5.9% vs local median 4.8% in Colonie — meaningfully above typical; check what's discounted (condition, days-on-market, listing class) to confirm the premium yield is real.
Location & tenants
- Location reads 85/100 on livability (#37 in NY, #572 nationally) — a professional / high-income tenant draw. Strengths: commute A+, employment A+, housing A+; Watch: crime C-, amenities C-, cost of living D.
- South Colonie Central School District (suburban): math 63% / reading 57% proficiency, ranked #215 of 590 in NY (top 36%) — acceptable for families but not a draw, mixed tenant base, ~2y average lease; only 19% free/reduced lunch — higher-income household profile.
- Zoned schools: Colonie Central High School (math 96% / reading 72%, grade A, #404 of 1,100 statewide, top 37%, 1,538 students, 39% FRL) — zoned schools average 39% FRL vs 19% district-wide (20 pts higher); higher-poverty schools than district average — tighter screening recommended.
- Zoned-school proficiency averages 84% at this address vs 60% district-wide (+24 pts) — the actual schools serving this property are materially stronger than the South Colonie Central School District average implies; a family-tenant draw the district grade alone would hide.
- Market conditions: 105 active listings in the ZIP; 3 comparable units currently listed for rent nearby; rentals lingering (median 44d on market — plan ~5-8 weeks vacancy on turnover, expect pricing pressure); 67% of comp listings sitting > 30 days — soft ceiling on asking rent; solid renter incomes; 675 units permitted in Albany County in 2024 (451 in 5+ unit buildings).
Forward outlook
- Local home prices are declining (-3.0%/yr); year-one equity from $2k of loan paydown is wiped out by about $8k of value loss. Plan a longer hold.
- Albany County population projected at +9% by 2050 — modest demand growth; plan on rents tracking national, not racing it.
Negotiation context
- Only 5 days on market — expect competitive offers; lowballing is unlikely to land.
- 2 sale attempts since 24y ago with the ask held roughly flat each time — persistent listings suggest the price (not the market) is what's stuck; bring a comps-based counter.
- Current owner paid $110k; list at $255k implies a 132% gain — meaningful room to come down on a strong offer.
Risks & watch-outs
- Watch-outs: built in 1953 — expect roof / HVAC / electrical / plumbing capex.
Questions for the listing agent
- What do current leases actually rent for vs. the listed asking? Can we see a recent rent roll and the last 12 months of T-12 income?
- Built in 1953 — when were the roof, HVAC, electrical panel, plumbing, and water heater last replaced?
- Is there a deadline driving the sale (1031 exchange, divorce, estate, relocation)? That informs how much negotiation room exists.
- The area grade is low — what's the realistic commute time and amenity access for the typical tenant pool here? Any planned neighborhood developments (good or bad) we should know about?
- What's the average days-on-market for RENTAL listings here right now (not sales)? A rising rental-DOM trend means longer vacancies and softer asking-rent achievability than the comps imply.
- What's the recent tenant-quality profile in this submarket — average credit score on applications, eviction rate, late-payment / NSF rate, and stable-employment percentage? A property-management company in the area should have these aggregated.
- How much new for-sale + rental construction is in the pipeline within 1–3 miles? Heavy new supply typically softens prices + rents 12–24 months out; constrained supply supports both.
Investment metrics
- 1% rule
- 0.81% ✗
- Cap rate
- 5.94%
- Cash-on-cash
- -1.24%
- DSCR
- 0.94
- GRM
- 10.2
CMA / ARV
- ARV (on-the-fly)
- $269,952
- Comps found
- 7
Show comp detail 7 sales within ~0.75 mi
| Address | Dist | Beds/Ba | Sqft | Sold | Price | $/sf | Match |
|---|---|---|---|---|---|---|---|
| 1 Thoroughbred Ln | 0.22mi | 3/1.0 | 988 (+11%) | 5mo | $182,000 | $184 | 67 |
| 1 Winston Pl | 0.39mi | 3/1.0 | 976 (+10%) | 6mo | $300,000 | $307 | 61 |
| 45 Fuller Ter | 0.23mi | 2/1.0 (-1) | 759 (-14%) | 1mo | $255,000 | $336 | 59 |
| 12 Loralee Dr | 0.65mi | 3/1.0 | 912 (+3%) | 7mo | $240,000 | $263 | 59 |
| 22 Hanifin Ave | 0.51mi | 3/1.0 | 962 (+8%) | 5mo | $310,000 | $322 | 58 |
| 36 Red Fox Dr | 0.23mi | 3/1.0 | 1,020 (+15%) | 13mo | $310,000 | $304 | 54 |
| 6 Cottonwood Pl | 0.41mi | 3/1.0 | 976 (+10%) | 21mo | $235,000 | $241 | 47 |
Match score weights: distance 35% · size 25% · config 20% · recency 20%. Top-matched comps best support the ARV.
Projected returns pro-forma
-3.0% appreciation · 3.0% rent growth · sell at horizon
- IRR
- -18.3%
- Equity multiple
- 0.36×
- Total profit
- $-46,015
- Equity at exit
- $38,006
- IRR
- -10.7%
- Equity multiple
- 0.35×
- Total profit
- $-46,130
- Equity at exit
- $22,039
Cash invested: $71,372 (down + closing). Projections, not guarantees.
Landlord ↔ Tenant lean methodology
- Overall (STATE)
- 15 Strongly Tenant-Friendly
- State New York
- 15 Strongly Tenant-Friendly · D+10
- County
- — inherits STATE
- City
- — inherits STATE
ZIP-level market 12205
- Active inventory
- 105
- Price-to-rent
- 10.2×
Monthly cashflow live
- Estimated rent
- $2,075 medium interval (Pro) →
- Mortgage (P&I)
- −$1,337
- Tax from tax record
- −$270 /mo · $3,239/yr
- Insurance
- −$106
- HOA
- −$0
- Vacancy / Maint / Mgmt
- −$436
- Net cashflow
- $-74
Break-even live
UW: 25.0% down · 7.5% · 30yr · 1.5% tax · 5.0% vac · 8.0% maint · 8.0% mgmt
Financing live
Cash to close
- Down payment
- $63,725
- Closing costs
- $7,647
- Reserves months
- —
- Total cash needed
- —
Loan-product check · same deal, 3 products live
Conventional
25% down · 7.5% · 30yr
- Down + closing
- —
- Monthly P&I
- —
- Monthly cashflow
- —
- DSCR
- —
- Eligible?
- —
Personal DTI + credit; lowest rate.
DSCR
20% down · 8.5% · 30yr
- Down + closing
- —
- Monthly P&I
- —
- Monthly cashflow
- —
- DSCR
- —
- Eligible?
- —
No personal income docs; deal must DSCR.
Hard money
10% down · 12.0% · 12mo
- Down + closing
- —
- Monthly P&I
- —
- Monthly cashflow
- —
- DSCR
- —
- Eligible?
- —
Short-term bridge; refi at stabilization.
Rent comps 3 comps
| Address | Beds | Baths | Sqft | Rent | $/sqft | DOM | Units | Dist |
|---|---|---|---|---|---|---|---|---|
| 11 Kimberly St Unit 3 Colonie, NY | 2.0 | 1.0 | 800 | $1,600 | $2.00 | 44d | 1 | 0.41mi |
| 13 Hawley Ave Albany, NY | 3.0 | 1.0 | 864 | $2,550 | $2.95 | 44d | 1 | 1.03mi |
| 13 Richards Dr Albany, NY | 2.0 | 1.0 | 1100 | $2,500 | $2.27 | 21d | 1 | 1.39mi |
Listing history 6 events
-
2026-04-07status Pending
-
2026-04-01$254,900 Active
-
2002-12-27soldstatus $109,900
-
2002-12-23soldstatus $109,900 247-char remark
Show marketing remark (247 chars)
NEW WINDOWS THROUGHOUT/NEW KITCHEN CABINETS/HW FLRS IN BRS & KIT/FENCED YARD/DESIREABLE COLONIE NGHBRHD/NEW FURNACE/HEAT EXCHANGER/NEW GARAGE DR/FIN.REC RM&PLY RM IN BSMT/UPGRADED INSULA IN ATTIC&GARAGE/LOW TAXES -- Excellent Condition
-
2002-11-01historical 247-char remark
Show marketing remark (247 chars)
NEW WINDOWS THROUGHOUT/NEW KITCHEN CABINETS/HW FLRS IN BRS & KIT/FENCED YARD/DESIREABLE COLONIE NGHBRHD/NEW FURNACE/HEAT EXCHANGER/NEW GARAGE DR/FIN.REC RM&PLY RM IN BSMT/UPGRADED INSULA IN ATTIC&GARAGE/LOW TAXES -- Excellent Condition
-
2002-10-17$109,900 247-char remark
Show marketing remark (247 chars)
NEW WINDOWS THROUGHOUT/NEW KITCHEN CABINETS/HW FLRS IN BRS & KIT/FENCED YARD/DESIREABLE COLONIE NGHBRHD/NEW FURNACE/HEAT EXCHANGER/NEW GARAGE DR/FIN.REC RM&PLY RM IN BSMT/UPGRADED INSULA IN ATTIC&GARAGE/LOW TAXES -- Excellent Condition
ⓘ Source: listings_history table (triggers on properties + properties_extension) + one-shot
backfill from property_details.listing_events for pre-trigger history.
Tax reassessment forecast NY · Partial reset (capped growth)
- Current annual tax
- $3,239 · $270/mo
- Projected year-2 tax
- $3,774 · $314/mo
- Expected delta
- +$534/yr (+$45/mo · 16.5%)
ⓘ Screening estimate from a state-policy table — verify with the county assessor before closing.
Climate risk First Street
- Flood 1/10 Low FEMA zone X (unshaded) · 0% chance over 30 yrs
- Wildfire 3/10 Moderate
- Heat 4/10 Moderate 7 d/yr ≥96°F today · 16 d/yr by 30 yrs out
- Wind 3/10 Moderate 6% chance of damaging wind over 30 yrs
- Air quality 1/10 Low 0 unhealthy d/yr today · 0 by 30 yrs out
Nearby sold comps map
Loading sold comps map…
Walkable amenities ~0.75 mi
Loading nearby amenities…
Taxation est. · year 1
- Rental income
- $24,895
- − Mortgage interest
- −$14,278
- − Property taxes
- −$3,239
- − Insurance
- −$1,274
- − Repairs & maintenance
- −$1,992
- − Management
- −$1,992
- − Depreciation
- −$7,415
- Taxable loss
- −$5,296
- Est. tax savings @ 24.0%
- +$1,271
- After-tax cash flow
- $383/yr
For passive investors: Depreciation is non-cash, so a rental often shows a tax loss while cash-flowing — sheltering income. Rental losses are passive: they offset passive income freely, and up to $25,000/yr can offset ordinary (W-2) income if you actively participate and your MAGI is under $100k (phasing out to $0 by $150k); unused losses carry forward. On sale, claimed depreciation is recaptured at up to 25%, and gains may owe capital-gains tax (a 1031 exchange can defer both). Figures are a year-1 estimate at your 24.0% rate — not tax advice; consult a CPA.
Schools (NCES district)
- District
- South Colonie Central School District
- NCES district ID
- 3627210
- Math proficiency
- 63% ▼ -1.00%
- Reading proficiency
- 57% ▲ 4.00%
- Median HH income
- $69,499
- Composite
- 52.97/100
- National rank
- #1527
- State rank
- #215 of 590 in NY
Livability — Colonie
- Score
- 85/100
- State rank
- #37
- US rank
- #572
Category grades
Schools grade is shown separately in the Schools card above.
Census & demographics
- Census place
- Colonie, NY
- County
- Albany County · 196,626 people
- City population
- 25,912
- Metro
- Albany-Schenectady-Troy, NY
- Population (ZIP)
- 25,838
- Household income
- $91,020
- Rent vs Own
- Severe rent burden
- 530.0
Population outlook (Albany County) Hauer SSP2
- Today (2025)
- 320,794 people
- By 2030
- 327,401 · +2.1%
- By 2040
- 338,218 · +5.4%
- By 2050
- 348,467 · +8.6%
- By 2075
- 381,693 · +19.0%
- By 2100
- 393,809 · +22.8%
Race, ethnicity, and origin ACS 2023
- Neighborhood character
- Predominantly White (73%)
- Race & ethnicity
- White 73% Asian 8% Black 8% Two or more races 6% Hispanic / Latino 5%
- Hispanic origin (detail)
- Puerto Rican 3%
- Common ancestry
- Romanian 6% Lithuanian 3% Iranian 2%
- Foreign-born
- 13% · Canada, China, Vietnam
- Languages at home
- 84% English-only · Other Indo-European 4% Russian/Polish/Slavic 3% Tagalog/Filipino 2%
Political lean MEDSL · Albany
- 2024 margin
- Strong D (+25.8) · D 62.9% · R 37.1%
- 2008→2024 swing
- -3.6pp toward R · 2008: 29.4pp · 2024: 25.8pp
- All cycles
- 2024: D+25.8 2020: D+31.4 2016: D+24.3 2012: D+31.0 2008: D+29.4
Not yet ingested
- Civics
- —
Market trends
- HPI YoY
- ▼ -182.10%
- Current HPI
- 302.9752
- Rent YoY
- —
- Metro
- Albany-Schenectady-Troy, NY
- State GDP YoY
- ▲ 2.60%
- F500 in state
- 92
Industry mix (Fortune 500 HQ in NY)
| Industry | F500 HQs | Revenue |
|---|---|---|
| Financial Services | 10 | $950B |
|
||
| Consumer Goods | 9 | $162B |
|
||
| Insurance | 4 | $225B |
|
||
| Telecommunications | 2 | $144B |
|
||
| Pharmaceuticals | 2 | $112B |
|
||
| Media / Entertainment | 2 | $69B |
|
||
Price history
+131.9% since first listed6 events — show timeline
- 2026-04-07 Pending — Global MLS
- 2026-04-01 Listed $254,900 Global MLS
- 2002-12-27 Sold (Public Records) $109,900 Public Records
- 2002-12-23 Sold (MLS) $109,900 Global MLS
- 2002-11-01 Listing Removed — Global MLS
- 2002-10-17 Listed $109,900 Global MLS
Property tax history
+3.2%/yrLatest (2025): $3,239 · +3.5% YoY. Source: county tax records.
Cash-flow waterfall
monthlySold comps — $/sqft
last 12 mo · ≤1 miLoading sold comps…