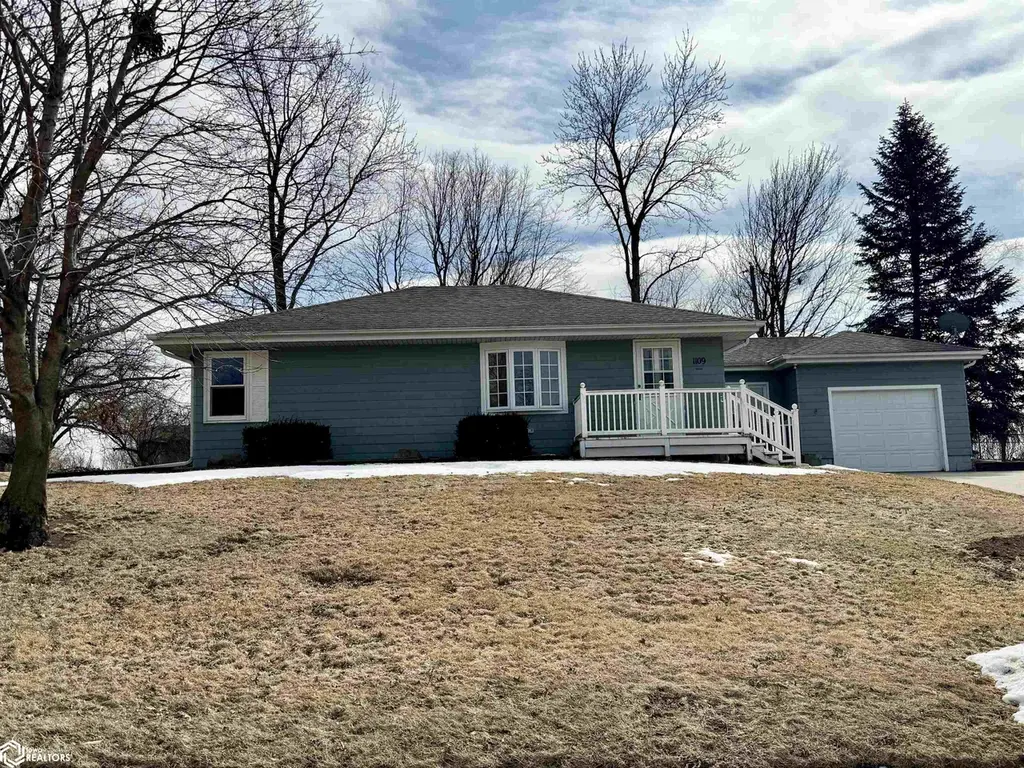
1109 Ridgeway Dr · Audubon, IA
Flood risk 1/10 · Minimal
- FEMA flood zone
- X (unshaded)
- Chance of flooding over 30 yrs
- 0.0%
- Est. flood insurance / yr
- $473 – $860
Fire risk 2/10 · Minimal
- Est. fire insurance / yr
- $902 – $1,676
Heat risk 2/10 · Minimal
- Hot days now (above 104°F)
- 7 days/yr
- Hot days in 30 yrs
- 15 days/yr
Wind risk 2/10 · Minimal
- Chance of severe wind over 30 yrs
- —
Air-quality risk 1/10 · Minimal
- Unhealthy air days now
- 0 days/yr
- Unhealthy air days in 30 yrs
- 0 days/yr
Risk factors via First Street. Map © Google.
Why this score? — see what drove the C grade
The composite is a weighted blend of 9 inputs, each scored 0–100. Each bar is that input's sub-score; the figure is the points it added to the 100-point composite (weight × sub-score).
- ARV discount +13.3/15.0
- Cash flow +12.8/30.0
- Appreciation +10.0/10.0
- Schools +6.4/10.0
- Livability +4.0/5.0
- DSCR +3.8/10.0
- 1% rule +3.6/10.0
- Rent growth +2.5/5.0
- Condition / age +2.5/5.0
$130,000
🖨 Deal sheet 📄 Offer letter ✓ Due diligence
Listing remarks MLS
Your next great project awaits! With beautiful curb appeal and an amazing 0.8 acres of land to work with, this property is the perfect handyman’s special. Main floor includes two large living room areas, an updated kitchen, three bedrooms and a full bathroom. Step into the backyard to relax on the deck, sit underneath the pergola on the cement patio, or stroll to the separate gazebo. With room to play, garden or simply enjoy privacy – a backyard this size is second to none.
Key facts
- 0.8 acres
- Backyard
- Pergola
Tags
Neighborhood map
What this means for you Summary
Snapshot
- This is a 3-bed/1.5-bath single-family listed at $130k.
Deal economics
- At list price, monthly cash flow is $-13 ($-154/yr) — negative.
- To cash-flow at today's rent, offer at most $128k (1.7% below list).
- To meet the 1% rule (rent ≥ 1% of price), the offer needs to be $112k (14.0% below list).
- Recommended offer: $112k (14.0% below list) — sets the bar for 1% rule.
Location & tenants
- Location reads 79/100 on livability (#95 in IA, #1,992 nationally) — a middle-class / working-renter tenant base. Strengths: crime A+, cost of living A+, housing A+; Watch: employment D+, amenities F, commute F.
- Audubon Community School District (rural): math 73% / reading 80% proficiency, ranked #64 of 289 in IA (top 22%) — strong family-tenant draw, lease renewals of 3-5y typical.
- Market conditions: 24 active listings in the ZIP; 4 units permitted in Audubon County in 2024 (0 in 5+ unit buildings).
Forward outlook
- In year one you build about $14k of equity ($899 loan paydown + $13k appreciation (10.0% local appreciation)).
- Audubon County population projected at -29% by 2050 — secular population decline; favor cash flow + early exit over multi-decade hold.
- At projected returns (10.0% appreciation + 3.0% rent growth), your $36k cash investment doubles in ~3 years — after that, you're playing with house money.
- By year 3, paydown + projected appreciation supports a ~$35k cash-out refi (75% LTV) — recoverable capital for the next deal without selling this one.
Negotiation context
- It's been on market 107 days — a 9% lower offer ($118k) is reasonable based on typical stale-listing flexibility.
Risks & watch-outs
- Watch-outs: built in 1954 — expect roof / HVAC / electrical / plumbing capex.
Questions for the listing agent
- What do current leases actually rent for vs. the listed asking? Can we see a recent rent roll and the last 12 months of T-12 income?
- It's been on market 107 days. Have you received any prior offers? Is the seller open to a 14% concession, seller financing, or rate buy-down credit?
- Built in 1954 — when were the roof, HVAC, electrical panel, plumbing, and water heater last replaced?
- Why hasn't it sold? Are there any deal-killer items the seller is aware of (foundation, flood, title, zoning, code violations)?
- Is there a deadline driving the sale (1031 exchange, divorce, estate, relocation)? That informs how much negotiation room exists.
- Schools are B-rated — typically a magnet for longer-tenancy family renters. What's the average tenant stay here, and is there a school-zone premium baked into asking?
- What's the average days-on-market for RENTAL listings here right now (not sales)? A rising rental-DOM trend means longer vacancies and softer asking-rent achievability than the comps imply.
- What's the recent tenant-quality profile in this submarket — average credit score on applications, eviction rate, late-payment / NSF rate, and stable-employment percentage? A property-management company in the area should have these aggregated.
- How much new for-sale + rental construction is in the pipeline within 1–3 miles? Heavy new supply typically softens prices + rents 12–24 months out; constrained supply supports both.
Investment metrics
- 1% rule
- 0.86% ✗
- Cap rate
- 6.17%
- Cash-on-cash
- -0.42%
- DSCR
- 0.98
- GRM
- 9.7
CMA / ARV
- ARV (median comp)
- $149,102
- List price
- $130,000
- Delta
- -12.81%
- Verdict
- UNDERPRICED
- Comps
- 20 within 1.0 mi
Show comp detail 9 sales within ~0.75 mi
| Address | Dist | Beds/Ba | Sqft | Sold | Price | $/sf | Match |
|---|---|---|---|---|---|---|---|
| 202 E Division St St N | 0.45mi | 2/2.5 (-1) | 1,520 (-2%) | 3mo | $170,000 | $112 | 63 |
| 708 1st Ave | 0.52mi | 3/1.5 | 1,440 (-8%) | 2mo | $74,000 | $51 | 62 |
| 506 Chicago St | 0.41mi | 4/2.0 (+1) | 1,493 (-4%) | 8mo | $127,000 | $85 | 60 |
| 720 3rd Ave | 0.44mi | 3/2.0 | 1,465 (-6%) | 12mo | $320,000 | $218 | 58 |
| 215 Scott St | 0.36mi | 4/2.0 (+1) | 1,655 (+6%) | 11mo | $226,000 | $137 | 57 |
| 608 S Division St | 0.35mi | 4/2.0 (+1) | 1,672 (+7%) | 11mo | $152,000 | $91 | 55 |
| 508 Chicago St | 0.40mi | 2/1.0 (-1) | 1,626 (+4%) | 14mo | $108,500 | $67 | 55 |
| 1007 Grandview Dr | 0.21mi | 4/2.5 (+1) | 1,684 (+8%) | 18mo | $230,000 | $137 | 52 |
| 713 Market St | 0.68mi | 3/2.0 | 1,538 (-1%) | 18mo | $50,000 | $33 | 49 |
Match score weights: distance 35% · size 25% · config 20% · recency 20%. Top-matched comps best support the ARV.
Projected returns pro-forma
10.0% appreciation · 3.0% rent growth · sell at horizon
- IRR
- 24.0%
- Equity multiple
- 2.92×
- Total profit
- $69,999
- Equity at exit
- $117,114
- IRR
- 21.3%
- Equity multiple
- 6.68×
- Total profit
- $206,808
- Equity at exit
- $252,561
Cash invested: $36,400 (down + closing). Projections, not guarantees.
Landlord ↔ Tenant lean methodology
- Overall (STATE)
- 83 Strongly Landlord-Friendly
- State Iowa
- 83 Strongly Landlord-Friendly · R+6
- County
- — inherits STATE
- City
- — inherits STATE
ZIP-level market 50025
- Home prices YoY
- 5.4%
- Active inventory
- 24
- Price-to-rent
- 9.7×
Monthly cashflow live
- Estimated rent
- $1,118 medium interval (Pro) →
- Mortgage (P&I)
- −$682
- Tax from tax record
- −$160 /mo · $1,920/yr
- Insurance
- −$54
- HOA
- −$0
- Vacancy / Maint / Mgmt
- −$235
- Net cashflow
- $-13
Break-even live
UW: 25.0% down · 7.5% · 30yr · 1.5% tax · 5.0% vac · 8.0% maint · 8.0% mgmt
Financing live
Cash to close
- Down payment
- $32,500
- Closing costs
- $3,900
- Reserves months
- —
- Total cash needed
- —
Loan-product check · same deal, 3 products live
Conventional
25% down · 7.5% · 30yr
- Down + closing
- —
- Monthly P&I
- —
- Monthly cashflow
- —
- DSCR
- —
- Eligible?
- —
Personal DTI + credit; lowest rate.
DSCR
20% down · 8.5% · 30yr
- Down + closing
- —
- Monthly P&I
- —
- Monthly cashflow
- —
- DSCR
- —
- Eligible?
- —
No personal income docs; deal must DSCR.
Hard money
10% down · 12.0% · 12mo
- Down + closing
- —
- Monthly P&I
- —
- Monthly cashflow
- —
- DSCR
- —
- Eligible?
- —
Short-term bridge; refi at stabilization.
Listing history 17 events
-
2026-06-18days on market $130,000 Active 107 DOM
-
2026-06-17days on market $130,000 Active 106 DOM
-
2026-06-16days on market $130,000 Active 105 DOM
-
2026-06-15days on market $130,000 Active 104 DOM
-
2026-06-13days on market $130,000 Active 102 DOM
-
2026-06-12days on market $130,000 Active 101 DOM
-
2026-06-09days on market $130,000 Active 98 DOM
-
2026-06-08days on market $130,000 Active 97 DOM
-
2026-06-07days on market $130,000 Active 96 DOM
-
2026-06-05days on market $130,000 Active 94 DOM
-
2026-06-04days on market $130,000 Active 92 DOM
-
2026-06-02days on market $130,000 Active 91 DOM
-
2026-06-01days on market $130,000 Active 90 DOM
-
2026-05-31days on market $130,000 Active 89 DOM
-
2026-05-31days on market $130,000 Active 88 DOM
-
2026-05-09price $130,000 490-char remark
Show marketing remark (490 chars)
Your next great project awaits! With beautiful curb appeal and an amazing 0.8 acres of land to work with, this property is the perfect handyman’s special. Main floor includes two large living room areas, an updated kitchen, three bedrooms and a full bathroom. Step into the backyard to relax on the deck, sit underneath the pergola on the cement patio, or stroll to the separate gazebo. With room to play, garden or simply enjoy privacy – a backyard this size is second to none.
-
2026-03-03$140,000 Active 490-char remark
Show marketing remark (490 chars)
Your next great project awaits! With beautiful curb appeal and an amazing 0.8 acres of land to work with, this property is the perfect handyman’s special. Main floor includes two large living room areas, an updated kitchen, three bedrooms and a full bathroom. Step into the backyard to relax on the deck, sit underneath the pergola on the cement patio, or stroll to the separate gazebo. With room to play, garden or simply enjoy privacy – a backyard this size is second to none.
ⓘ Source: listings_history table (triggers on properties + properties_extension) + one-shot
backfill from property_details.listing_events for pre-trigger history.
Tax reassessment forecast IA · Partial reset (capped growth)
- Current annual tax
- $1,920 · $160/mo
- Projected year-2 tax
- $1,980 · $165/mo
- Expected delta
- +$60/yr (+$5/mo · 3.2%)
ⓘ Screening estimate from a state-policy table — verify with the county assessor before closing.
Climate risk First Street
- Flood 1/10 Low FEMA zone X (unshaded) · 0% chance over 30 yrs
- Wildfire 2/10 Low
- Heat 2/10 Low 7 d/yr ≥104°F today · 15 d/yr by 30 yrs out
- Wind 2/10 Low
- Air quality 1/10 Low 0 unhealthy d/yr today · 0 by 30 yrs out
Nearby sold comps map
Loading sold comps map…
Walkable amenities ~0.75 mi
Loading nearby amenities…
Taxation est. · year 1
- Rental income
- $13,413
- − Mortgage interest
- −$7,282
- − Property taxes
- −$1,920
- − Insurance
- −$650
- − Repairs & maintenance
- −$1,073
- − Management
- −$1,073
- − Depreciation
- −$3,782
- Taxable loss
- −$2,367
- Est. tax savings @ 24.0%
- +$568
- After-tax cash flow
- $414/yr
For passive investors: Depreciation is non-cash, so a rental often shows a tax loss while cash-flowing — sheltering income. Rental losses are passive: they offset passive income freely, and up to $25,000/yr can offset ordinary (W-2) income if you actively participate and your MAGI is under $100k (phasing out to $0 by $150k); unused losses carry forward. On sale, claimed depreciation is recaptured at up to 25%, and gains may owe capital-gains tax (a 1031 exchange can defer both). Figures are a year-1 estimate at your 24.0% rate — not tax advice; consult a CPA.
Schools (NCES district)
- District
- Audubon Community School District
- NCES district ID
- 1903960
- Math proficiency
- 73% ▲ 4.00%
- Reading proficiency
- 80% ▲ 7.00%
- Median HH income
- $45,632
- Composite
- 64.32/100
- National rank
- #552
- State rank
- #64 of 289 in IA
Livability — Audubon
- Score
- 79/100
- State rank
- #95
- US rank
- #1992
Category grades
Schools grade is shown separately in the Schools card above.
Census & demographics
- Census place
- Audubon, IA
- Population (ZIP)
- 2,893
Population outlook (Audubon County) Hauer SSP2
- Today (2025)
- 5,157 people
- By 2030
- 4,837 · -6.2%
- By 2040
- 4,241 · -17.8%
- By 2050
- 3,679 · -28.7%
- By 2075
- 2,917 · -43.4%
- By 2100
- 2,408 · -53.3%
Race, ethnicity, and origin ACS 2023
- Neighborhood character
- Predominantly White (94%)
- Race & ethnicity
- White 94% Two or more races 3% Hispanic / Latino 2%
- Common ancestry
- Iranian 3% Portuguese 2% Italian 1%
- Foreign-born
- 1% · Canada
- Languages at home
- 99% English-only · Spanish 1%
Political lean MEDSL · Audubon
- 2024 margin
- Solid R (+38.4) · D 29.9% · R 68.3% · Other 1.7%
- 2008→2024 swing
- -41.5pp toward R · 2008: 3.1pp · 2024: -38.4pp
- All cycles
- 2024: R+38.4 2020: R+35.8 2016: R+31.2 2012: R+5.6 2008: D+3.1
Not yet ingested
- Civics
- —
Market trends
- HPI YoY
- ▲ 11.14%
- Current HPI
- 217.58
- Rent YoY
- —
- Metro
- —
- State GDP YoY
- ▲ 2.48%
- F500 in state
- 4
Industry mix (Fortune 500 HQ in IA)
| Industry | F500 HQs | Revenue |
|---|---|---|
| Financial Services | 1 | $16B |
|
||
| Retail / Convenience | 1 | $15B |
|
||
Price history
-7.1% since first listed2 events — show timeline
- 2026-05-09 Price Changed $130,000 IAR
- 2026-03-03 Listed $140,000 IAR
Property tax history
+3.9%/yrLatest (2025): $1,920 · -9.5% YoY. Source: county tax records.
Cash-flow waterfall
monthlySold comps — $/sqft
last 12 mo · ≤1 miLoading sold comps…