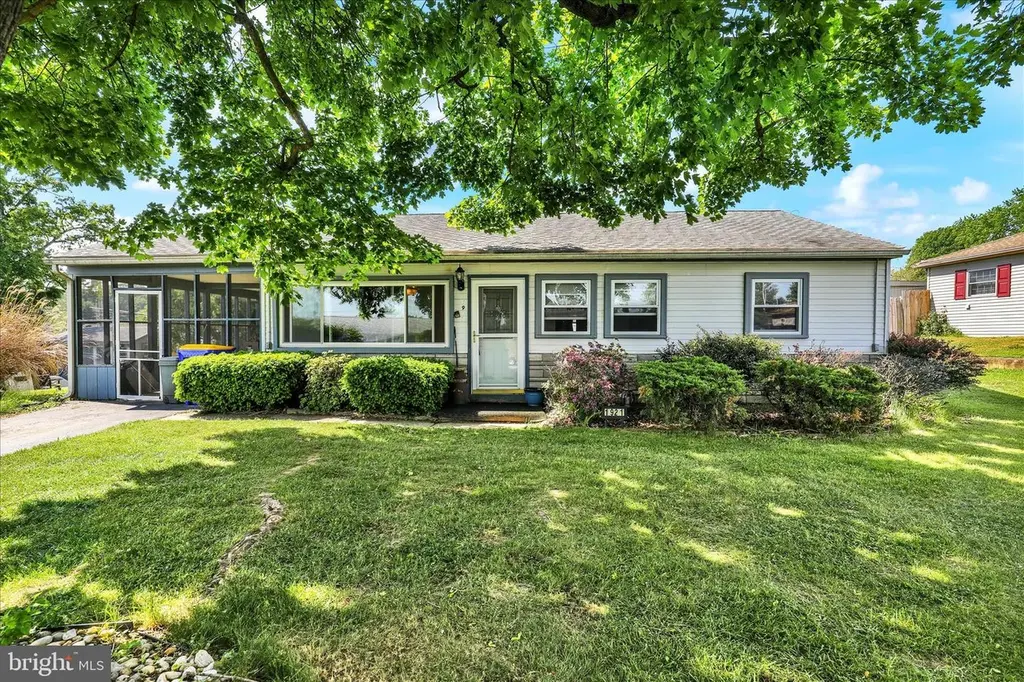
1921 Blue Ridge Dr · Millersville, PA
Flood risk 1/10 · Minimal
- FEMA flood zone
- X (unshaded)
- Chance of flooding over 30 yrs
- 0.0%
- Est. flood insurance / yr
- $507 – $1,088
Fire risk 1/10 · Minimal
- Est. fire insurance / yr
- $511 – $949
Heat risk 6/10 · Moderate
- Hot days now (above 102°F)
- 7 days/yr
- Hot days in 30 yrs
- 15 days/yr
Wind risk 4/10 · Minor
- Chance of severe wind over 30 yrs
- 16.0%
Air-quality risk 4/10 · Minor
- Unhealthy air days now
- 4 days/yr
- Unhealthy air days in 30 yrs
- 7 days/yr
Risk factors via First Street. Map © Google.
Why this score? — see what drove the D+ grade
The composite is a weighted blend of 9 inputs, each scored 0–100. Each bar is that input's sub-score; the figure is the points it added to the 100-point composite (weight × sub-score).
- ARV discount +13.5/15.0
- Cash flow +12.8/30.0
- Schools +5.1/10.0
- Livability +4.2/5.0
- DSCR +3.8/10.0
- 1% rule +3.6/10.0
- Rent growth +2.6/5.0
- Condition / age +2.5/5.0
- Appreciation +0.0/10.0
$225,000
🖨 Deal sheet (PDF) 📄 Offer letter ✓ Due diligence
Listing remarks
Offer has been received. Offer deadline is Tuesday, May 26th at noon. Cute and cozy single on a nice lot with a beautiful back yard. Carport is currently being used as a screened-in porch. Eat-in kitchen with lots of potential. This home needs some sprucing up but it's a Penn Manor single on a great lot for a great price!
Key facts
- Back yard
- Screened-in porch
- Eat-in kitchen
Tags
Property features AI
Exterior
- Parking: Driveway; Attached carport (1 space total for garage/parking)
- Utilities: Public water; Public sewer; Electric service with circuit breakers; Natural gas available
- Home design: Detached property; Good condition; Finished living area reported by assessor
- Construction: Frame construction with metal siding; Shingle roof; Slab foundation; Built year reported by assessor
- Exterior features: Front yard; Rear yard; Patio(s); Shed
Interior
- Kitchen: Built-in range
- Bedrooms: Three bedrooms on the main level
- Flooring: Carpet
- Bathrooms: One full bathroom on the main level
- Heating & cooling: Forced air heating (natural gas); Window air conditioning units (electric)
- Interior features: Traditional floor plan; Combination kitchen and dining area; Dry wall walls and ceilings; Entry-level bedroom
- Laundry & utility: Washer and dryer on the main floor; Natural gas water heater
Neighborhood map
What this means for you Summary
Snapshot
- This is a 3-bed/1.0-bath single-family listed at $225k.
Deal economics
- At list price, monthly cash flow is $-22 ($-264/yr) — negative.
- To cash-flow at today's rent, offer at most $221k (1.7% below list).
- To meet the 1% rule (rent ≥ 1% of price), the offer needs to be $194k (13.6% below list).
- Recommended offer: $194k (13.6% below list) — sets the bar for 1% rule.
- Cap rate 6.2% vs local median 3.0% in Millersville — top-decile yield for the area; either an underpriced asset or a hidden risk that comps aren't pricing in. Stress-test before assuming the spread holds.
Location & tenants
- Location reads 84/100 on livability (#101 in PA, #728 nationally) — a professional / high-income tenant draw. Strengths: crime A+, cost of living A+, housing A+; Watch: amenities D-, commute F.
- Penn Manor SD (suburban): math 52% / reading 65% proficiency, ranked #80 of 539 in PA (top 15%) — acceptable for families but not a draw, mixed tenant base, ~2y average lease.
- Zoned schools: Eshleman El Sch (math 57% / reading 72%, grade B, #249 of 1,518 statewide, top 19%, 341 students, 45% FRL); Manor Middle School (math 39% / reading 58%, grade C-, #146 of 512 statewide, top 30%, 492 students, 54% FRL); Penn Manor Hs (math 82% / reading 30%, grade C, #90 of 437 statewide, top 21%, 1,783 students, 43% FRL) — zoned schools average 47% FRL vs 27% district-wide (20 pts higher); higher-poverty schools than district average — tighter screening recommended.
- Market conditions: Rents flat; 296 active listings in the ZIP; 8 comparable units currently listed for rent nearby; rentals at typical pace (median 16d on market — plan ~3-4 weeks tenant-placement turnaround); solid renter incomes; 1,093 units permitted in Lancaster County in 2024 (201 in 5+ unit buildings).
- This rent runs 30% of the median local income ($77k/yr) — at the standard rent-burdened threshold; future hikes will face affordability resistance.
Forward outlook
- Local home prices are declining (-3.0%/yr); year-one equity from $2k of loan paydown is wiped out by about $7k of value loss. Plan a longer hold.
- Lancaster County population projected at +5% by 2050 — modest demand growth; plan on rents tracking national, not racing it.
Negotiation context
- Only 7 days on market — expect competitive offers; lowballing is unlikely to land.
Risks & watch-outs
- Watch-outs: built in 1956 — expect roof / HVAC / electrical / plumbing capex.
- Climate carrying-cost: extreme-heat days projected 7→15/yr by 2055 (HVAC capex compounding) — expect insurance premiums to compound above CPI over the hold.
Questions for the listing agent
- What do current leases actually rent for vs. the listed asking? Can we see a recent rent roll and the last 12 months of T-12 income?
- Built in 1956 — when were the roof, HVAC, electrical panel, plumbing, and water heater last replaced?
- Is there a deadline driving the sale (1031 exchange, divorce, estate, relocation)? That informs how much negotiation room exists.
- Schools are A-rated — typically a magnet for longer-tenancy family renters. What's the average tenant stay here, and is there a school-zone premium baked into asking?
- The area grade is low — what's the realistic commute time and amenity access for the typical tenant pool here? Any planned neighborhood developments (good or bad) we should know about?
- What's the average days-on-market for RENTAL listings here right now (not sales)? A rising rental-DOM trend means longer vacancies and softer asking-rent achievability than the comps imply.
- What's the recent tenant-quality profile in this submarket — average credit score on applications, eviction rate, late-payment / NSF rate, and stable-employment percentage? A property-management company in the area should have these aggregated.
- How much new for-sale + rental construction is in the pipeline within 1–3 miles? Heavy new supply typically softens prices + rents 12–24 months out; constrained supply supports both.
Investment metrics
- 1% rule
- 0.86% ✗
- Cap rate
- 6.18%
- Cash-on-cash
- -0.42%
- DSCR
- 0.98
- GRM
- 9.6
CMA / ARV
- ARV (on-the-fly)
- $259,925
- Comps found
- 5
Show comp detail 5 sales within ~0.75 mi
| Address | Dist | Beds/Ba | Sqft | Sold | Price | $/sf | Match |
|---|---|---|---|---|---|---|---|
| 1931 Wabank Rd | 0.09mi | 3/1.0 | 960 (+4%) | 3mo | $217,000 | $226 | 87 |
| 60 Fresh Meadow Dr | 0.18mi | 3/1.0 | 1,050 (+14%) | 7mo | $304,900 | $290 | 64 |
| 112 Village Green Ln | 0.19mi | 2/1.0 (-1) | 800 (-14%) | 23mo | $225,000 | $281 | 45 |
| 325 Barbara St | 0.53mi | 2/1.0 (-1) | 1,008 (+9%) | 19mo | $319,000 | $316 | 40 |
| 228 Herr Ave | 0.75mi | 2/1.0 (-1) | 1,000 (+8%) | 21mo | $269,000 | $269 | 29 |
Match score weights: distance 35% · size 25% · config 20% · recency 20%. Top-matched comps best support the ARV.
Projected returns pro-forma
-3.0% appreciation · 0.47% rent growth · sell at horizon
- IRR
- -19.9%
- Equity multiple
- 0.32×
- Total profit
- $-42,659
- Equity at exit
- $33,548
- IRR
- -19.4%
- Equity multiple
- 0.08×
- Total profit
- $-57,659
- Equity at exit
- $19,454
Cash invested: $63,000 (down + closing). Projections, not guarantees.
Landlord ↔ Tenant lean methodology
- Overall (STATE)
- 62 Landlord-Friendly
- State Pennsylvania
- 62 Landlord-Friendly · EVEN
- County
- — inherits STATE
- City
- — inherits STATE
ZIP-level market 17603
- Rents YoY
- 0.5%
- Active inventory
- 296
- Price-to-rent
- 9.6×
Monthly cashflow live
- Estimated rent
- $1,945 high interval (Pro) →
- Mortgage (P&I)
- −$1,180
- Tax from tax record
- −$285 /mo · $3,415/yr
- Insurance
- −$94
- HOA
- −$0
- Vacancy / Maint / Mgmt
- −$408
- Net cashflow
- $-22
Break-even live
Sensitivity live
| Price | -10% $105 | -5% $42 | +0% $-22 | +5% $-86 | +10% $-149 |
|---|---|---|---|---|---|
| Rent | -10% $-176 | -5% $-99 | +0% $-22 | +5% $55 | +10% $132 |
| Rate | -1.0pp $91 | -0.5pp $35 | base $-22 | +0.5pp $-80 | +1.0pp $-140 |
UW: 25.0% down · 7.5% · 30yr · 1.5% tax · 5.0% vac · 8.0% maint · 8.0% mgmt
Financing live
Cash to close
- Down payment
- $56,250
- Closing costs
- $6,750
- Reserves months
- —
- Total cash needed
- —
Loan-product check · same deal, 3 products live
Conventional
25% down · 7.5% · 30yr
- Down + closing
- —
- Monthly P&I
- —
- Monthly cashflow
- —
- DSCR
- —
- Eligible?
- —
Personal DTI + credit; lowest rate.
DSCR
20% down · 8.5% · 30yr
- Down + closing
- —
- Monthly P&I
- —
- Monthly cashflow
- —
- DSCR
- —
- Eligible?
- —
No personal income docs; deal must DSCR.
Hard money
10% down · 12.0% · 12mo
- Down + closing
- —
- Monthly P&I
- —
- Monthly cashflow
- —
- DSCR
- —
- Eligible?
- —
Short-term bridge; refi at stabilization.
Rent comps 8 comps
| Address | Beds | Baths | Sqft | Rent | $/sqft | DOM | Units | Dist |
|---|---|---|---|---|---|---|---|---|
| 100 Country View Ln Millersville, PA | 1.0–2.0 | 1.0–2.0 | 970 | $1,838 | $1.89 | 15d | 6 | 0.85mi |
| 1633A Judie Ln Lancaster, PA | 1.0–2.0 | 1.0–2.0 | 848 | $1,698 | $2.00 | 15d | 13 | 0.85mi |
| 1415 Spencer Ave Lancaster, PA | 1.0–3.0 | 1.0–2.0 | 1181 | $3,720 | $3.15 | 15d | 1 | 1.09mi |
| 26 Blue Rock Rd Millersville, PA | 2.0 | 1.5 | 1046 | $1,750 | $1.67 | 45d | 1 | 1.14mi |
| 480 Euclid Ave Lancaster, PA | 1.0–2.0 | 1.0–1.5 | 830 | $1,695 | $2.04 | 45d | 1 | 1.32mi |
| 99 Dickinson Ave Lancaster, PA | 2.0 | 2.0 | 981 | $1,634 | $1.67 | 15d | 1 | 1.34mi |
| 124 Pickwick Pl Millersville, PA | 3.0 | 1.5 | 796 | $1,850 | $2.32 | 15d | 1 | 1.41mi |
| 1127 Wabank St Lancaster, PA | 1.0–2.0 | 1.0 | 760 | $1,650 | $2.17 | 25d | 1 | 1.41mi |
Listing history 1 events
-
2026-05-19$225,000 Active
ⓘ Source: listings_history table (triggers on properties + properties_extension) + one-shot
backfill from property_details.listing_events for pre-trigger history.
Tax reassessment forecast PA · Partial reset (capped growth)
- Current annual tax
- $3,415 · $285/mo
- Projected year-2 tax
- $3,485 · $290/mo
- Expected delta
- +$70/yr (+$6/mo · 2.0%)
ⓘ Screening estimate from a state-policy table — verify with the county assessor before closing.
Climate risk First Street
- Flood 1/10 Low FEMA zone X (unshaded) · 0% chance over 30 yrs
- Wildfire 1/10 Low
- Heat 6/10 Major 7 d/yr ≥102°F today · 15 d/yr by 30 yrs out
- Wind 4/10 Moderate 16% chance of damaging wind over 30 yrs
- Air quality 4/10 Moderate 4 unhealthy d/yr today · 7 by 30 yrs out
Nearby sold comps map
Loading sold comps map…
Walkable amenities ~0.75 mi
Loading nearby amenities…
Taxation est. · year 1
- Rental income
- $23,336
- − Mortgage interest
- −$12,603
- − Property taxes
- −$3,415
- − Insurance
- −$1,125
- − Repairs & maintenance
- −$1,867
- − Management
- −$1,867
- − Depreciation
- −$6,545
- Taxable loss
- −$4,087
- Est. tax savings @ 24.0%
- +$981
- After-tax cash flow
- $717/yr
For passive investors: Depreciation is non-cash, so a rental often shows a tax loss while cash-flowing — sheltering income. Rental losses are passive: they offset passive income freely, and up to $25,000/yr can offset ordinary (W-2) income if you actively participate and your MAGI is under $100k (phasing out to $0 by $150k); unused losses carry forward. On sale, claimed depreciation is recaptured at up to 25%, and gains may owe capital-gains tax (a 1031 exchange can defer both). Figures are a year-1 estimate at your 24.0% rate — not tax advice; consult a CPA.
Schools (NCES district)
- District
- Penn Manor SD
- NCES district ID
- 4218630
- Math proficiency
- 52% ▼ -7.00%
- Reading proficiency
- 65% ▼ -7.00%
- Median HH income
- $59,275
- Composite
- 50.67/100
- National rank
- #1826
- State rank
- #80 of 539 in PA
Livability — Millersville
- Score
- 84/100
- State rank
- #101
- US rank
- #728
Category grades
Schools grade is shown separately in the Schools card above.
Census & demographics
- Census place
- Millersville, PA
- County
- Lancaster County · 390,309 people
- City population
- 11,753
- Metro
- Lancaster, PA
- Population (ZIP)
- 67,571
- Household income
- $77,084
- Rent vs Own
- Severe rent burden
- 2557.0
Population outlook (Lancaster County) Hauer SSP2
- Today (2025)
- 561,011 people
- By 2030
- 570,969 · +1.8%
- By 2040
- 585,929 · +4.4%
- By 2050
- 591,056 · +5.4%
- By 2075
- 594,747 · +6.0%
- By 2100
- 558,850 · -0.4%
Race, ethnicity, and origin ACS 2023
- Neighborhood character
- Diverse neighborhood (Simpson 0.59)
- Race & ethnicity
- White 58% Hispanic / Latino 27% Two or more races 12% Black 7% Asian 4%
- Hispanic origin (detail)
- Mexican 1% Puerto Rican 19% Cuban 1% Dominican 2%
- Common ancestry
- Romanian 2% Slovak 2% Lithuanian 1%
- Foreign-born
- 9% · Canada, China, India
- Languages at home
- 77% English-only · Spanish 17% Other Indo-European 1% Chinese 1%
Political lean MEDSL · Lancaster
- 2024 margin
- R (+15.9) · D 41.5% · R 57.5%
- 2008→2024 swing
- -4.1pp toward R · 2008: -11.8pp · 2024: -15.9pp
- All cycles
- 2024: R+15.9 2020: R+15.8 2016: R+19.7 2012: R+19.2 2008: R+11.8
Not yet ingested
- Civics
- —
Market trends
- HPI YoY
- ▼ -508.78%
- Current HPI
- 289.3324
- Rent YoY
- ▲ 0.47%
- Metro
- Lancaster, PA
- State GDP YoY
- ▲ 1.68%
- F500 in state
- 34
Industry mix (Fortune 500 HQ in PA)
| Industry | F500 HQs | Revenue |
|---|---|---|
| Healthcare | 2 | $309B |
|
||
| Insurance | 2 | $27B |
|
||
| Telecommunications / Media | 1 | $124B |
|
||
| Industrial Distribution | 1 | $22B |
|
||
| Financial Services | 1 | $20B |
|
||
| Chemicals / Materials | 1 | $18B |
|
||
Price history
1 event — show timeline
- 2026-05-19 Listed $225,000 BRIGHT MLS
Property tax history
+2.8%/yrLatest (2026): $3,415 · +6.0% YoY. Source: county tax records.
Cash-flow waterfall
monthlySold comps — $/sqft
last 12 mo · ≤1 miLoading sold comps…