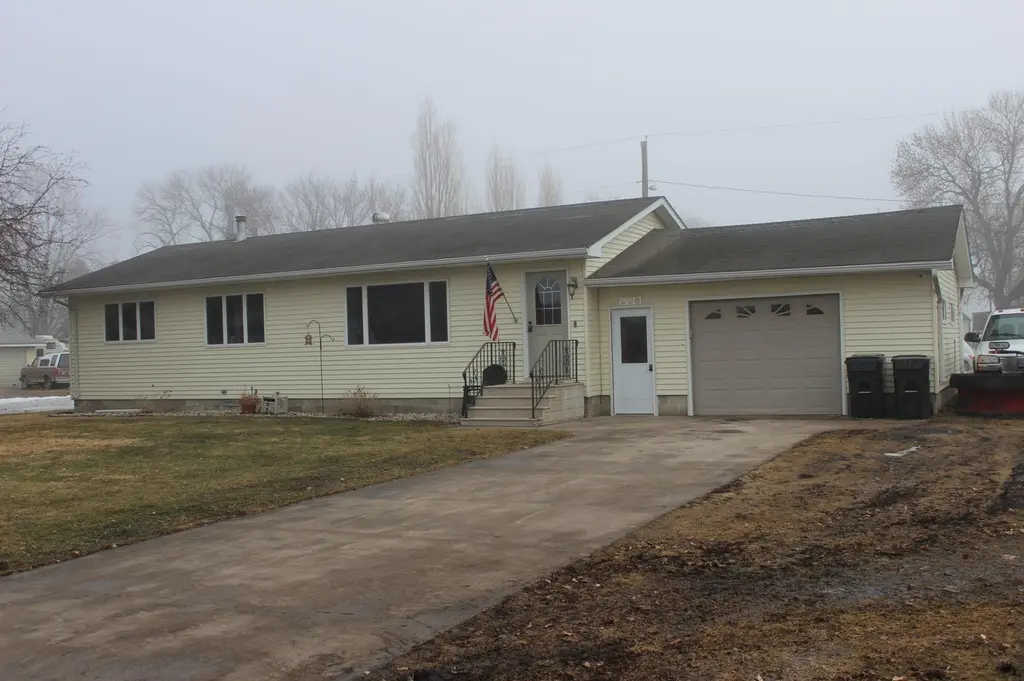
308 Lois Ave S · Herman, MN
Flood risk 1/10 · Minimal
- FEMA flood zone
- —
- Chance of flooding over 30 yrs
- 0.0%
- Est. flood insurance / yr
- —
Fire risk 1/10 · Minimal
- Est. fire insurance / yr
- $888 – $1,650
Heat risk 2/10 · Minimal
- Hot days now (above 99°F)
- 7 days/yr
- Hot days in 30 yrs
- 13 days/yr
Wind risk 2/10 · Minimal
- Chance of severe wind over 30 yrs
- —
Air-quality risk 3/10 · Minor
- Unhealthy air days now
- 3 days/yr
- Unhealthy air days in 30 yrs
- 3 days/yr
Risk factors via First Street. Map © Google.
Why this score? — see what drove the D grade
The composite is a weighted blend of 9 inputs, each scored 0–100. Each bar is that input's sub-score; the figure is the points it added to the 100-point composite (weight × sub-score).
- Appreciation +10.0/10.0
- Cash flow +7.9/30.0
- ARV discount +7.5/15.0
- Schools +5.2/10.0
- Livability +3.3/5.0
- Rent growth +2.5/5.0
- Condition / age +2.5/5.0
- 1% rule +2.0/10.0
- DSCR +2.0/10.0
$155,000
🖨 Deal sheet (PDF) 📄 Offer letter ✓ Due diligence
Listing remarks MLS
Imagine mornings filled with natural light and evenings spent unwinding in a space that truly feels like home. This charming 3 bedroom property offers warmth, comfort, and room to grow. The inviting layout creates easy flow between gathering spaces, while private areas offer peaceful retreats at the end of the day. Whether you're hosting friends or enjoying a quiet night in, this home adapts beautifully to your lifestyle. A place to plant roots. A place to thrive. A place to call yours.
Key facts
- 0.25 acre lot
- Garage
- Built 1976
Neighborhood map
What this means for you Summary
Snapshot
- This is a 3-bed/1.0-bath single-family listed at $155k.
Deal economics
- At list price, monthly cash flow is $-163 ($-2k/yr) — negative.
- To cash-flow at today's rent, offer at most $126k (18.6% below list).
- To meet the 1% rule (rent ≥ 1% of price), the offer needs to be $108k (30.2% below list).
- Recommended offer: $108k (30.2% below list) — sets the bar for 1% rule.
Location & tenants
- Location reads 66/100 on livability (#469 in MN) — a middle-class / working-renter tenant base. Strengths: cost of living A+, housing A+; Watch: health & safety C-, crime D+, amenities F.
- Herman-Norcross School District (rural): math 50% / reading 70% proficiency, ranked #150 of 467 in MN (top 32%) — acceptable for families but not a draw, mixed tenant base, ~2y average lease.
- Zoned schools: Herman Elementary (math 15% / reading 34%, grade F, #721 of 857 statewide, top 84%, 59 students, 58% FRL); Herman Secondary (math 70% / reading 50%, grade C+, #46 of 471 statewide, top 11%, 43 students, 46% FRL) — zoned schools average 52% FRL vs 31% district-wide (21 pts higher); higher-poverty schools than district average — tighter screening recommended.
- Zoned-school proficiency averages 42% at this address vs 60% district-wide (-18 pts) — the specific schools serving this property underperform the Herman-Norcross School District average; the district grade overstates school quality for this exact location.
- Market conditions: 5 active listings in the ZIP; 2 units permitted in Grant County in 2024 (0 in 5+ unit buildings).
Forward outlook
- In year one you build about $17k of equity ($1k loan paydown + $16k appreciation (10.0% local appreciation)).
- Grant County population projected at -20% by 2050 — secular population decline; favor cash flow + early exit over multi-decade hold.
- By year 3, paydown + projected appreciation supports a ~$42k cash-out refi (75% LTV) — recoverable capital for the next deal without selling this one.
Negotiation context
- It's been on market 110 days — a 9% lower offer ($141k) is reasonable based on typical stale-listing flexibility.
- 2 sale attempts with the ask held roughly flat each time — persistent listings suggest the price (not the market) is what's stuck; bring a comps-based counter.
- Current owner paid $120k; 30% above their basis — modest negotiation headroom, anchor on the comps not their cost.
Questions for the listing agent
- What do current leases actually rent for vs. the listed asking? Can we see a recent rent roll and the last 12 months of T-12 income?
- It's been on market 110 days. Have you received any prior offers? Is the seller open to a 30% concession, seller financing, or rate buy-down credit?
- Built in 1976 — when were the roof, HVAC, electrical panel, plumbing, and water heater last replaced?
- Why hasn't it sold? Are there any deal-killer items the seller is aware of (foundation, flood, title, zoning, code violations)?
- Is there a deadline driving the sale (1031 exchange, divorce, estate, relocation)? That informs how much negotiation room exists.
- Schools are A-rated — typically a magnet for longer-tenancy family renters. What's the average tenant stay here, and is there a school-zone premium baked into asking?
- Crime grade is D in this area — have there been break-ins, vandalism, or insurance claims at this property in the last 3 years? What carrier currently insures it and at what premium?
- The area grade is low — what's the realistic commute time and amenity access for the typical tenant pool here? Any planned neighborhood developments (good or bad) we should know about?
- What's the average days-on-market for RENTAL listings here right now (not sales)? A rising rental-DOM trend means longer vacancies and softer asking-rent achievability than the comps imply.
- What's the recent tenant-quality profile in this submarket — average credit score on applications, eviction rate, late-payment / NSF rate, and stable-employment percentage? A property-management company in the area should have these aggregated.
- How much new for-sale + rental construction is in the pipeline within 1–3 miles? Heavy new supply typically softens prices + rents 12–24 months out; constrained supply supports both.
Investment metrics
- 1% rule
- 0.70% ✗
- Cap rate
- 5.03%
- Cash-on-cash
- -4.51%
- DSCR
- 0.80
- GRM
- 11.9
CMA / ARV
No comps found within radius.
Projected returns pro-forma
10.0% appreciation · 3.0% rent growth · sell at horizon
- IRR
- 21.1%
- Equity multiple
- 2.71×
- Total profit
- $74,013
- Equity at exit
- $139,636
- IRR
- 19.1%
- Equity multiple
- 6.21×
- Total profit
- $226,093
- Equity at exit
- $301,131
Cash invested: $43,400 (down + closing). Projections, not guarantees.
Landlord ↔ Tenant lean methodology
- Overall (STATE)
- 46 Balanced
- State Minnesota
- 46 Balanced · D+2
- County
- — inherits STATE
- City
- — inherits STATE
ZIP-level market 56248
- Home prices YoY
- 9.2%
- Active inventory
- 5
- Price-to-rent
- 11.9×
Monthly cashflow live
- Estimated rent
- $1,082 medium interval (Pro) →
- Mortgage (P&I)
- −$813
- Tax from tax record
- −$141 /mo · $1,690/yr
- Insurance
- −$65
- HOA
- −$0
- Vacancy / Maint / Mgmt
- −$227
- Net cashflow
- $-163
Break-even live
Sensitivity live
| Price | -10% $-75 | -5% $-119 | +0% $-163 | +5% $-207 | +10% $-251 |
|---|---|---|---|---|---|
| Rent | -10% $-249 | -5% $-206 | +0% $-163 | +5% $-120 | +10% $-78 |
| Rate | -1.0pp $-85 | -0.5pp $-124 | base $-163 | +0.5pp $-203 | +1.0pp $-244 |
UW: 25.0% down · 7.5% · 30yr · 1.5% tax · 5.0% vac · 8.0% maint · 8.0% mgmt
Financing live
Cash to close
- Down payment
- $38,750
- Closing costs
- $4,650
- Reserves months
- —
- Total cash needed
- —
Loan-product check · same deal, 3 products live
Conventional
25% down · 7.5% · 30yr
- Down + closing
- —
- Monthly P&I
- —
- Monthly cashflow
- —
- DSCR
- —
- Eligible?
- —
Personal DTI + credit; lowest rate.
DSCR
20% down · 8.5% · 30yr
- Down + closing
- —
- Monthly P&I
- —
- Monthly cashflow
- —
- DSCR
- —
- Eligible?
- —
No personal income docs; deal must DSCR.
Hard money
10% down · 12.0% · 12mo
- Down + closing
- —
- Monthly P&I
- —
- Monthly cashflow
- —
- DSCR
- —
- Eligible?
- —
Short-term bridge; refi at stabilization.
Listing history 26 events
-
2026-06-22days on market $155,000 Active 110 DOM
-
2026-06-21days on market $155,000 Active 109 DOM
-
2026-06-21days on market $155,000 Active 108 DOM
-
2026-06-18days on market $155,000 Active 106 DOM
-
2026-06-17days on market $155,000 Active 105 DOM
-
2026-06-16days on market $155,000 Active 104 DOM
-
2026-06-15days on market $155,000 Active 103 DOM
-
2026-06-13days on market $155,000 Active 101 DOM
-
2026-06-12days on market $155,000 Active 100 DOM
-
2026-06-09days on market $155,000 Active 97 DOM
-
2026-06-09remarks 699-char remark
-
2026-06-08days on market $155,000 Active 96 DOM
-
2026-06-07days on market $155,000 Active 95 DOM
-
2026-06-05days on market $155,000 Active 93 DOM
-
2026-06-04days on market $155,000 Active 91 DOM
-
2026-06-02days on market $155,000 Active 90 DOM
-
2026-06-01days on market $155,000 Active 89 DOM
-
2026-05-31days on market $155,000 Active 88 DOM
-
2026-05-31days on market $155,000 Active 87 DOM
-
2026-03-04$155,000 Active 492-char remark
Show marketing remark (492 chars)
Imagine mornings filled with natural light and evenings spent unwinding in a space that truly feels like home. This charming 3 bedroom property offers warmth, comfort, and room to grow. The inviting layout creates easy flow between gathering spaces, while private areas offer peaceful retreats at the end of the day. Whether you're hosting friends or enjoying a quiet night in, this home adapts beautifully to your lifestyle. A place to plant roots. A place to thrive. A place to call yours.
-
2025-09-29status Pending
-
2025-09-29historical
-
2025-09-01$155,000 Active
-
2023-08-08soldstatus $119,500
-
2021-07-29soldstatus $75,000
-
2002-09-23soldstatus $38,000
ⓘ Source: listings_history table (triggers on properties + properties_extension) + one-shot
backfill from property_details.listing_events for pre-trigger history.
Tax reassessment forecast MN · Partial reset (capped growth)
- Current annual tax
- $1,690 · $141/mo
- Projected year-2 tax
- $1,713 · $143/mo
- Expected delta
- +$23/yr (+$2/mo · 1.4%)
ⓘ Screening estimate from a state-policy table — verify with the county assessor before closing.
Climate risk First Street
- Flood 1/10 Low 0% chance over 30 yrs
- Wildfire 1/10 Low
- Heat 2/10 Low 7 d/yr ≥99°F today · 13 d/yr by 30 yrs out
- Wind 2/10 Low
- Air quality 3/10 Moderate 3 unhealthy d/yr today · 3 by 30 yrs out
Nearby sold comps map
Loading sold comps map…
Walkable amenities ~0.75 mi
Loading nearby amenities…
Taxation est. · year 1
- Rental income
- $12,990
- − Mortgage interest
- −$8,682
- − Property taxes
- −$1,690
- − Insurance
- −$775
- − Repairs & maintenance
- −$1,039
- − Management
- −$1,039
- − Depreciation
- −$4,509
- Taxable loss
- −$4,745
- Est. tax savings @ 24.0%
- +$1,139
- After-tax cash flow
- $-818/yr
For passive investors: Depreciation is non-cash, so a rental often shows a tax loss while cash-flowing — sheltering income. Rental losses are passive: they offset passive income freely, and up to $25,000/yr can offset ordinary (W-2) income if you actively participate and your MAGI is under $100k (phasing out to $0 by $150k); unused losses carry forward. On sale, claimed depreciation is recaptured at up to 25%, and gains may owe capital-gains tax (a 1031 exchange can defer both). Figures are a year-1 estimate at your 24.0% rate — not tax advice; consult a CPA.
Schools (NCES district)
- District
- Herman-Norcross School District
- NCES district ID
- 2713890
- Math proficiency
- 50% ▬ 0.00%
- Reading proficiency
- 70% ▲ 15.00%
- Median HH income
- $47,014
- Composite
- 52.36/100
- National rank
- #3425
- State rank
- #150 of 467 in MN
Livability — Herman
- Score
- 66/100
- State rank
- #469
- US rank
- #11204
Category grades
Schools grade is shown separately in the Schools card above.
Census & demographics
- Census place
- Herman, MN
- Population (ZIP)
- 760
Population outlook (Grant County) Hauer SSP2
- Today (2025)
- 5,527 people
- By 2030
- 5,287 · -4.3%
- By 2040
- 4,829 · -12.6%
- By 2050
- 4,415 · -20.1%
- By 2075
- 3,504 · -36.6%
- By 2100
- 2,555 · -53.8%
Race, ethnicity, and origin ACS 2023
- Neighborhood character
- Predominantly White (97%)
- Race & ethnicity
- White 97% Two or more races 2%
- Common ancestry
- Portuguese 22% Italian 3% Iranian 1%
- Foreign-born
- 1% · Canada, South Korea
- Languages at home
- 93% English-only · Spanish 6% German/W. Germanic 1%
Political lean MEDSL · Grant
- 2024 margin
- Solid R (+30.6) · D 33.6% · R 64.2% · Other 2.2%
- 2008→2024 swing
- -36.2pp toward R · 2008: 5.7pp · 2024: -30.6pp
- All cycles
- 2024: R+30.6 2020: R+26.5 2016: R+27.8 2012: R+2.9 2008: D+5.7
Not yet ingested
- Civics
- —
Market trends
- HPI YoY
- ▲ 11.37%
- Current HPI
- 134.5915
- Rent YoY
- —
- Metro
- —
- State GDP YoY
- ▲ 2.41%
- F500 in state
- 34
Industry mix (Fortune 500 HQ in MN)
| Industry | F500 HQs | Revenue |
|---|---|---|
| Healthcare | 2 | $407B |
|
||
| Retail | 2 | $150B |
|
||
| Consumer Goods | 2 | $32B |
|
||
| Industrial Machinery | 2 | $6B |
|
||
| Agriculture | 1 | $40B |
|
||
| Healthcare / Medical Devices | 1 | $32B |
|
||
Price history
+307.9% since first listed7 events — show timeline
- 2026-03-04 Listed $155,000 NORTHSTARMLS as Distributed by MLS Grid
- 2025-09-29 Pending — NORTHSTARMLS as Distributed by MLS Grid
- 2025-09-29 Listing Removed — NORTHSTARMLS as Distributed by MLS Grid
- 2025-09-01 Listed $155,000 NORTHSTARMLS as Distributed by MLS Grid
- 2023-08-08 Sold (Public Records) $119,500 Public Records
- 2021-07-29 Sold (Public Records) $75,000 Public Records
- 2002-09-23 Sold (Public Records) $38,000 Public Records
Property tax history
+5.9%/yrLatest (2026): $1,690 · +59.4% YoY. Source: county tax records.
Cash-flow waterfall
monthlySold comps — $/sqft
last 12 mo · ≤1 miLoading sold comps…