15111 Pipeline Ave #243 · Chino Hills, CA
Flood risk 4/10 · Minor
- FEMA flood zone
- X (unshaded)
- Chance of flooding over 30 yrs
- 0.22%
- Est. flood insurance / yr
- $507 – $1,088
Fire risk 5/10 · Moderate
- Est. fire insurance / yr
- $659 – $1,223
Heat risk 7/10 · Major
- Hot days now (above 100°F)
- 6 days/yr
- Hot days in 30 yrs
- 16 days/yr
Wind risk 1/10 · Minimal
- Chance of severe wind over 30 yrs
- —
Air-quality risk 7/10 · Major
- Unhealthy air days now
- 15 days/yr
- Unhealthy air days in 30 yrs
- 17 days/yr
Risk factors via First Street. Map © Google.
Why this score? — see what drove the D grade
The composite is a weighted blend of 9 inputs, each scored 0–100. Each bar is that input's sub-score; the figure is the points it added to the 100-point composite (weight × sub-score).
- Cash flow +13.5/30.0
- ARV discount +7.5/15.0
- Schools +5.0/10.0
- DSCR +4.1/10.0
- 1% rule +3.8/10.0
- Livability +3.4/5.0
- Rent growth +2.6/5.0
- Condition / age +2.5/5.0
- Appreciation +0.0/10.0
$339,000
🖨 Deal sheet (PDF) 📄 Offer letter ✓ Due diligence
Listing remarks
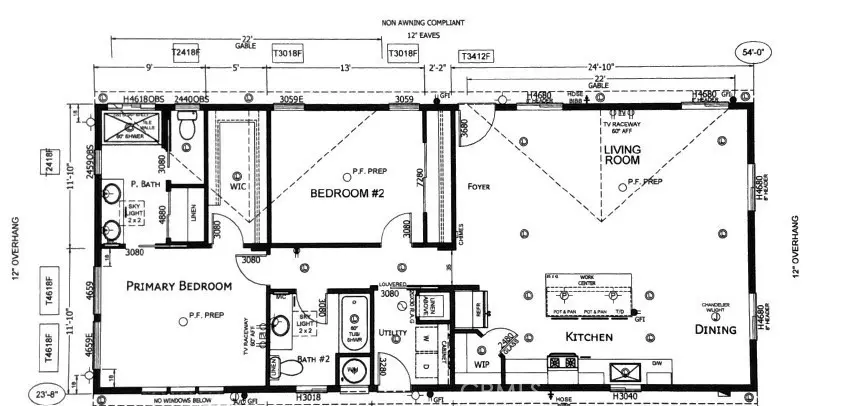
Tucked away in a quiet cul-de-sac within the desirable 55+ community of Lake Los Serranos, this brand-new 2 Bed 2 Bath manufactured home offers rare privacy and a spacious layout. The lot is uniquely secluded, featuring a large attached deck positioned perfectly to enjoy the surrounding mature trees and natural landscape. Inside, the 1,296-square-foot open floor plan feels incredibly bright and airy, elevated by 9-foot ceilings and oversized windows. The functional kitchen comes complete with a walk-in pantry and included stainless steel appliances, while the primary suite features a generous walk-in closet. Outside, the property includes a large storage shed and rare, side-by-side two-car
Key facts
- Open floor plan
- Massive private deck
- Indoor utility room
Tags
Property features AI
Finance
- Other: Park has manager approval and breed-restricted pet policy; Density roughly 11–15 units per acre
- Financial info: Monthly land lease amount (park-managed)
- HOA & community: Senior community; Park name: Lake Los Serranos; Land-lease community (land lease applies)
Exterior
- Parking: Carport parking, side-by-side; Two parking/carport spaces
- Security: Carbon monoxide detector(s); Resident manager; Manager approval required for residency
- Utilities: Public/District water; Sewer available (sewer or septic - unknown); Natural gas available; Electricity available (standard); Cable available; Water heater present; Utilities available per remarks
- Home design: Single-story home; Turnkey condition; Mobile home model 'Summit' (24' x 54'); Mobile home remains on site; Doors swing inward; Multiple (2+) access exits
- Construction: Shingle/asphalt roof; Hardie (Hardee) plank exterior; Fiberglass components; Drywall interior walls; Blown and cellulose insulation; Pillar/post/pier and combination foundation with pier jacks and seismic tie-downs
- Exterior features: Deck; Community pool; Patio; Cement board skirting; Landscaped lot; Located on a cul-de-sac; Community spa; Community amenities include fishing and lake access; Paved road access
Interior
- Kitchen: Kitchen open to family room; Kitchen island; Walk-in pantry; Corian countertops; Dishwasher; Garbage disposal; Microwave; Refrigerator; Free-standing range / Gas oven / Gas range; Ice maker; Energy Star appliances; Gas water heater
- Bedrooms: All bedrooms located on the main floor; Main-floor primary bedroom
- Flooring: Vinyl flooring
- Bathrooms: Two full bathrooms; Primary bathroom with double sinks and walk-in shower; Bathtub; Low-flow toilets; Privacy toilet door; Exhaust fan(s); Linen closet/storage
- Heating & cooling: Central heating (central furnace); Central cooling; Energy Star rated heating and cooling
- Interior features: Crown moldings; High ceilings (9+ feet); Ceiling fan(s); Recessed lighting; Open floor plan; Pantry; Corian counters; Self-closing cabinet doors; Pots & pan drawers; Skylights; Energy Star windows; Energy Star doors; Walk-in closet; Laundry room; All bedrooms on main floor; Main-floor primary bedroom; Walk-in shower; Double sinks in primary bath; Bathtub; Low-flow toilets; Privacy toilet door; Exhaust fan(s); Linen closet/storage; Entry at front door; One-level entry
- Laundry & utility: Dedicated laundry room; Washer hookup; Gas dryer hookup; Individual laundry room
Neighborhood map
What this means for you Summary
Snapshot
- This is a 2-bed/2.0-bath manufactured listed at $339k.
Deal economics
- At list price, monthly cash flow is $12 ($138/yr) — positive.
- The deal already cash-flows at list — no discount required.
- To meet the 1% rule (rent ≥ 1% of price), the offer needs to be $298k (12.1% below list).
- Recommended offer: $298k (12.1% below list) — sets the bar for 1% rule.
- Cap rate 6.3% vs local median 2.1% in Chino Hills — top-decile yield for the area; either an underpriced asset or a hidden risk that comps aren't pricing in. Stress-test before assuming the spread holds.
Location & tenants
- Location reads 68/100 on livability (#299 in CA) — a middle-class / working-renter tenant base. Strengths: employment A+, crime A, amenities B; Watch: health & safety D, commute F, cost of living F.
- Chino Valley Unified (suburban): math 46% / reading 58% proficiency, ranked #334 of 1,400 in CA (top 24%) — acceptable for families but not a draw, mixed tenant base, ~2y average lease.
- Zoned schools: Lyle S. Briggs Fundamental (644 students, 68% FRL); Robert O. Townsend Junior High (879 students, 30% FRL); Chino Hills High (math 57% / reading 76%, grade B, #151 of 1,170 statewide, top 13%, 2,800 students, 25% FRL) — zoned schools at 41% FRL track the district average.
- Zoned-school proficiency averages 66% at this address vs 52% district-wide (+14 pts) — the actual schools serving this property are materially stronger than the Chino Valley Unified average implies; a family-tenant draw the district grade alone would hide.
- Market conditions: Rents flat; 187 active listings in the ZIP; high-income renter base; 5,458 units permitted in San Bernardino County in 2024 (1,500 in 5+ unit buildings).
Forward outlook
- Local home prices are declining (-3.0%/yr); year-one equity from $2k of loan paydown is wiped out by about $10k of value loss. Plan a longer hold.
- San Bernardino County population projected at +15% by 2050 — modest demand growth; plan on rents tracking national, not racing it.
Negotiation context
- It's been on market 23 days — a 2% lower offer ($334k) is reasonable based on typical stale-listing flexibility.
Risks & watch-outs
- Climate carrying-cost: moderate wildfire risk; extreme-heat days projected 6→16/yr by 2055 (HVAC capex compounding) — expect insurance premiums to compound above CPI over the hold.
Questions for the listing agent
- Is there a deadline driving the sale (1031 exchange, divorce, estate, relocation)? That informs how much negotiation room exists.
- Schools are A-rated — typically a magnet for longer-tenancy family renters. What's the average tenant stay here, and is there a school-zone premium baked into asking?
- The area grade is low — what's the realistic commute time and amenity access for the typical tenant pool here? Any planned neighborhood developments (good or bad) we should know about?
- What's the average days-on-market for RENTAL listings here right now (not sales)? A rising rental-DOM trend means longer vacancies and softer asking-rent achievability than the comps imply.
- What's the recent tenant-quality profile in this submarket — average credit score on applications, eviction rate, late-payment / NSF rate, and stable-employment percentage? A property-management company in the area should have these aggregated.
- How much new for-sale + rental construction is in the pipeline within 1–3 miles? Heavy new supply typically softens prices + rents 12–24 months out; constrained supply supports both.
Investment metrics
- 1% rule
- 0.88% ✗
- Cap rate
- 6.33%
- Cash-on-cash
- 0.15%
- DSCR
- 1.01
- GRM
- 9.5
CMA / ARV
No comps found within radius.
Projected returns pro-forma
-3.0% appreciation · 0.2% rent growth · sell at horizon
- IRR
- -19.3%
- Equity multiple
- 0.34×
- Total profit
- $-62,321
- Equity at exit
- $50,546
- IRR
- -19.1%
- Equity multiple
- 0.11×
- Total profit
- $-84,829
- Equity at exit
- $29,311
Cash invested: $94,920 (down + closing). Projections, not guarantees.
Landlord ↔ Tenant lean methodology
- Overall (STATE)
- 18 Strongly Tenant-Friendly
- State California
- 18 Strongly Tenant-Friendly · D+13
- County
- — inherits STATE
- City
- — inherits STATE
ZIP-level market 91709
- Home prices YoY
- -28.5%
- Rents YoY
- 0.2%
- Active inventory
- 187
- Price-to-rent
- 9.5×
Monthly cashflow live
- Estimated rent
- $2,980 medium interval (Pro) →
- Mortgage (P&I)
- −$1,778
- Tax est. 1.5%
- −$424 /mo · $5,085/yr
- Insurance
- −$141
- HOA
- −$0
- Vacancy / Maint / Mgmt
- −$626
- Net cashflow
- $12
Break-even live
Sensitivity live
| Price | -10% $246 | -5% $129 | +0% $12 | +5% $-106 | +10% $-223 |
|---|---|---|---|---|---|
| Rent | -10% $-224 | -5% $-106 | +0% $12 | +5% $129 | +10% $247 |
| Rate | -1.0pp $182 | -0.5pp $98 | base $12 | +0.5pp $-76 | +1.0pp $-166 |
UW: 25.0% down · 7.5% · 30yr · 1.5% tax · 5.0% vac · 8.0% maint · 8.0% mgmt
Financing live
Cash to close
- Down payment
- $84,750
- Closing costs
- $10,170
- Reserves months
- —
- Total cash needed
- —
Loan-product check · same deal, 3 products live
Conventional
25% down · 7.5% · 30yr
- Down + closing
- —
- Monthly P&I
- —
- Monthly cashflow
- —
- DSCR
- —
- Eligible?
- —
Personal DTI + credit; lowest rate.
DSCR
20% down · 8.5% · 30yr
- Down + closing
- —
- Monthly P&I
- —
- Monthly cashflow
- —
- DSCR
- —
- Eligible?
- —
No personal income docs; deal must DSCR.
Hard money
10% down · 12.0% · 12mo
- Down + closing
- —
- Monthly P&I
- —
- Monthly cashflow
- —
- DSCR
- —
- Eligible?
- —
Short-term bridge; refi at stabilization.
Listing history 15 events
-
2026-06-21days on market $339,000 Active 23 DOM
-
2026-06-18days on market $339,000 Active 20 DOM
-
2026-06-17days on market $339,000 Active 19 DOM
-
2026-06-16days on market $339,000 Active 18 DOM
-
2026-06-15days on market $339,000 Active 17 DOM
-
2026-06-13days on market $339,000 Active 15 DOM
-
2026-06-09days on market $339,000 Active 11 DOM
-
2026-06-08days on market $339,000 Active 10 DOM
-
2026-06-07days on market $339,000 Active 9 DOM
-
2026-06-04days on market $339,000 Active 6 DOM
-
2026-06-03days on market $339,000 Active 5 DOM
-
2026-06-02remarks 699-char remark
-
2026-06-02days on market $339,000 Active 4 DOM
-
2026-06-01days on market $339,000 Active 3 DOM
-
2026-05-31days on market $339,000 Active 2 DOM
ⓘ Source: listings_history table (triggers on properties + properties_extension) + one-shot
backfill from property_details.listing_events for pre-trigger history.
Climate risk First Street
- Flood 4/10 Moderate FEMA zone X (unshaded) · 22% chance over 30 yrs
- Wildfire 5/10 Major
- Heat 7/10 Severe 6 d/yr ≥100°F today · 16 d/yr by 30 yrs out
- Wind 1/10 Low
- Air quality 7/10 Severe 15 unhealthy d/yr today · 17 by 30 yrs out
Nearby sold comps map
Loading sold comps map…
Walkable amenities ~0.75 mi
Loading nearby amenities…
Taxation est. · year 1
- Rental income
- $35,761
- − Mortgage interest
- −$18,989
- − Property taxes
- −$5,085
- − Insurance
- −$1,695
- − Repairs & maintenance
- −$2,861
- − Management
- −$2,861
- − Depreciation
- −$9,862
- Taxable loss
- −$5,592
- Est. tax savings @ 24.0%
- +$1,342
- After-tax cash flow
- $1,480/yr
For passive investors: Depreciation is non-cash, so a rental often shows a tax loss while cash-flowing — sheltering income. Rental losses are passive: they offset passive income freely, and up to $25,000/yr can offset ordinary (W-2) income if you actively participate and your MAGI is under $100k (phasing out to $0 by $150k); unused losses carry forward. On sale, claimed depreciation is recaptured at up to 25%, and gains may owe capital-gains tax (a 1031 exchange can defer both). Figures are a year-1 estimate at your 24.0% rate — not tax advice; consult a CPA.
Schools (NCES district)
- District
- Chino Valley Unified
- NCES district ID
- 0608460
- Math proficiency
- 46% ▲ 1.00%
- Reading proficiency
- 58% ▲ 1.00%
- Median HH income
- $83,575
- Composite
- 49.56/100
- National rank
- #4275
- State rank
- #334 of 1400 in CA
Livability — Chino Hills
- Score
- 68/100
- State rank
- #299
- US rank
- #9993
Category grades
Schools grade is shown separately in the Schools card above.
Census & demographics
- Census place
- Chino Hills, CA
- County
- San Bernardino County · 2,030,291 people
- City population
- 78,006
- Metro
- Riverside-San Bernardino-Ontario, CA
- Population (ZIP)
- 78,006
- Household income
- $126,350
- Rent vs Own
- Severe rent burden
- 1964.0
Population outlook (San Bernardino County) Hauer SSP2
- Today (2025)
- 2,300,329 people
- By 2030
- 2,378,907 · +3.4%
- By 2040
- 2,523,137 · +9.7%
- By 2050
- 2,642,388 · +14.9%
- By 2075
- 2,880,769 · +25.2%
- By 2100
- 2,909,436 · +26.5%
Race, ethnicity, and origin ACS 2023
- Neighborhood character
- Highly diverse neighborhood (Simpson 0.70)
- Race & ethnicity
- Asian 40% Hispanic / Latino 28% White 24% Two or more races 14% Black 5%
- Hispanic origin (detail)
- Mexican 22%
- Common ancestry
- Italian 2% Lithuanian 1% Romanian 1%
- Foreign-born
- 33% · China, Canada, South Korea
- Languages at home
- 52% English-only · Chinese 18% Spanish 14% Tagalog/Filipino 5%
Political lean MEDSL · San Bernardino
- 2024 margin
- Toss-up / Even · D 47.5% · R 49.7% · Other 2.8%
- 2008→2024 swing
- -8.5pp toward R · 2008: 6.3pp · 2024: -2.1pp
- All cycles
- 2024: R+2.1 2020: D+10.7 2016: D+9.8 2012: D+5.4 2008: D+6.3
Not yet ingested
- Civics
- —
Market trends
- HPI YoY
- ▼ -152.62%
- Current HPI
- 383.5042
- Rent YoY
- ▲ 0.20%
- Metro
- Riverside-San Bernardino-Ontario, CA
- State GDP YoY
- ▲ 3.21%
- F500 in state
- 116
Industry mix (Fortune 500 HQ in CA)
| Industry | F500 HQs | Revenue |
|---|---|---|
| Technology | 27 | $1,492B |
|
||
| Financial Services | 3 | $174B |
|
||
| Retail | 3 | $44B |
|
||
| Insurance | 3 | $26B |
|
||
| Media / Entertainment | 2 | $115B |
|
||
| Pharmaceuticals / Biotech | 2 | $62B |
|
||
Price history
1 event — show timeline
- 2026-05-29 Listed $339,000 CRMLS
Property tax history
-4.0%/yrLatest (2025): $55 · +0.7% YoY. Source: county tax records.
Cash-flow waterfall
monthlySold comps — $/sqft
last 12 mo · ≤1 miLoading sold comps…