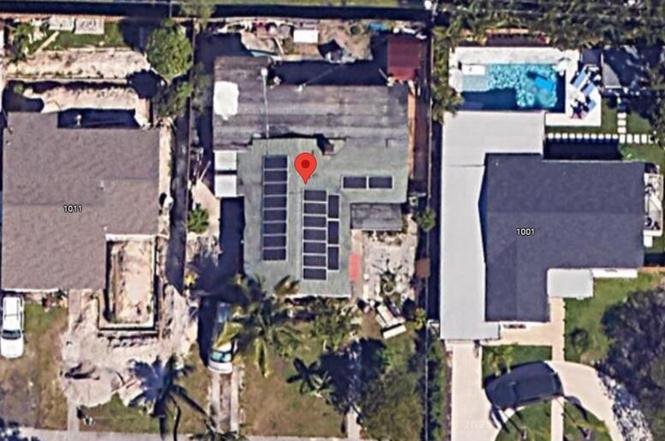
1007 Almeria Rd · West Palm Beach, FL
Flood risk 1/10 · Minimal
- FEMA flood zone
- X (unshaded)
- Chance of flooding over 30 yrs
- 0.0%
- Est. flood insurance / yr
- $507 – $1,088
Fire risk 1/10 · Minimal
- Est. fire insurance / yr
- $947 – $1,759
Heat risk 10/10 · Severe
- Hot days now (above 105°F)
- 7 days/yr
- Hot days in 30 yrs
- 25 days/yr
Wind risk 10/10 · Severe
- Chance of severe wind over 30 yrs
- 99.0%
Air-quality risk 2/10 · Minimal
- Unhealthy air days now
- 1 days/yr
- Unhealthy air days in 30 yrs
- 1 days/yr
Risk factors via First Street. Map © Google.
Why this score? — see what drove the F grade
The composite is a weighted blend of 9 inputs, each scored 0–100. Each bar is that input's sub-score; the figure is the points it added to the 100-point composite (weight × sub-score).
- Cash flow +11.8/30.0
- Schools +4.3/10.0
- Livability +4.1/5.0
- DSCR +3.5/10.0
- Rent growth +3.4/5.0
- 1% rule +2.8/10.0
- Condition / age +2.5/5.0
- ARV discount +0.0/15.0
- Appreciation +0.0/10.0
$495,000
🖨 Deal sheet (PDF) 📄 Offer letter ✓ Due diligence
Listing remarks
Traditional Florida charm meets modern sustainability in this CBS-constructed home featuring a Tesla solar panel roof and a new 2023 AC system. The inviting floor plan is anchored by a charming fireplace, the centerpiece of the living room, and offers bright, open spaces with seamless flow to the outdoors. With its prime location near downtown West Palm Beach, beaches, shopping, and dining, this property also presents an excellent opportunity for investors or those seeking income-producing potential. Durable CBS construction, updated systems, and timeless character make this home a rare find. Highlights: • Tesla solar roof for energy efficiency & savings • CBS construction w
Key facts
- 2023 ac system
- Cbs construction
- Tesla solar roof
Tags
Property features AI
Finance
- Financial info: Pets allowed with no restrictions
- HOA & community: No association amenities listed
Exterior
- Parking: Carport (1 space); 1 covered space; Driveway with decorative paving; 3 open parking spaces
- Security: Smoke detectors
- Utilities: Public water; Public sewer; Three phase electric; Cable available
- Home design: Single family residence; Resale property; One story; Faces south
- Construction: Concrete/CBS construction; Composition/shingle roof
- Exterior features: Covered patio; Patio; Fenced yard; Outbuilding
Interior
- Kitchen: Electric range; Dishwasher; Microwave; Refrigerator; Trash compactor; Electric water heater
- Bedrooms: 4 bedrooms on the main level
- Bathrooms: 3 full bathrooms
- Heating & cooling: Central heating; Central air conditioning; Ceiling fans; Wall/window unit(s)
- Interior features: Blinds on windows; Fireplace; Unfurnished
- Laundry & utility: Laundry closet inside
Neighborhood map
What this means for you Summary
Snapshot
- This is a 4-bed/3.0-bath single-family listed at $495k.
Deal economics
- At list price, monthly cash flow is $-134 ($-2k/yr) — negative.
- To cash-flow at today's rent, offer at most $471k (4.8% below list).
- To meet the 1% rule (rent ≥ 1% of price), the offer needs to be $387k (21.9% below list).
- Recommended offer: $387k (21.9% below list) — sets the bar for 1% rule.
- Cap rate 6.0% vs local median 3.8% in West Palm Beach — top-decile yield for the area; either an underpriced asset or a hidden risk that comps aren't pricing in. Stress-test before assuming the spread holds.
Location & tenants
- Location reads 82/100 on livability (#75 in FL, #1,255 nationally) — a professional / high-income tenant draw. Strengths: commute A+, housing A+, health & safety A+; Watch: employment C-, crime F.
- Palm Beach (suburban): math 46% / reading 53% proficiency, ranked #34 of 73 in FL (top 47%) — families likely to look elsewhere, expect single-tenant / working-renter base with shorter leases.
- Zoned schools: Belvedere Elementary School (math 33% / reading 37%, grade F, #1,697 of 2,144 statewide, top 80%, 477 students, 79% FRL); Conniston Middle School (math 35% / reading 38%, grade F, #405 of 571 statewide, top 72%, 1,075 students, 74% FRL); Forest Hill Community High School (math 20% / reading 41%, grade F, #434 of 667 statewide, top 66%, 2,407 students, 66% FRL) — zoned schools average 73% FRL vs 52% district-wide (21 pts higher); higher-poverty schools than district average — tighter screening recommended.
- Zoned-school proficiency averages 34% at this address vs 50% district-wide (-16 pts) — the specific schools serving this property underperform the Palm Beach average; the district grade overstates school quality for this exact location.
- Market conditions: Rents rising (+3.4%/yr); 211 active listings in the ZIP; 40 comparable units currently listed for rent nearby; rentals at typical pace (median 26d on market — plan ~3-4 weeks tenant-placement turnaround); solid renter incomes; 3,974 units permitted in Palm Beach County in 2024 (1,012 in 5+ unit buildings).
Forward outlook
- Local home prices are declining (-3.0%/yr); year-one equity from $3k of loan paydown is wiped out by about $15k of value loss. Plan a longer hold.
- Palm Beach County population projected at +30% by 2050 — long-run rental-demand tailwind backs the buy-and-hold thesis.
Negotiation context
- It's been on market 156 days — a 12% lower offer ($436k) is reasonable based on typical stale-listing flexibility.
- 3 sale attempts since 26y ago; this cycle's ask has dropped $65k (12%) from the opening price — seller is motivated, your offer sets the floor, not the list.
- Current owner paid $115k; list at $495k implies a 332% gain — meaningful room to come down on a strong offer.
Risks & watch-outs
- Watch-outs: built in 1954 — expect roof / HVAC / electrical / plumbing capex.
- Climate carrying-cost: severe wind risk, 99% chance of damaging wind over 30y; extreme-heat days projected 7→25/yr by 2055 (HVAC capex compounding) — expect insurance premiums to compound above CPI over the hold.
Questions for the listing agent
- What do current leases actually rent for vs. the listed asking? Can we see a recent rent roll and the last 12 months of T-12 income?
- It's been on market 156 days. Have you received any prior offers? Is the seller open to a 22% concession, seller financing, or rate buy-down credit?
- Built in 1954 — when were the roof, HVAC, electrical panel, plumbing, and water heater last replaced?
- Why hasn't it sold? Are there any deal-killer items the seller is aware of (foundation, flood, title, zoning, code violations)?
- Is there a deadline driving the sale (1031 exchange, divorce, estate, relocation)? That informs how much negotiation room exists.
- Crime grade is F in this area — have there been break-ins, vandalism, or insurance claims at this property in the last 3 years? What carrier currently insures it and at what premium?
- The area grade is low — what's the realistic commute time and amenity access for the typical tenant pool here? Any planned neighborhood developments (good or bad) we should know about?
- What's the average days-on-market for RENTAL listings here right now (not sales)? A rising rental-DOM trend means longer vacancies and softer asking-rent achievability than the comps imply.
- What's the recent tenant-quality profile in this submarket — average credit score on applications, eviction rate, late-payment / NSF rate, and stable-employment percentage? A property-management company in the area should have these aggregated.
- How much new for-sale + rental construction is in the pipeline within 1–3 miles? Heavy new supply typically softens prices + rents 12–24 months out; constrained supply supports both.
Investment metrics
- 1% rule
- 0.78% ✗
- Cap rate
- 5.97%
- Cash-on-cash
- -1.16%
- DSCR
- 0.95
- GRM
- 10.7
CMA / ARV
- ARV (on-the-fly)
- $405,698
- Comps found
- 1
Show comp detail 1 sale within ~0.75 mi
| Address | Dist | Beds/Ba | Sqft | Sold | Price | $/sf | Match |
|---|---|---|---|---|---|---|---|
| 748 Tallapoosa St | 0.35mi | 3/2.0 (-1) | 1,877 (+1%) | 13mo | $410,000 | $218 | 63 |
Match score weights: distance 35% · size 25% · config 20% · recency 20%. Top-matched comps best support the ARV.
Projected returns pro-forma
-3.0% appreciation · 3.44% rent growth · sell at horizon
- IRR
- -17.8%
- Equity multiple
- 0.37×
- Total profit
- $-87,109
- Equity at exit
- $73,806
- IRR
- -9.2%
- Equity multiple
- 0.42×
- Total profit
- $-80,063
- Equity at exit
- $42,799
Cash invested: $138,600 (down + closing). Projections, not guarantees.
Landlord ↔ Tenant lean methodology
- Overall (STATE)
- 87 Strongly Landlord-Friendly
- State Florida
- 87 Strongly Landlord-Friendly · R+3
- County
- — inherits STATE
- City
- — inherits STATE
ZIP-level market 33405
- Rents YoY
- 3.4%
- Active inventory
- 211
- Price-to-rent
- 10.7×
Monthly cashflow live
- Estimated rent
- $3,867 medium interval (Pro) →
- Mortgage (P&I)
- −$2,596
- Tax from tax record
- −$387 /mo · $4,642/yr
- Insurance
- −$206
- HOA
- −$0
- Vacancy / Maint / Mgmt
- −$812
- Net cashflow
- $-134
Break-even live
Sensitivity live
| Price | -10% $146 | -5% $6 | +0% $-134 | +5% $-274 | +10% $-414 |
|---|---|---|---|---|---|
| Rent | -10% $-439 | -5% $-287 | +0% $-134 | +5% $19 | +10% $172 |
| Rate | -1.0pp $115 | -0.5pp $-8 | base $-134 | +0.5pp $-262 | +1.0pp $-393 |
UW: 25.0% down · 7.5% · 30yr · 1.5% tax · 5.0% vac · 8.0% maint · 8.0% mgmt
Financing live
Cash to close
- Down payment
- $123,750
- Closing costs
- $14,850
- Reserves months
- —
- Total cash needed
- —
Loan-product check · same deal, 3 products live
Conventional
25% down · 7.5% · 30yr
- Down + closing
- —
- Monthly P&I
- —
- Monthly cashflow
- —
- DSCR
- —
- Eligible?
- —
Personal DTI + credit; lowest rate.
DSCR
20% down · 8.5% · 30yr
- Down + closing
- —
- Monthly P&I
- —
- Monthly cashflow
- —
- DSCR
- —
- Eligible?
- —
No personal income docs; deal must DSCR.
Hard money
10% down · 12.0% · 12mo
- Down + closing
- —
- Monthly P&I
- —
- Monthly cashflow
- —
- DSCR
- —
- Eligible?
- —
Short-term bridge; refi at stabilization.
Rent comps 40 comps
| Address | Beds | Baths | Sqft | Rent | $/sqft | DOM | Units | Dist |
|---|---|---|---|---|---|---|---|---|
| 3025 Robert Rd West Palm Beach, FL | 4.0 | 2.0 | 1678 | $3,146 | $1.87 | 9d | 1 | 0.23mi |
| 945 Sunset Rd Unit 1 West Palm Beach, FL | 3.0 | 3.0 | 1505 | $5,300 | $3.52 | 26d | 1 | 0.25mi |
| 748 Tallapoosa St West Palm Beach, FL | 3.0 | 2.0 | 1877 | $3,500 | $1.86 | 26d | 1 | 0.33mi |
| 2233 Dock St West Palm Beach, FL | 4.0 | 3.0 | 1926 | $5,300 | $2.75 | 26d | 1 | 0.37mi |
| 712 Tuscaloosa St West Palm Beach, FL | 4.0 | 2.0 | 1390 | $4,495 | $3.23 | 26d | 1 | 0.43mi |
| 2109 Dock St West Palm Beach, FL | 3.0 | 2.0 | 1593 | $3,500 | $2.20 | 4d | 1 | 0.47mi |
| 604 Piedmont Rd West Palm Beach, FL | 4.0 | 2.0 | 1329 | $3,500 | $2.63 | 9d | 1 | 0.49mi |
| 605 Sunset Rd West Palm Beach, FL | 3.0 | 2.0 | 1434 | $4,000 | $2.79 | 26d | 1 | 0.51mi |
| 727 Claremore Dr West Palm Beach, FL | 4.0 | 3.0 | 2469 | $13,500 | $5.47 | 23d | 1 | 0.52mi |
| 616 Upland Rd West Palm Beach, FL | 3.0 | 2.0 | 1456 | $4,500 | $3.09 | 26d | 1 | 0.52mi |
| 616 Upland Rd West Palm Beach, FL | 3.0 | 2.0 | 1456 | $4,500 | $3.09 | 22d | 1 | 0.52mi |
| 1901 Dock St West Palm Beach, FL | 3.0 | 3.5 | 2375 | $16,500 | $6.95 | 7d | 1 | 0.61mi |
| 1901 Dock St West Palm Beach, FL | 3.0 | 3.5 | 2375 | $13,500 | $5.68 | 6d | 1 | 0.61mi |
| 3111 S Dixie Hwy West Palm Beach, FL | 3.0 | 1.0–2.0 | 1024 | $5,172 | $5.05 | 0d | 15 | 0.65mi |
| 412 El Prado West Palm Beach, FL | 4.0 | 3.5 | 2111 | $11,000 | $5.21 | 9d | 1 | 0.79mi |
| 423 Avenida Alegre West Palm Beach, FL | 4.0 | 2.0 | 1700 | $6,500 | $3.82 | 4d | 1 | 0.82mi |
| 300 Buckingham Rd West Palm Beach, FL | 3.0 | 2.0 | 1600 | $15,000 | $9.38 | 26d | 1 | 0.82mi |
| 325 Greymon Dr West Palm Beach, FL | 4.0 | 3.5 | 2280 | $14,500 | $6.36 | 26d | 1 | 0.86mi |
| 236 Greymon Dr West Palm Beach, FL | 3.0 | 2.0 | 1813 | $8,500 | $4.69 | 26d | 1 | 0.96mi |
| 3210 Vincent Rd West Palm Beach, FL | 3.0 | 2.0 | 1551 | $8,500 | $5.48 | 26d | 1 | 1.01mi |
| 3860 Lambert Ave West Palm Beach, FL | 3.0 | 2.5 | 2262 | $6,000 | $2.65 | 26d | 1 | 1.03mi |
| 340 Walton Blvd Unit Single Family House West Palm Beach, FL | 3.0 | 2.0 | 1700 | $4,000 | $2.35 | 1d | 1 | 1.07mi |
| 340 Walton Blvd West Palm Beach, FL | 3.0 | 2.5 | 1854 | $4,000 | $2.16 | 9d | 1 | 1.07mi |
| 110 Wilson Rd West Palm Beach, FL | 3.0 | 1.0 | 1433 | $8,000 | $5.58 | 26d | 1 | 1.10mi |
| 719 Briggs St West Palm Beach, FL | 3.0 | 2.0 | 1328 | $3,500 | $2.64 | 22d | 1 | 1.17mi |
| 550 Okeechobee Blvd #602 West Palm Beach, FL | 3.0 | 2.0 | 1606 | $8,000 | $4.98 | 26d | 1 | 1.26mi |
| 550 Okeechobee Blvd #622 West Palm Beach, FL | 3.0 | 2.0 | 1606 | $7,500 | $4.67 | 26d | 1 | 1.26mi |
| 550 Okeechobee Blvd #422 West Palm Beach, FL | 3.0 | 2.0 | 1709 | $20,000 | $11.70 | 26d | 1 | 1.26mi |
| 550 Okeechobee Blvd #502 West Palm Beach, FL | 3.0 | 2.0 | 1709 | $10,000 | $5.85 | 20d | 1 | 1.26mi |
| 3800 Washington Rd West Palm Beach, FL | 2.0–3.0 | 2.0 | 1318 | $10,000 | $7.59 | 22d | 4 | 1.26mi |
| 3800 Washington Rd West Palm Beach, FL | 2.0–3.0 | 2.0 | 1318 | $10,000 | $7.59 | 3d | 6 | 1.26mi |
| 3800 Washington Rd West Palm Beach, FL | 2.0–3.0 | 2.0 | 1318 | $10,000 | $7.59 | 9d | 5 | 1.26mi |
| 4015 Washington Rd West Palm Beach, FL | 4.0 | 3.0 | 2199 | $12,500 | $5.68 | 26d | 1 | 1.31mi |
| 3901 S Flagler Dr West Palm Beach, FL | 2.0–5.0 | 2.0–5.0 | 2266 | $9,167 | $4.05 | 23d | 6 | 1.31mi |
| 3901 S Flagler Dr West Palm Beach, FL | 2.0–5.0 | 2.0–5.0 | 2266 | $9,000 | $3.97 | 4d | 6 | 1.31mi |
| 1041 W Lakewood Rd West Palm Beach, FL | 3.0 | 2.5 | 1857 | $4,300 | $2.32 | 26d | 1 | 1.32mi |
| 4110 Washington Rd West Palm Beach, FL | 3.0 | 2.5 | 1971 | $12,500 | $6.34 | 26d | 1 | 1.35mi |
| 801 S Olive Ave #427 West Palm Beach, FL | 3.0 | 3.0 | 1982 | $12,000 | $6.05 | 26d | 1 | 1.39mi |
| 4300 Washington Rd West Palm Beach, FL | 3.0 | 2.5 | 1892 | $9,800 | $5.18 | 26d | 1 | 1.40mi |
| 5008 Parker Ave West Palm Beach, FL | 3.0 | 2.0 | 1318 | $4,000 | $3.03 | 26d | 1 | 1.41mi |
Listing history 25 events
-
2026-06-21days on market $495,000 Active 156 DOM
-
2026-06-18days on market $495,000 Active 153 DOM
-
2026-06-17days on market $495,000 Active 152 DOM
-
2026-06-16days on market $495,000 Active 151 DOM
-
2026-06-15days on market $495,000 Active 150 DOM
-
2026-06-13days on market $495,000 Active 148 DOM
-
2026-06-10price $495,000 Active 144 DOM
-
2026-06-09days on market $505,000 Active 144 DOM
-
2026-06-07pricedays on market $505,000 Active 142 DOM
-
2026-06-04days on market $528,500 Active 139 DOM
-
2026-06-03days on market $528,500 Active 138 DOM
-
2026-06-01days on market $528,500 Active 136 DOM
-
2026-05-31days on market $528,500 Active 135 DOM
-
2026-03-17price $528,500
-
2026-02-24price $535,000
-
2026-02-09price $545,000
-
2026-01-15$560,000 Active
-
2026-01-01historical
-
2025-09-11$645,000 Active
-
2025-08-21historical
-
2000-09-28soldstatus $114,600
-
2000-09-15historical
-
2000-07-10$114,800
-
1999-12-29soldstatus $63,000
-
1985-05-01soldstatus $68,000
ⓘ Source: listings_history table (triggers on properties + properties_extension) + one-shot
backfill from property_details.listing_events for pre-trigger history.
Tax reassessment forecast FL · Resets to sale price
- Current annual tax
- $4,642 · $387/mo
- Projected year-2 tax
- $4,642 · $387/mo
- Expected delta
- $0/yr ($0/mo · 0.0%)
ⓘ Screening estimate from a state-policy table — verify with the county assessor before closing.
Climate risk First Street
- Flood 1/10 Low FEMA zone X (unshaded) · 0% chance over 30 yrs
- Wildfire 1/10 Low
- Heat 10/10 Extreme 7 d/yr ≥105°F today · 25 d/yr by 30 yrs out
- Wind 10/10 Extreme 99% chance of damaging wind over 30 yrs
- Air quality 2/10 Low 1 unhealthy d/yr today · 1 by 30 yrs out
Nearby sold comps map
Loading sold comps map…
Walkable amenities ~0.75 mi
Loading nearby amenities…
Taxation est. · year 1
- Rental income
- $46,404
- − Mortgage interest
- −$27,728
- − Property taxes
- −$4,642
- − Insurance
- −$2,475
- − Repairs & maintenance
- −$3,712
- − Management
- −$3,712
- − Depreciation
- −$14,400
- Taxable loss
- −$10,265
- Est. tax savings @ 24.0%
- +$2,464
- After-tax cash flow
- $856/yr
For passive investors: Depreciation is non-cash, so a rental often shows a tax loss while cash-flowing — sheltering income. Rental losses are passive: they offset passive income freely, and up to $25,000/yr can offset ordinary (W-2) income if you actively participate and your MAGI is under $100k (phasing out to $0 by $150k); unused losses carry forward. On sale, claimed depreciation is recaptured at up to 25%, and gains may owe capital-gains tax (a 1031 exchange can defer both). Figures are a year-1 estimate at your 24.0% rate — not tax advice; consult a CPA.
Schools (NCES district)
- District
- Palm Beach
- NCES district ID
- 1201500
- Math proficiency
- 46% ▼ -16.00%
- Reading proficiency
- 53% ▼ -4.00%
- Median HH income
- $53,943
- Composite
- 42.72/100
- National rank
- #3160
- State rank
- #34 of 73 in FL
Livability — West Palm Beach
- Score
- 82/100
- State rank
- #75
- US rank
- #1255
Category grades
Schools grade is shown separately in the Schools card above.
Census & demographics
- Census place
- West Palm Beach, FL
- County
- Palm Beach County · 1,438,312 people
- City population
- 222,012
- Metro
- Miami-Fort Lauderdale-Pompano Beach, FL
- Population (ZIP)
- 19,780
- Household income
- $87,341
- Rent vs Own
- Severe rent burden
- 1055.0
Population outlook (Palm Beach County) Hauer SSP2
- Today (2025)
- 1,637,487 people
- By 2030
- 1,743,255 · +6.5%
- By 2040
- 1,948,712 · +19.0%
- By 2050
- 2,132,979 · +30.3%
- By 2075
- 2,530,027 · +54.5%
- By 2100
- 2,706,979 · +65.3%
Race, ethnicity, and origin ACS 2023
- Neighborhood character
- Majority Hispanic (51%)
- Race & ethnicity
- Hispanic / Latino 51% White 44% Two or more races 24% Black 3% Asian 1%
- Hispanic origin (detail)
- Mexican 7% Puerto Rican 5% Cuban 17% Dominican 2%
- Common ancestry
- Scotch-Irish 2% Slovak 2% Romanian 2%
- Foreign-born
- 37% · Canada, Guatemala, Jamaica
- Languages at home
- 50% English-only · Spanish 44% Other Indo-European 2% French/Haitian/Cajun 1%
Political lean MEDSL · Palm Beach
- 2024 margin
- Toss-up / Even · D 50.0% · R 49.2%
- 2008→2024 swing
- -22.1pp toward R · 2008: 22.9pp · 2024: 0.8pp
- All cycles
- 2024: D+0.8 2020: D+12.8 2016: D+15.3 2012: D+17.0 2008: D+22.9
Not yet ingested
- Civics
- —
Market trends
- HPI YoY
- ▼ -662.68%
- Current HPI
- 509.781
- Rent YoY
- ▲ 3.44%
- Metro
- Miami-Fort Lauderdale-Pompano Beach, FL
- State GDP YoY
- ▲ 3.28%
- F500 in state
- 36
Industry mix (Fortune 500 HQ in FL)
| Industry | F500 HQs | Revenue |
|---|---|---|
| Industrial Technology | 2 | $29B |
|
||
| Insurance | 2 | $17B |
|
||
| Retail | 1 | $60B |
|
||
| Technology Distribution | 1 | $58B |
|
||
| Homebuilding | 1 | $35B |
|
||
| Technology Manufacturing | 1 | $35B |
|
||
Price history
+677.2% since first listed12 events — show timeline
- 2026-03-17 Price Changed $528,500 Beaches MLS
- 2026-02-24 Price Changed $535,000 Beaches MLS
- 2026-02-09 Price Changed $545,000 Beaches MLS
- 2026-01-15 Listed $560,000 Beaches MLS
- 2026-01-01 Listing Removed — Beaches MLS
- 2025-09-11 Listed $645,000 Beaches MLS
- 2025-08-21 Coming Soon — Beaches MLS
- 2000-09-28 Sold (Public Records) $114,600 Public Records
- 2000-09-15 Listing Removed — Beaches MLS
- 2000-07-10 Listed $114,800 Beaches MLS
- 1999-12-29 Sold (Public Records) $63,000 Public Records
- 1985-05-01 Sold (Public Records) $68,000 Public Records
Property tax history
+11.8%/yrLatest (2025): $4,642 · +1.3% YoY. Source: county tax records.
Cash-flow waterfall
monthlySold comps — $/sqft
last 12 mo · ≤1 miLoading sold comps…