1202 Marconi St · Houston, TX
Flood risk 1/10 · Minimal
- FEMA flood zone
- X (unshaded)
- Chance of flooding over 30 yrs
- 0.0%
- Est. flood insurance / yr
- $507 – $1,088
Fire risk 1/10 · Minimal
- Est. fire insurance / yr
- $1,222 – $2,270
Heat risk 9/10 · Severe
- Hot days now (above 109°F)
- 7 days/yr
- Hot days in 30 yrs
- 24 days/yr
Wind risk 9/10 · Severe
- Chance of severe wind over 30 yrs
- 99.0%
Air-quality risk 3/10 · Minor
- Unhealthy air days now
- 2 days/yr
- Unhealthy air days in 30 yrs
- 3 days/yr
Risk factors via First Street. Map © Google.
Why this score? — see what drove the D grade
The composite is a weighted blend of 9 inputs, each scored 0–100. Each bar is that input's sub-score; the figure is the points it added to the 100-point composite (weight × sub-score).
- Cash flow +12.7/30.0
- ARV discount +8.6/15.0
- 1% rule +4.4/10.0
- DSCR +3.8/10.0
- Livability +3.7/5.0
- Schools +2.7/10.0
- Condition / age +2.5/5.0
- Rent growth +2.3/5.0
- Appreciation +0.0/10.0
$799,000
🖨 Deal sheet (PDF) 📄 Offer letter ✓ Due diligence
Listing remarks
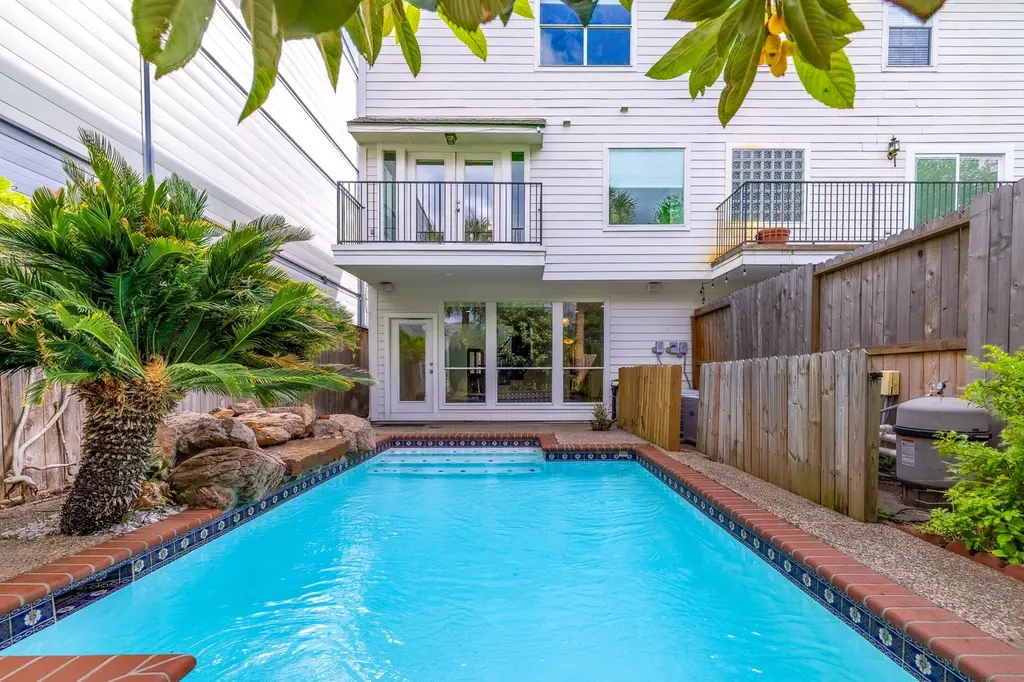
In MONTROSE, NEW ROOF 2025, Unbeatable price for this elegant and sophisticated 3-story townhome. High ceilings, crown molding, FOUR bedrooms with walk-in closets, THREE bathrooms, TWO powder rooms, OFFICE/GYM, LIBRARY/GAMEROOM, SWIMMING POOL, and dry SAUNA. The primary bedroom offers a sitting area with a BALCONY. The kitchen is equipped with granite countertops, an island, walk-in pantry, and a BUTLER'S PANTRY. UTILITY ROOM with SINK and a TWO-CAR garage complete this exquisite home. Refrigerator, washer, and dryer included. Walking distance to numerous RESTAURANTS, minutes to DOWNTOWN, the RIVER OAKS DISTRICT, and the MEDICAL CENTER. NO HOA, NO FLOODING!
Key facts
- Library gameroom
- Office gym
- Swimming pool
Tags
Property features AI
Finance
- HOA & community: Community pool
Exterior
- Parking: Attached 2-car garage; Additional parking
- Utilities: Public water; Public sewer
- Home design: Residential property; Faces northeast; One-story; Full ownership
- Construction: Built in 1997; Brick and wood siding construction; Composition roof; Slab foundation
- Exterior features: Balcony; Deck; Patio; Fence; Sprinkler/irrigation; Front yard
Interior
- Kitchen: Kitchen island; Granite counters; Butler's pantry; Pantry
- Bedrooms: Primary bedroom (Second level, 25x12); Bedroom (Second level, 13x12); Bedroom (Third level, 15x12); Bedroom (Third level, 14x12)
- Flooring: Carpet; Tile; Wood
- Bathrooms: 3 full bathrooms; 2 half bathrooms
- Heating & cooling: Central heating (gas); Central air; Electric cooling; Zoned cooling
- Interior features: Balcony; Butler's pantry; Crown molding; Double vanity; Granite counters; Jetted tub; Kitchen island; Primary bedroom with private bath; Pantry; Separate shower; Tub with shower; Walk-in pantry; Ceiling fans; Gas-log fireplace (1)
- Laundry & utility: Laundry in utility room; Washer; Dryer
Neighborhood map
What this means for you Summary
Snapshot
- This is a 4-bed/3.5-bath townhouse listed at $799k.
Deal economics
- At list price, monthly cash flow is $-82 ($-982/yr) — negative.
- To cash-flow at today's rent, offer at most $785k (1.8% below list).
- To meet the 1% rule (rent ≥ 1% of price), the offer needs to be $753k (5.8% below list).
- Recommended offer: $753k (5.8% below list) — sets the bar for 1% rule.
- Cap rate 6.2% vs local median 3.2% in Houston — top-decile yield for the area; either an underpriced asset or a hidden risk that comps aren't pricing in. Stress-test before assuming the spread holds.
Location & tenants
- Location reads 74/100 on livability (#184 in TX, #4,771 nationally) — a middle-class / working-renter tenant base. Strengths: amenities A+, cost of living A+, housing A+; Watch: crime F.
- Houston ISD (urban): math 27% / reading 35% proficiency, ranked #593 of 826 in TX (top 72%) — families likely to look elsewhere, expect single-tenant / working-renter base with shorter leases; 71% free/reduced lunch — lower-income household profile, screen leases tightly.
- Zoned schools: Wharton K-8 Dual Language Academy (math 38% / reading 50%, grade F, #1,243 of 4,322 statewide, top 29%, 627 students, 45% FRL); Lamar H S (math 38% / reading 65%, grade D+, #478 of 1,632 statewide, top 29%, 3,125 students, 49% FRL) — zoned schools average 47% FRL vs 71% district-wide (24 pts lower); this property's tenant base skews higher-income than the district average.
- Zoned-school proficiency averages 48% at this address vs 31% district-wide (+17 pts) — the actual schools serving this property are materially stronger than the Houston ISD average implies; a family-tenant draw the district grade alone would hide.
- Market conditions: Rents soft (-0.9%/yr); 261 active listings in the ZIP; 21 comparable units currently listed for rent nearby; rentals at typical pace (median 24d on market — plan ~3-4 weeks tenant-placement turnaround); high-income renter base; 29,883 units permitted in Harris County in 2024 (8,621 in 5+ unit buildings).
- At $7,528/mo this rent would consume 78% of the median local household income ($116k/yr) (locally 1844% of renters already pay >50% of income on rent) — very limited rent-growth headroom before tenants either downsize or default.
Forward outlook
- Local home prices are declining (-3.0%/yr); year-one equity from $6k of loan paydown is wiped out by about $24k of value loss. Plan a longer hold.
- Harris County population projected at +47% by 2050 — long-run rental-demand tailwind backs the buy-and-hold thesis.
Negotiation context
- It's been on market 39 days — a 3% lower offer ($775k) is reasonable based on typical stale-listing flexibility.
- 6 sale attempts with the ask held roughly flat each time — persistent listings suggest the price (not the market) is what's stuck; bring a comps-based counter.
Risks & watch-outs
- Climate carrying-cost: severe wind risk, 99% chance of damaging wind over 30y; extreme-heat days projected 7→24/yr by 2055 (HVAC capex compounding) — expect insurance premiums to compound above CPI over the hold.
Questions for the listing agent
- What do current leases actually rent for vs. the listed asking? Can we see a recent rent roll and the last 12 months of T-12 income?
- It's been on market 39 days. Have you received any prior offers? Is the seller open to a 6% concession, seller financing, or rate buy-down credit?
- Is there a deadline driving the sale (1031 exchange, divorce, estate, relocation)? That informs how much negotiation room exists.
- Schools are D-rated, which usually means shorter tenancies and higher turnover. Who's the typical renter profile here, and what's been the actual vacancy rate?
- Crime grade is F in this area — have there been break-ins, vandalism, or insurance claims at this property in the last 3 years? What carrier currently insures it and at what premium?
- The area grade is low — what's the realistic commute time and amenity access for the typical tenant pool here? Any planned neighborhood developments (good or bad) we should know about?
- What's the average days-on-market for RENTAL listings here right now (not sales)? A rising rental-DOM trend means longer vacancies and softer asking-rent achievability than the comps imply.
- What's the recent tenant-quality profile in this submarket — average credit score on applications, eviction rate, late-payment / NSF rate, and stable-employment percentage? A property-management company in the area should have these aggregated.
- How much new for-sale + rental construction is in the pipeline within 1–3 miles? Heavy new supply typically softens prices + rents 12–24 months out; constrained supply supports both.
Investment metrics
- 1% rule
- 0.94% ✗
- Cap rate
- 6.17%
- Cash-on-cash
- -0.44%
- DSCR
- 0.98
- GRM
- 8.8
CMA / ARV
- ARV (on-the-fly)
- $819,060
- Comps found
- 9
Show comp detail 9 sales within ~0.75 mi
| Address | Dist | Beds/Ba | Sqft | Sold | Price | $/sf | Match |
|---|---|---|---|---|---|---|---|
| 1202 Marconi St | 0.00mi | 4/4.0 | 3,740 (0%) | 1mo | $799,000 | $214 | 97 |
| 1238 W Pierce St | 0.19mi | 3/3.5 (-1) | 3,558 (-5%) | 9mo | $750,000 | $211 | 70 |
| 1305 W Bell St | 0.21mi | 3/4.5 (-1) | 3,406 (-9%) | 1mo | $875,000 | $257 | 65 |
| 1016 Crocker St | 0.21mi | 3/2.5 (-1) | 3,360 (-10%) | 3mo | $699,000 | $208 | 62 |
| 301 W Polk St | 0.45mi | 3/3.5 (-1) | 3,208 (-14%) | 1mo | $775,000 | $242 | 50 |
| 1933 W Clay St | 0.62mi | 3/2.5 (-1) | 3,616 (-3%) | 11mo | $699,000 | $193 | 48 |
| 1300 Peden St | 0.30mi | 3/3.5 (-1) | 3,179 (-15%) | 24mo | $695,000 | $219 | 36 |
| 1616 Nevada St | 0.61mi | 3/3.5 (-1) | 3,194 (-15%) | 9mo | $799,900 | $250 | 35 |
| 13 Robita St | 0.58mi | 3/3.5 (-1) | 3,336 (-11%) | 19mo | $790,000 | $237 | 35 |
Match score weights: distance 35% · size 25% · config 20% · recency 20%. Top-matched comps best support the ARV.
Projected returns pro-forma
-3.0% appreciation · 0.0% rent growth · sell at horizon
- IRR
- -20.7%
- Equity multiple
- 0.30×
- Total profit
- $-156,321
- Equity at exit
- $119,133
- IRR
- -23.9%
- Equity multiple
- -0.01×
- Total profit
- $-226,366
- Equity at exit
- $69,083
Cash invested: $223,720 (down + closing). Projections, not guarantees.
Landlord ↔ Tenant lean methodology
- Overall (STATE)
- 87 Strongly Landlord-Friendly
- State Texas
- 87 Strongly Landlord-Friendly · R+5
- County
- — inherits STATE
- City
- — inherits STATE
ZIP-level market 77019
- Rents YoY
- -0.9%
- Active inventory
- 261
- Price-to-rent
- 8.8×
Monthly cashflow live
- Estimated rent
- $7,528 high interval (Pro) →
- Mortgage (P&I)
- −$4,190
- Tax from tax record
- −$1,506 /mo · $18,072/yr
- Insurance
- −$333
- HOA
- −$0
- Lot rent
- −$0
- Vacancy / Maint / Mgmt
- −$1,581
- Net cashflow
- $-82
Break-even live
Sensitivity live
| Price | -10% $370 | -5% $144 | +0% $-82 | +5% $-308 | +10% $-534 |
|---|---|---|---|---|---|
| Rent | -10% $-677 | -5% $-379 | +0% $-82 | +5% $216 | +10% $513 |
| Rate | -1.0pp $321 | -0.5pp $121 | base $-82 | +0.5pp $-289 | +1.0pp $-500 |
UW: 25.0% down · 7.5% · 30yr · 1.5% tax · 5.0% vac · 8.0% maint · 8.0% mgmt
Financing live
Cash to close
- Down payment
- $199,750
- Closing costs
- $23,970
- Reserves months
- —
- Total cash needed
- —
Loan-product check · same deal, 3 products live
Conventional
25% down · 7.5% · 30yr
- Down + closing
- —
- Monthly P&I
- —
- Monthly cashflow
- —
- DSCR
- —
- Eligible?
- —
Personal DTI + credit; lowest rate.
DSCR
20% down · 8.5% · 30yr
- Down + closing
- —
- Monthly P&I
- —
- Monthly cashflow
- —
- DSCR
- —
- Eligible?
- —
No personal income docs; deal must DSCR.
Hard money
10% down · 12.0% · 12mo
- Down + closing
- —
- Monthly P&I
- —
- Monthly cashflow
- —
- DSCR
- —
- Eligible?
- —
Short-term bridge; refi at stabilization.
Rent comps 21 comps
| Address | Beds | Baths | Sqft | Rent | $/sqft | DOM | Units | Dist |
|---|---|---|---|---|---|---|---|---|
| 1211 Marconi St Houston, TX | 4.0 | 3.5 | 3020 | $4,500 | $1.49 | 46d | 1 | 0.01mi |
| 328 Bomar St Houston, TX | 3.0 | 3.5 | 2688 | $5,300 | $1.97 | 24d | 1 | 0.48mi |
| 2205 Commonwealth St Houston, TX | 4.0 | 4.0 | 2513 | $3,300 | $1.31 | 46d | 1 | 0.57mi |
| 811 Buffalo Park Dr Unit 844 Houston, TX | 3.0 | 2.0 | 3632 | $14,913 | $4.11 | 16d | 1 | 0.73mi |
| 811 Buffalo Park Dr Unit 3187 Houston, TX | 3.0 | 2.0 | 3632 | $15,435 | $4.25 | 0d | 1 | 0.73mi |
| 811 Buffalo Park Dr Unit 510 Houston, TX | 3.0 | 2.0 | 3632 | $15,424 | $4.25 | 13d | 1 | 0.73mi |
| 1027 Gross St Houston, TX | 4.0 | 3.5 | 3035 | $5,800 | $1.91 | 46d | 1 | 0.79mi |
| 1958 W Gray St Unit 3165 Houston, TX | 3.0 | 2.0 | 3206 | $15,061 | $4.70 | 0d | 1 | 0.85mi |
| 1958 W Gray St Unit 1991 Houston, TX | 3.0 | 2.0 | 3206 | $15,050 | $4.69 | 13d | 1 | 0.85mi |
| 3411 Yoakum Blvd Unit 510 Houston, TX | 3.0 | 2.0 | 3110 | $12,304 | $3.96 | 13d | 1 | 0.99mi |
| 3411 Yoakum Blvd Unit 3165 Houston, TX | 3.0 | 2.0 | 3110 | $12,315 | $3.96 | 0d | 1 | 0.99mi |
| 1924 Fairview Ave Houston, TX | 3.0 | 3.5 | 2830 | $9,750 | $3.45 | 46d | 1 | 1.02mi |
| 2323 Woodhead St Unit 1019542P Houston, TX | 3.0 | 3.5 | 2820 | $15,722 | $5.58 | 26d | 1 | 1.03mi |
| 911 Thompson St #911 Houston, TX | 4.0 | 3.5 | 3200 | $8,500 | $2.66 | 26d | 1 | 1.17mi |
| 913 Thompson St #913 Houston, TX | 4.0 | 3.5 | 3200 | $8,500 | $2.66 | 26d | 1 | 1.18mi |
| 917 Thompson St Unit 917 Houston, TX | 4.0 | 3.5 | 3200 | $8,000 | $2.50 | 26d | 1 | 1.18mi |
| 915 Thompson St Unit 915 Houston, TX | 4.0 | 3.5 | 3200 | $8,500 | $2.66 | 26d | 1 | 1.19mi |
| 3300 Main St Unit 3165 Houston, TX | 3.0 | 2.0 | 2861 | $7,504 | $2.62 | 0d | 1 | 1.36mi |
| 3300 Main St Unit 3333 Houston, TX | 3.0 | 2.0 | 2861 | $7,493 | $2.62 | 13d | 1 | 1.36mi |
| 2018 Crockett St Unit 2018 Houston, TX | 3.0 | 3.5 | 2514 | $8,000 | $3.18 | 46d | 1 | 1.50mi |
| 2018 Crockett St Unit 1029793P Houston, TX | 3.0 | 3.5 | 2507 | $6,482 | $2.59 | 7d | 1 | 1.50mi |
Listing history 18 events
-
2026-05-08status Pending
-
2026-05-01status Pending
-
2026-03-29$799,000 Active
-
2026-03-29historical
-
2026-02-03$828,900 Active
-
2026-02-03historical
-
2025-11-01$849,000 Active
-
2025-10-31historical
-
2025-09-20$850,000 Active
-
2025-08-29historical
-
2025-07-18price $850,000
-
2025-05-22$885,000 Active
-
2025-05-22historical
-
2025-05-17$885,000 Active
-
2025-05-13historical
-
2006-08-18soldstatus
-
2001-08-29soldstatus
-
2001-08-29soldstatus
ⓘ Source: listings_history table (triggers on properties + properties_extension) + one-shot
backfill from property_details.listing_events for pre-trigger history.
Tax reassessment forecast TX · Resets to sale price
- Current annual tax
- $18,072 · $1,506/mo
- Projected year-2 tax
- $18,072 · $1,506/mo
- Expected delta
- $0/yr ($0/mo · 0.0%)
ⓘ Screening estimate from a state-policy table — verify with the county assessor before closing.
Climate risk First Street
- Flood 1/10 Low FEMA zone X (unshaded) · 0% chance over 30 yrs
- Wildfire 1/10 Low
- Heat 9/10 Extreme 7 d/yr ≥109°F today · 24 d/yr by 30 yrs out
- Wind 9/10 Extreme 99% chance of damaging wind over 30 yrs
- Air quality 3/10 Moderate 2 unhealthy d/yr today · 3 by 30 yrs out
Nearby sold comps map
Loading sold comps map…
Walkable amenities ~0.75 mi
Loading nearby amenities…
Taxation est. · year 1
- Rental income
- $90,335
- − Mortgage interest
- −$44,756
- − Property taxes
- −$18,072
- − Insurance
- −$3,995
- − Repairs & maintenance
- −$7,227
- − Management
- −$7,227
- − Depreciation
- −$23,244
- Taxable loss
- −$14,185
- Est. tax savings @ 24.0%
- +$3,404
- After-tax cash flow
- $2,422/yr
For passive investors: Depreciation is non-cash, so a rental often shows a tax loss while cash-flowing — sheltering income. Rental losses are passive: they offset passive income freely, and up to $25,000/yr can offset ordinary (W-2) income if you actively participate and your MAGI is under $100k (phasing out to $0 by $150k); unused losses carry forward. On sale, claimed depreciation is recaptured at up to 25%, and gains may owe capital-gains tax (a 1031 exchange can defer both). Figures are a year-1 estimate at your 24.0% rate — not tax advice; consult a CPA.
Schools (NCES district)
- District
- Houston ISD
- NCES district ID
- 4823640
- Math proficiency
- 27% ▼ -18.00%
- Reading proficiency
- 35% ▼ -6.00%
- Median HH income
- $46,054
- Composite
- 26.63/100
- National rank
- #7173
- State rank
- #593 of 826 in TX
Livability — Houston
- Score
- 74/100
- State rank
- #184
- US rank
- #4771
Category grades
Schools grade is shown separately in the Schools card above.
Census & demographics
- Census place
- Houston, TX
- County
- Harris County · 4,702,590 people
- City population
- 3,226,434
- Metro
- Houston-The Woodlands-Sugar Land, TX
- Population (ZIP)
- 23,708
- Household income
- $116,423
- Rent vs Own
- Severe rent burden
- 1844.0
Population outlook (Harris County) Hauer SSP2
- Today (2025)
- 5,571,493 people
- By 2030
- 6,089,821 · +9.3%
- By 2040
- 7,142,806 · +28.2%
- By 2050
- 8,185,864 · +46.9%
- By 2075
- 10,574,329 · +89.8%
- By 2100
- 12,109,958 · +117.4%
Race, ethnicity, and origin ACS 2023
- Neighborhood character
- Diverse neighborhood (Simpson 0.62)
- Race & ethnicity
- White 57% Hispanic / Latino 18% Two or more races 13% Asian 10% Black 9%
- Hispanic origin (detail)
- Mexican 12% Salvadoran 1%
- Common ancestry
- Lithuanian 4% Romanian 2% Slovak 2%
- Foreign-born
- 17% · Canada, China, Vietnam
- Languages at home
- 77% English-only · Spanish 11% Other Indo-European 4% Chinese 1%
Political lean MEDSL · Harris
- 2024 margin
- Lean D (+5.5) · D 52.0% · R 46.4% · Other 1.6%
- 2008→2024 swing
- +3.9pp toward D · 2008: 1.6pp · 2024: 5.5pp
- All cycles
- 2024: D+5.5 2020: D+13.3 2016: D+12.4 2012: D+0.1 2008: D+1.6
Not yet ingested
- Civics
- —
Market trends
- HPI YoY
- ▼ -131.69%
- Current HPI
- 179.271
- Rent YoY
- ▼ -0.95%
- Metro
- Houston-The Woodlands-Sugar Land, TX
- State GDP YoY
- ▲ 3.95%
- F500 in state
- 110
Industry mix (Fortune 500 HQ in TX)
| Industry | F500 HQs | Revenue |
|---|---|---|
| Energy | 16 | $1,198B |
|
||
| Technology | 5 | $198B |
|
||
| Engineering / Construction | 4 | $72B |
|
||
| Energy Services | 3 | $60B |
|
||
| Utilities | 3 | $41B |
|
||
| Healthcare | 2 | $330B |
|
||
Price history
-9.7% since first listed18 events — show timeline
- 2026-05-08 Pending — HARMLS
- 2026-05-01 Pending — HARMLS
- 2026-03-29 Listing Removed — HARMLS
- 2026-03-29 Listed $799,000 HARMLS
- 2026-02-03 Listing Removed — HARMLS
- 2026-02-03 Listed $828,900 HARMLS
- 2025-11-01 Listed $849,000 HARMLS
- 2025-10-31 Listing Removed — HARMLS
- 2025-09-20 Listed $850,000 HARMLS
- 2025-08-29 Listing Removed — HARMLS
- 2025-07-18 Price Changed $850,000 HARMLS
- 2025-05-22 Listing Removed — HARMLS
- 2025-05-22 Listed $885,000 HARMLS
- 2025-05-17 Listed $885,000 HARMLS
- 2025-05-13 Coming Soon — HARMLS
- 2006-08-18 Sold (Public Records) — Public Records
- 2001-08-29 Sold (Public Records) — Public Records
- 2001-08-29 Sold (Public Records) — Public Records
Property tax history
+2.3%/yrLatest (2025): $18,072 · +8.9% YoY. Source: county tax records.
Cash-flow waterfall
monthlySold comps — $/sqft
last 12 mo · ≤1 miLoading sold comps…