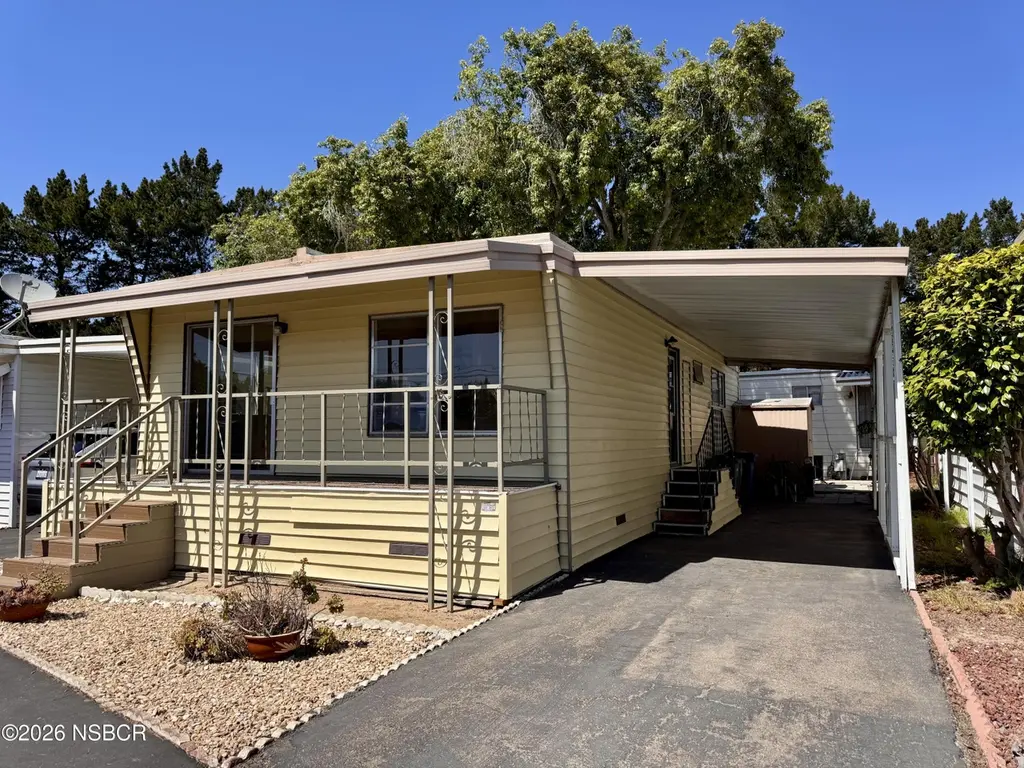
3210 Santa Maria Way #2 · Orcutt, CA
Flood risk 1/10 · Minimal
- FEMA flood zone
- X (unshaded)
- Chance of flooding over 30 yrs
- 0.0%
- Est. flood insurance / yr
- $507 – $1,088
Fire risk 4/10 · Minor
- Est. fire insurance / yr
- $659 – $1,223
Heat risk 3/10 · Minor
- Hot days now (above 85°F)
- 7 days/yr
- Hot days in 30 yrs
- 16 days/yr
Wind risk 1/10 · Minimal
- Chance of severe wind over 30 yrs
- —
Air-quality risk 6/10 · Moderate
- Unhealthy air days now
- 8 days/yr
- Unhealthy air days in 30 yrs
- 10 days/yr
Risk factors via First Street. Map © Google.
Why this score? — see what drove the B- grade
The composite is a weighted blend of 9 inputs, each scored 0–100. Each bar is that input's sub-score; the figure is the points it added to the 100-point composite (weight × sub-score).
- Cash flow +30.0/30.0
- 1% rule +10.0/10.0
- DSCR +10.0/10.0
- ARV discount +6.0/15.0
- Schools +4.6/10.0
- Livability +3.7/5.0
- Rent growth +3.1/5.0
- Condition / age +2.5/5.0
- Appreciation +0.0/10.0
$124,900
🖨 Deal sheet 📄 Offer letter ✓ Due diligence
Listing remarks
Freshly updated and move in ready! Welcome to Orcutt living in Del Cielo Mobile Home Estates. This 2 bedroom, 1 bath home offers approximately 800 sq ft, including an open kitchen to the dining and living room, and a front deck to enjoy the great weather year round. Recent improvements include fresh interior paint, new luxury vinyl plank flooring, new carpet in the bedrooms, and the home was recently leveled. Residents enjoy a community pool, clubhouse, and a beautifully landscaped park. Located just minutes from the 101 freeway for quick access to the Santa Ynez wine country or north to the local beaches. Don't miss this wonderful opportunity to enjoy affordable Central Coast living, conta
Key facts
- Front deck
- Clubhouse
- Community pool
Tags
Property features AI
Finance
- HOA & community: Land lease: $556.11; Age-restricted community
Exterior
- Utilities: Public sewer; Water source: see remarks
- Home design: Manufactured Home
- Construction: Imperial make and model; 40 feet long by 10 feet wide
- Exterior features: Composition roof; Pillar/post/pier foundation; Manufactured home (Imperial model, 40' x 10')
Interior
- Flooring: Carpet; Vinyl
- Bathrooms: 1 full bathroom
- Heating & cooling: Wall furnace heating; Ceiling fan cooling
- Interior features: Carpet and vinyl flooring
Neighborhood map
What this means for you Summary
Snapshot
- This is a 2-bed/1.0-bath manufactured listed at $125k.
Deal economics
- At list price, monthly cash flow is $1k ($13k/yr) — positive.
- The deal already cash-flows at list — no discount required.
- Meets the 1% rule at list price ($2k rent vs $125k).
- Cap rate 16.9% vs local median 2.6% in Orcutt — top-decile yield for the area; either an underpriced asset or a hidden risk that comps aren't pricing in. Stress-test before assuming the spread holds.
Location & tenants
- Location reads 73/100 on livability (#169 in CA) — a middle-class / working-renter tenant base. Strengths: commute A+, employment A+, housing A+; Watch: crime D+, cost of living F.
- Orcutt Union Elementary (suburban): math 44% / reading 54% proficiency, ranked #414 of 1,400 in CA (top 30%) — families likely to look elsewhere, expect single-tenant / working-renter base with shorter leases.
- Market conditions: Rents rising (+2.2%/yr); 124 active listings in the ZIP; 7 comparable units currently listed for rent nearby; rentals leasing fast (median 14d on market — plan ~1-2 weeks tenant-placement turnaround); high-income renter base; 719 units permitted in Santa Barbara County in 2024 (217 in 5+ unit buildings).
Forward outlook
- Local home prices are declining (-3.0%/yr); year-one equity from $864 of loan paydown is wiped out by about $4k of value loss. Plan a longer hold.
- Santa Barbara County population projected at +20% by 2050 — long-run rental-demand tailwind backs the buy-and-hold thesis.
- At projected returns (-3.0% appreciation + 2.2% rent growth), your $35k cash investment doubles in ~4 years — after that, you're playing with house money.
Negotiation context
- Only 10 days on market — expect competitive offers; lowballing is unlikely to land.
Questions for the listing agent
- Built in 1968 — when were the roof, HVAC, electrical panel, plumbing, and water heater last replaced?
- Is there a deadline driving the sale (1031 exchange, divorce, estate, relocation)? That informs how much negotiation room exists.
- Schools are B-rated — typically a magnet for longer-tenancy family renters. What's the average tenant stay here, and is there a school-zone premium baked into asking?
- Crime grade is D in this area — have there been break-ins, vandalism, or insurance claims at this property in the last 3 years? What carrier currently insures it and at what premium?
- What's the average days-on-market for RENTAL listings here right now (not sales)? A rising rental-DOM trend means longer vacancies and softer asking-rent achievability than the comps imply.
- What's the recent tenant-quality profile in this submarket — average credit score on applications, eviction rate, late-payment / NSF rate, and stable-employment percentage? A property-management company in the area should have these aggregated.
- How much new for-sale + rental construction is in the pipeline within 1–3 miles? Heavy new supply typically softens prices + rents 12–24 months out; constrained supply supports both.
Investment metrics
- 1% rule
- 2.00% ✓
- Cap rate
- 16.94%
- Cash-on-cash
- 38.04%
- DSCR
- 2.69
- GRM
- 4.2
CMA / ARV
- ARV (on-the-fly)
- $120,800
- Comps found
- 9
Show comp detail 9 sales within ~0.75 mi
| Address | Dist | Beds/Ba | Sqft | Sold | Price | $/sf | Match |
|---|---|---|---|---|---|---|---|
| 3210 Santa Maria Way #27 | 0.00mi | 2/2.0 | 800 (0%) | 8mo | $110,000 | $138 | 90 |
| 3210 Santa Maria Way #81 | 0.00mi | 2/2.0 | 800 (0%) | 8mo | $159,000 | $199 | 89 |
| 3210 Santa Maria Way #21 | 0.00mi | 2/2.0 | 840 (+5%) | 1mo | $159,950 | $190 | 87 |
| 3210 Santa Maria Way #19 | 0.00mi | 1/1.0 (-1) | 780 (-2%) | 7mo | $115,000 | $147 | 85 |
| 3210 Santa Maria Way #66 | 0.00mi | 2/1.5 | 769 (-4%) | 12mo | $140,000 | $182 | 82 |
| 3210 Santa Maria Way #10 | 0.00mi | 2/1.0 | 859 (+7%) | 12mo | $120,000 | $140 | 78 |
| 3210 Santa Maria Way #46 | 0.00mi | 2/1.0 | 880 (+10%) | 8mo | $118,500 | $135 | 77 |
| 3210 Santa Maria Way #86 | 0.00mi | 2/1.0 | 860 (+8%) | 14mo | $129,900 | $151 | 76 |
| 3210 Santa Maria Way #90 | 0.00mi | 2/2.0 | 896 (+12%) | 6mo | $180,000 | $201 | 71 |
Match score weights: distance 35% · size 25% · config 20% · recency 20%. Top-matched comps best support the ARV.
Projected returns pro-forma
-3.0% appreciation · 2.23% rent growth · sell at horizon
- IRR
- 33.2%
- Equity multiple
- 2.39×
- Total profit
- $48,483
- Equity at exit
- $18,623
- IRR
- 39.8%
- Equity multiple
- 4.59×
- Total profit
- $125,532
- Equity at exit
- $10,799
Cash invested: $34,972 (down + closing). Projections, not guarantees.
Landlord ↔ Tenant lean methodology
- Overall (STATE)
- 18 Strongly Tenant-Friendly
- State California
- 18 Strongly Tenant-Friendly · D+13
- County
- — inherits STATE
- City
- — inherits STATE
ZIP-level market 93455
- Rents YoY
- 2.2%
- Active inventory
- 124
- Price-to-rent
- 4.2×
Monthly cashflow live
- Estimated rent
- $2,496 high interval (Pro) →
- Mortgage (P&I)
- −$655
- Tax est. 1.5%
- −$156 /mo · $1,874/yr
- Insurance
- −$52
- HOA
- −$0
- Vacancy / Maint / Mgmt
- −$524
- Net cashflow
- $1,109
Break-even live
UW: 25.0% down · 7.5% · 30yr · 1.5% tax · 5.0% vac · 8.0% maint · 8.0% mgmt
Financing live
Cash to close
- Down payment
- $31,225
- Closing costs
- $3,747
- Reserves months
- —
- Total cash needed
- —
Loan-product check · same deal, 3 products live
Conventional
25% down · 7.5% · 30yr
- Down + closing
- —
- Monthly P&I
- —
- Monthly cashflow
- —
- DSCR
- —
- Eligible?
- —
Personal DTI + credit; lowest rate.
DSCR
20% down · 8.5% · 30yr
- Down + closing
- —
- Monthly P&I
- —
- Monthly cashflow
- —
- DSCR
- —
- Eligible?
- —
No personal income docs; deal must DSCR.
Hard money
10% down · 12.0% · 12mo
- Down + closing
- —
- Monthly P&I
- —
- Monthly cashflow
- —
- DSCR
- —
- Eligible?
- —
Short-term bridge; refi at stabilization.
Rent comps 7 comps
| Address | Beds | Baths | Sqft | Rent | $/sqft | DOM | Units | Dist |
|---|---|---|---|---|---|---|---|---|
| 3490 Santa Maria Way Unit 103F Santa Maria, CA | 2.0 | 1.5 | 1000 | $2,200 | $2.20 | 13d | 1 | 0.42mi |
| 3235 Orcutt Rd Orcutt, CA | 2.0–3.0 | 2.0 | 1202 | $2,695 | $2.24 | 13d | 5 | 0.58mi |
| 3519 Mercury Dr Bldg 5 Santa Maria, CA | 1.0 | 1.0 | 619 | $2,395 | $3.87 | 13d | 1 | 0.73mi |
| 504 Playa Blanca Ct Santa Maria, CA | 2.0 | 1.0 | 800 | $2,000 | $2.50 | 13d | 1 | 0.96mi |
| 958 Terrace Ave Santa Maria, CA | 1.0 | 1.0 | 555 | $1,360 | $2.45 | 13d | 1 | 0.98mi |
| 2460 Rubel Way Santa Maria, CA | 2.0–3.0 | 2.0 | 1230 | $2,992 | $2.43 | 13d | 11 | 1.07mi |
| 4036 Cedarhurst Dr Orcutt, CA | 1.0–2.0 | 1.0–2.0 | 781 | $2,648 | $3.39 | 13d | 6 | 1.24mi |
Listing history 10 events
-
2026-06-18days on market $124,900 Active 10 DOM
-
2026-06-17days on market $124,900 Active 9 DOM
-
2026-06-16statusdays on market $124,900 Active 8 DOM
-
2026-06-13statusdays on market $124,900 Pending 7 DOM
-
2026-06-10days on market $124,900 Active 6 DOM
-
2026-06-09days on market $124,900 Active 5 DOM
-
2026-06-08days on market $124,900 Active 4 DOM
-
2026-06-07days on market $124,900 Active 3 DOM
-
2026-06-05remarks 699-char remark
-
2026-06-05$124,900 Active 1 DOM
ⓘ Source: listings_history table (triggers on properties + properties_extension) + one-shot
backfill from property_details.listing_events for pre-trigger history.
Climate risk First Street
- Flood 1/10 Low FEMA zone X (unshaded) · 0% chance over 30 yrs
- Wildfire 4/10 Moderate
- Heat 3/10 Moderate 7 d/yr ≥85°F today · 16 d/yr by 30 yrs out
- Wind 1/10 Low
- Air quality 6/10 Major 8 unhealthy d/yr today · 10 by 30 yrs out
Nearby sold comps map
Loading sold comps map…
Walkable amenities ~0.75 mi
Loading nearby amenities…
Taxation est. · year 1
- Rental income
- $29,950
- − Mortgage interest
- −$6,996
- − Property taxes
- −$1,874
- − Insurance
- −$624
- − Repairs & maintenance
- −$2,396
- − Management
- −$2,396
- − Depreciation
- −$3,633
- Taxable income
- $12,030
- Est. tax owed @ 24.0%
- −$2,887
- After-tax cash flow
- $10,415/yr
For passive investors: Depreciation is non-cash, so a rental often shows a tax loss while cash-flowing — sheltering income. Rental losses are passive: they offset passive income freely, and up to $25,000/yr can offset ordinary (W-2) income if you actively participate and your MAGI is under $100k (phasing out to $0 by $150k); unused losses carry forward. On sale, claimed depreciation is recaptured at up to 25%, and gains may owe capital-gains tax (a 1031 exchange can defer both). Figures are a year-1 estimate at your 24.0% rate — not tax advice; consult a CPA.
Schools (NCES district)
- District
- Orcutt Union Elementary
- NCES district ID
- 0628710
- Math proficiency
- 44% ▼ -1.00%
- Reading proficiency
- 54% ▲ 2.00%
- Median HH income
- $70,564
- Composite
- 45.96/100
- National rank
- #5530
- State rank
- #414 of 1400 in CA
Livability — Orcutt
- Score
- 73/100
- State rank
- #169
- US rank
- #5508
Category grades
Schools grade is shown separately in the Schools card above.
Census & demographics
- Census place
- Orcutt, CA
- County
- Santa Barbara County · 410,380 people
- Metro
- Santa Maria-Santa Barbara, CA
- Population (ZIP)
- 44,611
- Household income
- $110,661
- Rent vs Own
- Severe rent burden
- 765.0
Population outlook (Santa Barbara County) Hauer SSP2
- Today (2025)
- 484,679 people
- By 2030
- 505,323 · +4.3%
- By 2040
- 545,783 · +12.6%
- By 2050
- 584,263 · +20.5%
- By 2075
- 682,586 · +40.8%
- By 2100
- 723,188 · +49.2%
Race, ethnicity, and origin ACS 2023
- Neighborhood character
- Diverse neighborhood (Simpson 0.61)
- Race & ethnicity
- White 47% Hispanic / Latino 41% Two or more races 24% Asian 5% Black 2%
- Hispanic origin (detail)
- Mexican 38%
- Common ancestry
- Lithuanian 2% Russian 2% Italian 2%
- Foreign-born
- 13% · Canada, China, South Korea
- Languages at home
- 73% English-only · Spanish 23% Tagalog/Filipino 2%
Political lean MEDSL · Santa Barbara
- 2024 margin
- Strong D (+26.7) · D 61.8% · R 35.1% · Other 3.1%
- 2008→2024 swing
- +3.8pp toward D · 2008: 22.9pp · 2024: 26.7pp
- All cycles
- 2024: D+26.7 2020: D+32.1 2016: D+28.2 2012: D+17.1 2008: D+22.9
Not yet ingested
- Civics
- —
Market trends
- HPI YoY
- ▼ -729.78%
- Current HPI
- 314.6499
- Rent YoY
- ▲ 2.23%
- Metro
- Santa Maria-Santa Barbara, CA
- State GDP YoY
- ▲ 3.21%
- F500 in state
- 116
Industry mix (Fortune 500 HQ in CA)
| Industry | F500 HQs | Revenue |
|---|---|---|
| Technology | 27 | $1,492B |
|
||
| Financial Services | 3 | $174B |
|
||
| Retail | 3 | $44B |
|
||
| Insurance | 3 | $26B |
|
||
| Media / Entertainment | 2 | $115B |
|
||
| Pharmaceuticals / Biotech | 2 | $62B |
|
||
Price history
1 event — show timeline
- 2026-06-04 Listed $124,900 NSBCRMLS
Cash-flow waterfall
monthlySold comps — $/sqft
last 12 mo · ≤1 miLoading sold comps…