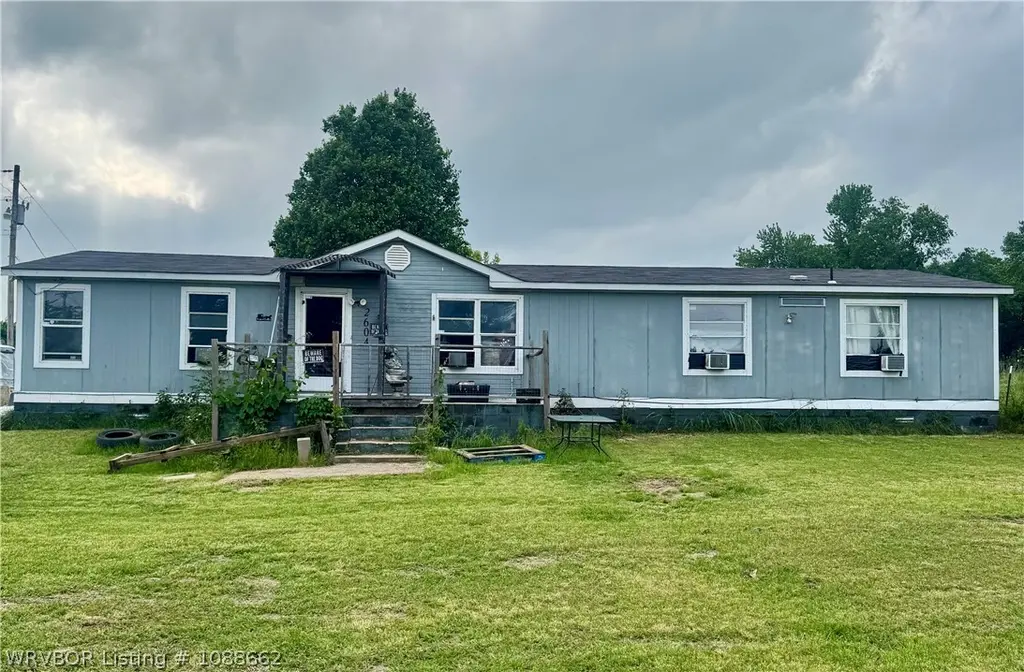
2604 Philadelphia Rd · Cedarville, AR
Flood risk 1/10 · Minimal
- FEMA flood zone
- X (unshaded)
- Chance of flooding over 30 yrs
- 0.0%
- Est. flood insurance / yr
- $507 – $1,088
Fire risk 7/10 · Major
- Est. fire insurance / yr
- $1,499 – $2,785
Heat risk 6/10 · Moderate
- Hot days now (above 109°F)
- 7 days/yr
- Hot days in 30 yrs
- 20 days/yr
Wind risk 2/10 · Minimal
- Chance of severe wind over 30 yrs
- 3.0%
Air-quality risk 2/10 · Minimal
- Unhealthy air days now
- 1 days/yr
- Unhealthy air days in 30 yrs
- 1 days/yr
Risk factors via First Street. Map © Google.
Why this score? — see what drove the C grade
The composite is a weighted blend of 9 inputs, each scored 0–100. Each bar is that input's sub-score; the figure is the points it added to the 100-point composite (weight × sub-score).
- Cash flow +24.1/30.0
- DSCR +7.8/10.0
- ARV discount +7.5/15.0
- 1% rule +4.9/10.0
- Rent growth +3.7/5.0
- Livability +3.2/5.0
- Schools +2.7/10.0
- Condition / age +2.5/5.0
- Appreciation +0.0/10.0
$145,000
🖨 Deal sheet 📄 Offer letter ✓ Due diligence
Listing remarks MLS
Mobile home on 2 cleared and level acres. 30X30 shop with electricity. Mobile home has block concrete foundation with poured piers and tie downs.
Key facts
- Rv parking
- Dining area
- Guest house
Tags
Property features AI
Finance
- Other: Property type: Residential mobile home; Lot size: 2 acres
Exterior
- Parking: Detached garage; 2 covered parking spaces; Gravel parking; RV access/parking
- Security: Smoke detectors
- Utilities: Public water; Septic tank; Electricity available; Cable available
- Home design: Residential mobile home (double wide); One level
- Construction: Frame construction; Block foundation; Asphalt shingle roof; Built as a double-wide mobile home
- Exterior features: Deck; Porch; Partial fencing; Cleared lot; Public maintained road; Storage, workshop, guest house and outbuilding on the property
Interior
- Kitchen: Dishwasher; Disposal; Microwave; Refrigerator; Electric water heater
- Flooring: Carpet; Laminate; Vinyl; Wood
- Bathrooms: 2 full bathrooms
- Heating & cooling: ENERGY STAR qualified heating equipment; Electric cooling; Window unit(s)
- Interior features: Eat-in kitchen; Walk-in closets; Storm windows
- Laundry & utility: Washer hookup; Electric dryer hookup
Neighborhood map
What this means for you Summary
Snapshot
- This is a 4-bed/2.0-bath manufactured listed at $145k.
Deal economics
- At list price, monthly cash flow is $285 ($3k/yr) — positive.
- The deal already cash-flows at list — no discount required.
- To meet the 1% rule (rent ≥ 1% of price), the offer needs to be $143k (1.3% below list).
- Recommended offer: $141k (3.0% below list) — sets the bar for market timing.
Location & tenants
- Location reads 65/100 on livability (#155 in AR) — a middle-class / working-renter tenant base. Strengths: cost of living A+, housing A+, crime A; Watch: employment C-, schools D-, amenities F.
- Cedarville School District (rural): math 32% / reading 32% proficiency, ranked #138 of 238 in AR (top 58%) — families likely to look elsewhere, expect single-tenant / working-renter base with shorter leases; 90% free/reduced lunch — lower-income household profile, screen leases tightly.
- Market conditions: Rents rising fast (+4.8%/yr); 247 active listings in the ZIP; 47 units permitted in Crawford County in 2024 (0 in 5+ unit buildings).
Forward outlook
- Local home prices are declining (-3.0%/yr); year-one equity from $1k of loan paydown is wiped out by about $4k of value loss. Plan a longer hold.
- Crawford County population projected to shrink 7% by 2050 — rents likely to lag national; underwrite the cash flow, not the appreciation.
- At projected returns (-3.0% appreciation + 4.8% rent growth), your $41k cash investment doubles in ~10 years — after that, you're playing with house money.
Negotiation context
- It's been on market 49 days — a 3% lower offer ($141k) is reasonable based on typical stale-listing flexibility.
- 4 sale attempts since 11y ago; this cycle's ask has dropped $19k (12%) from the opening price — seller is motivated, your offer sets the floor, not the list.
- Current owner paid $82k; list at $145k implies a 76% gain — meaningful room to come down on a strong offer.
Risks & watch-outs
- Climate carrying-cost: major wildfire risk; extreme-heat days projected 7→20/yr by 2055 (HVAC capex compounding) — expect insurance premiums to compound above CPI over the hold.
Questions for the listing agent
- It's been on market 49 days. Have you received any prior offers? Is the seller open to a 3% concession, seller financing, or rate buy-down credit?
- Is there a deadline driving the sale (1031 exchange, divorce, estate, relocation)? That informs how much negotiation room exists.
- Schools are D-rated, which usually means shorter tenancies and higher turnover. Who's the typical renter profile here, and what's been the actual vacancy rate?
- What's the average days-on-market for RENTAL listings here right now (not sales)? A rising rental-DOM trend means longer vacancies and softer asking-rent achievability than the comps imply.
- What's the recent tenant-quality profile in this submarket — average credit score on applications, eviction rate, late-payment / NSF rate, and stable-employment percentage? A property-management company in the area should have these aggregated.
- How much new for-sale + rental construction is in the pipeline within 1–3 miles? Heavy new supply typically softens prices + rents 12–24 months out; constrained supply supports both.
Investment metrics
- 1% rule
- 0.99% ✗
- Cap rate
- 8.66%
- Cash-on-cash
- 8.44%
- DSCR
- 1.38
- GRM
- 8.4
CMA / ARV
No comps found within radius.
Projected returns pro-forma
-3.0% appreciation · 4.76% rent growth · sell at horizon
- IRR
- -1.8%
- Equity multiple
- 0.93×
- Total profit
- $-2,809
- Equity at exit
- $21,620
- IRR
- 9.5%
- Equity multiple
- 1.78×
- Total profit
- $31,638
- Equity at exit
- $12,537
Cash invested: $40,600 (down + closing). Projections, not guarantees.
Landlord ↔ Tenant lean methodology
- Overall (STATE)
- 92 Strongly Landlord-Friendly
- State Arkansas
- 92 Strongly Landlord-Friendly · R+14
- County
- — inherits STATE
- City
- — inherits STATE
ZIP-level market 72956
- Rents YoY
- 4.8%
- Active inventory
- 247
- Price-to-rent
- 8.4×
Monthly cashflow live
- Estimated rent
- $1,432 medium interval (Pro) →
- Mortgage (P&I)
- −$760
- Tax from tax record
- −$25 /mo · $299/yr
- Insurance
- −$60
- HOA
- −$0
- Vacancy / Maint / Mgmt
- −$301
- Net cashflow
- $285
Break-even live
UW: 25.0% down · 7.5% · 30yr · 1.5% tax · 5.0% vac · 8.0% maint · 8.0% mgmt
Financing live
Cash to close
- Down payment
- $36,250
- Closing costs
- $4,350
- Reserves months
- —
- Total cash needed
- —
Loan-product check · same deal, 3 products live
Conventional
25% down · 7.5% · 30yr
- Down + closing
- —
- Monthly P&I
- —
- Monthly cashflow
- —
- DSCR
- —
- Eligible?
- —
Personal DTI + credit; lowest rate.
DSCR
20% down · 8.5% · 30yr
- Down + closing
- —
- Monthly P&I
- —
- Monthly cashflow
- —
- DSCR
- —
- Eligible?
- —
No personal income docs; deal must DSCR.
Hard money
10% down · 12.0% · 12mo
- Down + closing
- —
- Monthly P&I
- —
- Monthly cashflow
- —
- DSCR
- —
- Eligible?
- —
Short-term bridge; refi at stabilization.
Listing history 20 events
-
2026-06-15days on market $145,000 Active 49 DOM
-
2026-06-14days on market $145,000 Active 47 DOM
-
2026-06-13pricedays on market $145,000 Active 46 DOM
-
2026-06-10days on market $158,000 Active 44 DOM
-
2026-06-09days on market $158,000 Active 43 DOM
-
2026-06-08days on market $158,000 Active 42 DOM
-
2026-06-07days on market $158,000 Active 41 DOM
-
2026-06-05days on market $158,000 Active 38 DOM
-
2026-06-03days on market $158,000 Active 37 DOM
-
2026-06-02days on market $158,000 Active 36 DOM
-
2026-06-01days on market $158,000 Active 35 DOM
-
2026-05-31days on market $158,000 Active 34 DOM
-
2026-05-30days on market $158,000 Active 33 DOM
-
2026-04-27$164,000 Active 502-char remark
-
2018-07-03soldstatus $82,500
-
2018-07-02soldstatus $82,500 310-char remark
Show marketing remark (310 chars)
Roof and central air 3 years old, all new flooring, paint, fixtures and more. Split floor plan, large open kitchen and dining area. 2 level acres cleared and fenced. 30x30 shop building with electric. Mobile home has block concrete foundation with poured piers and tie downs. School bus picks up at the corner.
-
2018-02-06$89,900 310-char remark
Show marketing remark (310 chars)
Roof and central air 3 years old, all new flooring, paint, fixtures and more. Split floor plan, large open kitchen and dining area. 2 level acres cleared and fenced. 30x30 shop building with electric. Mobile home has block concrete foundation with poured piers and tie downs. School bus picks up at the corner.
-
2015-05-29soldstatus $29,900
-
2015-03-10$29,900
-
2006-08-04soldstatus $75,000
ⓘ Source: listings_history table (triggers on properties + properties_extension) + one-shot
backfill from property_details.listing_events for pre-trigger history.
Tax reassessment forecast AR · Resets to sale price
- Current annual tax
- $299 · $25/mo
- Projected year-2 tax
- $928 · $77/mo
- Expected delta
- +$629/yr (+$52/mo · 210.6%)
ⓘ Screening estimate from a state-policy table — verify with the county assessor before closing.
Climate risk First Street
- Flood 1/10 Low FEMA zone X (unshaded) · 0% chance over 30 yrs
- Wildfire 7/10 Severe
- Heat 6/10 Major 7 d/yr ≥109°F today · 20 d/yr by 30 yrs out
- Wind 2/10 Low 3% chance of damaging wind over 30 yrs
- Air quality 2/10 Low 1 unhealthy d/yr today · 1 by 30 yrs out
Nearby sold comps map
Loading sold comps map…
Walkable amenities ~0.75 mi
Loading nearby amenities…
Taxation est. · year 1
- Rental income
- $17,182
- − Mortgage interest
- −$8,122
- − Property taxes
- −$299
- − Insurance
- −$725
- − Repairs & maintenance
- −$1,375
- − Management
- −$1,375
- − Depreciation
- −$4,218
- Taxable income
- $1,069
- Est. tax owed @ 24.0%
- −$257
- After-tax cash flow
- $3,169/yr
For passive investors: Depreciation is non-cash, so a rental often shows a tax loss while cash-flowing — sheltering income. Rental losses are passive: they offset passive income freely, and up to $25,000/yr can offset ordinary (W-2) income if you actively participate and your MAGI is under $100k (phasing out to $0 by $150k); unused losses carry forward. On sale, claimed depreciation is recaptured at up to 25%, and gains may owe capital-gains tax (a 1031 exchange can defer both). Figures are a year-1 estimate at your 24.0% rate — not tax advice; consult a CPA.
Schools (NCES district)
- District
- Cedarville School District
- NCES district ID
- 0504080
- Math proficiency
- 32% ▼ -14.00%
- Reading proficiency
- 32% ▼ -11.00%
- Median HH income
- $42,106
- Composite
- 27.11/100
- National rank
- #7038
- State rank
- #138 of 238 in AR
Livability — Cedarville
- Score
- 65/100
- State rank
- #155
- US rank
- #13299
Category grades
Schools grade is shown separately in the Schools card above.
Census & demographics
- County
- Crawford County · 34,546 people
- City population
- 1,804
- Metro
- Fort Smith, AR-OK
- Population (ZIP)
- 34,546
- Household income
- $62,988
- Rent vs Own
- Severe rent burden
- 571.0
Population outlook (Crawford County) Hauer SSP2
- Today (2025)
- 62,108 people
- By 2030
- 61,519 · -0.9%
- By 2040
- 59,735 · -3.8%
- By 2050
- 57,521 · -7.4%
- By 2075
- 53,143 · -14.4%
- By 2100
- 49,596 · -20.1%
Race, ethnicity, and origin ACS 2023
- Neighborhood character
- Predominantly White (76%)
- Race & ethnicity
- White 76% Hispanic / Latino 12% Two or more races 11% Asian 2% Native American 1% Black 1%
- Hispanic origin (detail)
- Mexican 5%
- Common ancestry
- Lithuanian 1% Slovak 1% Romanian 1%
- Foreign-born
- 6% · Canada
- Languages at home
- 89% English-only · Spanish 10%
Political lean MEDSL · Crawford
- 2024 margin
- Solid R (+58.2) · D 19.9% · R 78.1% · Other 2.0%
- 2008→2024 swing
- -12.1pp toward R · 2008: -46.0pp · 2024: -58.2pp
- All cycles
- 2024: R+58.2 2020: R+56.7 2016: R+55.0 2012: R+49.9 2008: R+46.0
Not yet ingested
- Civics
- —
Market trends
- HPI YoY
- ▼ -156.05%
- Current HPI
- 221.3066
- Rent YoY
- ▲ 4.76%
- Metro
- Fort Smith, AR-OK
- State GDP YoY
- ▲ 3.80%
- F500 in state
- 10
Industry mix (Fortune 500 HQ in AR)
| Industry | F500 HQs | Revenue |
|---|---|---|
| Retail | 1 | $681B |
|
||
| Food / Agriculture | 1 | $53B |
|
||
| Retail / Energy | 1 | $22B |
|
||
| Transportation / Logistics | 1 | $12B |
|
||
| Energy | 1 | $4B |
|
||
Price history
+93.3% since first listed11 events — show timeline
- 2026-06-11 Price Changed $145,000 WRVBOR
- 2026-05-28 Price Changed $158,000 WRVBOR
- 2026-04-27 Listed $164,000 WRVBOR
- 2018-07-06 Sold (MLS) $82,500 Batesville
- 2018-07-03 Sold (Public Records) $82,500 Public Records
- 2018-07-02 Sold (MLS) $82,500 WRVBOR
- 2018-06-11 Listed $89,900 Batesville
- 2018-02-06 Listed $89,900 WRVBOR
- 2015-05-29 Sold (MLS) $29,900 WRVBOR
- 2015-03-10 Listed $29,900 WRVBOR
- 2006-08-04 Sold (Public Records) $75,000 Public Records
Cash-flow waterfall
monthlySold comps — $/sqft
last 12 mo · ≤1 miLoading sold comps…