 6-Plex
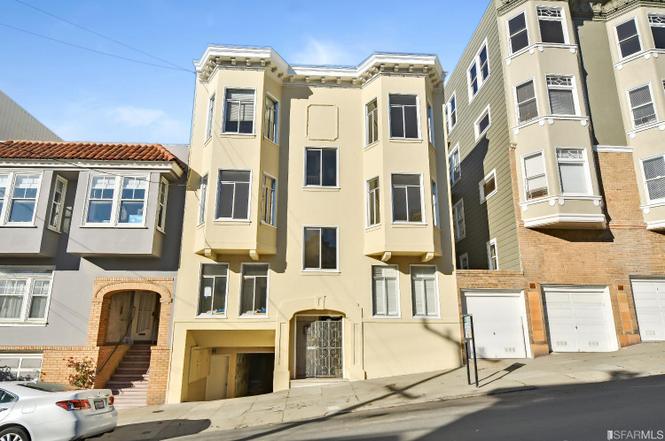
1316-1326 Vallejo St · San Francisco, CA
Flood risk 1/10 · Minimal
- FEMA flood zone
- X (unshaded)
- Chance of flooding over 30 yrs
- 0.0%
- Est. flood insurance / yr
- $507 – $1,088
Fire risk 1/10 · Minimal
- Est. fire insurance / yr
- $659 – $1,223
Heat risk 2/10 · Minimal
- Hot days now (above 79°F)
- 7 days/yr
- Hot days in 30 yrs
- 16 days/yr
Wind risk 1/10 · Minimal
- Chance of severe wind over 30 yrs
- —
Air-quality risk 8/10 · Major
- Unhealthy air days now
- 15 days/yr
- Unhealthy air days in 30 yrs
- 15 days/yr
Risk factors via First Street. Map © Google.
Why this score? — see what drove the D+ grade
The composite is a weighted blend of 9 inputs, each scored 0–100. Each bar is that input's sub-score; the figure is the points it added to the 100-point composite (weight × sub-score).
- Cash flow +13.6/30.0
- Appreciation +7.5/10.0
- Rent growth +5.0/5.0
- Schools +5.0/10.0
- DSCR +4.1/10.0
- 1% rule +3.8/10.0
- Livability +3.8/5.0
- Condition / age +2.5/5.0
- ARV discount +0.0/15.0
$3,700,000
🖨 Deal sheet 📄 Offer letter ✓ Due diligence
Multi-family units
County records classify this as Multi-Family (5+ Unit). Listing-text estimate: 6 units. confirmed
5+ unit building — per-unit beds/baths from public records are typically unavailable; the breakdown below (if shown) is an estimate from the listing text.
Listing remarks
Almost entirely vacant 6 units with garage; Sirkin Law tic & CA Dre approved to sell individual units or rent. Prime Russian Hill Classic Edwardian, semi detached 6 unit apartment bldg. , with partial city views on top units. All units have 4 rooms that rents as 2 bedrooms; High Ceilings throughout; Coved Ceilings in the bedrooms; the Living room is next to Large Dine-In Kitchen with original built in cabinets in both rooms; there are period details, original crown moldings, coved ceilings, fireplaces & hardwood floors. Separately metered PG & E with in unit wall heaters & 6 separate water heaters down in the garage/basement; not on soft story list. The interior back s
Key facts
- Period details
- Coved ceilings
- Hardwood floors
Tags
Property features AI
Finance
- Financial info: Multi-family: 6 total units (5 currently vacant), units not furnished
- HOA & community: No association fee
Exterior
- Parking: Attached garage with garage door opener and inside entrance; 5 parking spaces total
- Security: Fire alarm; Security gate; Smoke detectors
- Utilities: Gas on separate meter; Electric on separate meter
- Home design: Residential income property (multi-family, 5+ units); One building; Edwardian style
- Construction: Built in 1908; Stucco construction; Asphalt roof; Capped brick and concrete perimeter foundation
- Exterior features: Enclosed patio
Interior
- Kitchen: Free-standing refrigerator; Microwave
- Bedrooms: 12 bedrooms total
- Flooring: Wood floors
- Heating & cooling: Baseboard heating; Gas heating; Wall furnace
- Interior features: Built-in storage; Fireplace(s)
Neighborhood map
What this means for you Summary
Snapshot
- This is a 6 × 2-bed/?-bath units multifamily listed at $3.70M.
Deal economics
- At list price, monthly cash flow is $188 ($2k/yr) — positive. Per door: $31/mo.
- The deal already cash-flows at list — no discount required.
- To meet the 1% rule (rent ≥ 1% of price), the offer needs to be $3.26M (11.9% below list).
- Recommended offer: $3.26M (12.0% below list) — sets the bar for market timing.
- Cap rate 6.4% vs local median 2.1% in San Francisco — top-decile yield for the area; either an underpriced asset or a hidden risk that comps aren't pricing in. Stress-test before assuming the spread holds.
Location & tenants
- Location reads 76/100 on livability (#90 in CA, #3,143 nationally) — a middle-class / working-renter tenant base. Strengths: amenities A+, commute A+, employment A+; Watch: crime F, cost of living F.
- San Francisco Unified (urban): math 50% / reading 56% proficiency, ranked #322 of 1,400 in CA (top 23%) — acceptable for families but not a draw, mixed tenant base, ~2y average lease.
- Market conditions: Rents rising fast (+15.6%/yr); 155 active listings in the ZIP; solid renter incomes; 750 units permitted in San Francisco County in 2024 (688 in 5+ unit buildings).
- At $32,605/mo this rent would consume 369% of the median local household income ($106k/yr) (locally 5272% of renters already pay >50% of income on rent) — very limited rent-growth headroom before tenants either downsize or default.
Forward outlook
- In year one you build about $211k of equity ($26k loan paydown + $186k appreciation (5.0% local appreciation)).
- San Francisco County population projected at +39% by 2050 — long-run rental-demand tailwind backs the buy-and-hold thesis.
- At projected returns (5.0% appreciation + 8.0% rent growth), your $1.04M cash investment doubles in ~4 years — after that, you're playing with house money.
- By year 2, paydown + projected appreciation supports a ~$339k cash-out refi (75% LTV) — recoverable capital for the next deal without selling this one.
Negotiation context
- It's been on market 224 days — a 12% lower offer ($3.26M) is reasonable based on typical stale-listing flexibility.
- 6 sale attempts since 6y ago with the ask held roughly flat each time — persistent listings suggest the price (not the market) is what's stuck; bring a comps-based counter.
Risks & watch-outs
- Watch-outs: built in 1908 — expect roof / HVAC / electrical / plumbing capex.
Questions for the listing agent
- It's been on market 224 days. Have you received any prior offers? Is the seller open to a 12% concession, seller financing, or rate buy-down credit?
- Can we see the unit-by-unit rent roll, current vacancy, and any below-market leases? What's the average tenancy length?
- What capital expenditures (roof, boiler, parking lot, exteriors) have been made in the last 5 years, and what's planned in the next 2?
- Built in 1908 — when were the roof, HVAC, electrical panel, plumbing, and water heater last replaced?
- Why hasn't it sold? Are there any deal-killer items the seller is aware of (foundation, flood, title, zoning, code violations)?
- Is there a deadline driving the sale (1031 exchange, divorce, estate, relocation)? That informs how much negotiation room exists.
- Schools are B-rated — typically a magnet for longer-tenancy family renters. What's the average tenant stay here, and is there a school-zone premium baked into asking?
- Crime grade is F in this area — have there been break-ins, vandalism, or insurance claims at this property in the last 3 years? What carrier currently insures it and at what premium?
- The area grade is low — what's the realistic commute time and amenity access for the typical tenant pool here? Any planned neighborhood developments (good or bad) we should know about?
- What's the average days-on-market for RENTAL listings here right now (not sales)? A rising rental-DOM trend means longer vacancies and softer asking-rent achievability than the comps imply.
- What's the recent tenant-quality profile in this submarket — average credit score on applications, eviction rate, late-payment / NSF rate, and stable-employment percentage? A property-management company in the area should have these aggregated.
- How much new apartment / multifamily construction is in the pipeline within 1–3 miles? Heavy new supply (>2% of stock underway) typically softens rents 12–24 months out; light construction supports rent growth.
Investment metrics
- 1% rule
- 0.88% ✗
- Cap rate
- 6.35%
- Cash-on-cash
- 0.22%
- DSCR
- 1.01
- GRM
- 9.5
CMA / ARV
- ARV (on-the-fly)
- $2,579,616
- Comps found
- 8
Show comp detail 8 sales within ~0.75 mi
| Address | Dist | Beds/Ba | Sqft | Sold | Price | $/sf | Match |
|---|---|---|---|---|---|---|---|
| 30 Bernard St | 0.28mi | 12/— | 4,950 (-3%) | 15mo | $2,100,000 | $424 | 70 |
| 1375 Sacramento St | 0.43mi | 11/— (-1) | 5,194 (+2%) | 6mo | $2,900,000 | $558 | 67 |
| 2128-2132 Larkin St | 0.05mi | 12/3.0 | 5,505 (+8%) | 20mo | $2,400,000 | $436 | 55 |
| 857-863 Lombard St | 0.38mi | 12/— | 5,400 (+6%) | 24mo | $3,150,000 | $583 | 52 |
| 122-132 Jasper Pl | 0.64mi | 12/— | 5,016 (-1%) | 20mo | $1,400,000 | $279 | 51 |
| 1730 Filbert St | 0.50mi | 11/— (-1) | 5,810 (+14%) | 1mo | $3,800,000 | $654 | 47 |
| 1329-1333 Powell St | 0.48mi | 12/7.0 | 4,372 (-14%) | 22mo | $1,575,000 | $360 | 32 |
| 761 Pine St | 0.74mi | 13/4.0 (+1) | 4,338 (-15%) | 8mo | $2,200,000 | $507 | 21 |
Match score weights: distance 35% · size 25% · config 20% · recency 20%. Top-matched comps best support the ARV.
Projected returns pro-forma
5.02% appreciation · 8.0% rent growth · sell at horizon
- IRR
- 15.4%
- Equity multiple
- 2.01×
- Total profit
- $1,042,083
- Equity at exit
- $2,101,535
- IRR
- 18.0%
- Equity multiple
- 4.43×
- Total profit
- $3,552,857
- Equity at exit
- $3,630,931
Cash invested: $1,036,000 (down + closing). Projections, not guarantees.
Landlord ↔ Tenant lean methodology
- Overall (CITY)
- 0 Strongly Tenant-Friendly
- State California
- 18 Strongly Tenant-Friendly · D+13
- County
- — inherits STATE
- City San Francisco
- 0 Strongly Tenant-Friendly · D+57
ZIP-level market 94109
- Home prices YoY
- 2.9%
- Rents YoY
- 15.6%
- Active inventory
- 155
- Price-to-rent
- 56.7×
Monthly cashflow live
- Estimated rent
- $32,605 high interval (Pro) →
- Mortgage (P&I)
- −$19,403
- Tax est. 1.5%
- −$4,625 /mo · $55,500/yr
- Insurance
- −$1,542
- HOA
- −$0
- Vacancy / Maint / Mgmt
- −$6,847
- Net cashflow
- $188
Break-even live
6-unit breakdown (identical units grouped — click to expand)
| Units | Beds | Baths | Est. rent |
|---|---|---|---|
| 6× units | 2 | — | $32,604 |
| #1 | 2 | — | $5,434 |
| #2 | 2 | — | $5,434 |
| #3 | 2 | — | $5,434 |
| #4 | 2 | — | $5,434 |
| #5 | 2 | — | $5,434 |
| #6 | 2 | — | $5,434 |
| Total (6 units) | $32,605 | ||
UW: 25.0% down · 7.5% · 30yr · 1.5% tax · 5.0% vac · 8.0% maint · 8.0% mgmt
Financing live
Cash to close
- Down payment
- $925,000
- Closing costs
- $111,000
- Reserves months
- —
- Total cash needed
- —
Loan-product check · same deal, 3 products live
Conventional
25% down · 7.5% · 30yr
- Down + closing
- —
- Monthly P&I
- —
- Monthly cashflow
- —
- DSCR
- —
- Eligible?
- —
Personal DTI + credit; lowest rate.
DSCR
20% down · 8.5% · 30yr
- Down + closing
- —
- Monthly P&I
- —
- Monthly cashflow
- —
- DSCR
- —
- Eligible?
- —
No personal income docs; deal must DSCR.
Hard money
10% down · 12.0% · 12mo
- Down + closing
- —
- Monthly P&I
- —
- Monthly cashflow
- —
- DSCR
- —
- Eligible?
- —
Short-term bridge; refi at stabilization.
Listing history 5 events
-
2026-06-18days on market $3,700,000 Active 224 DOM
-
2026-06-17days on market $3,700,000 Active 223 DOM
-
2026-06-16days on market $3,700,000 Active 222 DOM
-
2026-06-15remarks 683-char remark
-
2026-06-15$3,700,000 Active 221 DOM
ⓘ Source: listings_history table (triggers on properties + properties_extension) + one-shot
backfill from property_details.listing_events for pre-trigger history.
Climate risk First Street
- Flood 1/10 Low FEMA zone X (unshaded) · 0% chance over 30 yrs
- Wildfire 1/10 Low
- Heat 2/10 Low 7 d/yr ≥79°F today · 16 d/yr by 30 yrs out
- Wind 1/10 Low
- Air quality 8/10 Severe 15 unhealthy d/yr today · 15 by 30 yrs out
Nearby sold comps map
Loading sold comps map…
Walkable amenities ~0.75 mi
Loading nearby amenities…
Taxation est. · year 1
- Rental income
- $391,260
- − Mortgage interest
- −$207,258
- − Property taxes
- −$55,500
- − Insurance
- −$18,500
- − Repairs & maintenance
- −$31,301
- − Management
- −$31,301
- − Depreciation
- −$107,636
- Taxable loss
- −$60,235
- Est. tax savings @ 24.0%
- +$14,457
- After-tax cash flow
- $16,713/yr
For passive investors: Depreciation is non-cash, so a rental often shows a tax loss while cash-flowing — sheltering income. Rental losses are passive: they offset passive income freely, and up to $25,000/yr can offset ordinary (W-2) income if you actively participate and your MAGI is under $100k (phasing out to $0 by $150k); unused losses carry forward. On sale, claimed depreciation is recaptured at up to 25%, and gains may owe capital-gains tax (a 1031 exchange can defer both). Figures are a year-1 estimate at your 24.0% rate — not tax advice; consult a CPA.
Schools (NCES district)
- District
- San Francisco Unified
- NCES district ID
- 0634410
- Math proficiency
- 50% ▬ 0.00%
- Reading proficiency
- 56% ▲ 1.00%
- Median HH income
- $81,249
- Composite
- 50.14/100
- National rank
- #4088
- State rank
- #322 of 1400 in CA
Livability — San Francisco
- Score
- 76/100
- State rank
- #90
- US rank
- #3143
Category grades
Schools grade is shown separately in the Schools card above.
Census & demographics
- Census place
- San Francisco, CA
- County
- San Francisco County · 827,552 people
- City population
- 827,552
- Metro
- San Francisco-Oakland-Berkeley, CA
- Population (ZIP)
- 54,553
- Household income
- $106,018
- Rent vs Own
- Severe rent burden
- 5272.0
Population outlook (San Francisco County) Hauer SSP2
- Today (2025)
- 1,030,936 people
- By 2030
- 1,110,409 · +7.7%
- By 2040
- 1,270,010 · +23.2%
- By 2050
- 1,435,001 · +39.2%
- By 2075
- 1,779,074 · +72.6%
- By 2100
- 1,966,767 · +90.8%
Race, ethnicity, and origin ACS 2023
- Neighborhood character
- Diverse neighborhood (Simpson 0.66)
- Race & ethnicity
- White 50% Asian 27% Hispanic / Latino 13% Two or more races 10% Black 4%
- Hispanic origin (detail)
- Mexican 7% Puerto Rican 1%
- Common ancestry
- Lithuanian 3% Italian 3% Romanian 2%
- Foreign-born
- 31% · China, Canada, Vietnam
- Languages at home
- 64% English-only · Chinese 10% Spanish 7% Other Asian/Pacific 4%
Political lean MEDSL · San Francisco
- 2024 margin
- Solid D (+64.8) · D 80.3% · R 15.5% · Other 4.1%
- 2008→2024 swing
- -5.7pp toward R · 2008: 70.5pp · 2024: 64.8pp
- All cycles
- 2024: D+64.8 2020: D+72.5 2016: D+76.1 2012: D+70.2 2008: D+70.5
Not yet ingested
- Civics
- —
Market trends
- HPI YoY
- ▲ 5.02%
- Current HPI
- 175.8886
- Rent YoY
- ▲ 15.60%
- Metro
- San Francisco-Oakland-Berkeley, CA
- State GDP YoY
- ▲ 3.21%
- F500 in state
- 116
Industry mix (Fortune 500 HQ in CA)
| Industry | F500 HQs | Revenue |
|---|---|---|
| Technology | 27 | $1,492B |
|
||
| Financial Services | 3 | $174B |
|
||
| Retail | 3 | $44B |
|
||
| Insurance | 3 | $26B |
|
||
| Media / Entertainment | 2 | $115B |
|
||
| Pharmaceuticals / Biotech | 2 | $62B |
|
||
Price history
-4.8% since first listed9 events — show timeline
- 2025-12-16 Relisted — San Francisco MLS
- 2025-11-06 Listed $3,700,000 San Francisco MLS
- 2024-12-01 Listed $699,000 San Francisco MLS
- 2020-09-17 Relisted — San Francisco MLS
- 2020-09-16 Delisted — San Francisco MLS
- 2020-08-31 Relisted — San Francisco MLS
- 2020-08-07 Price Changed $3,500,000 San Francisco MLS
- 2020-07-15 Price Changed $3,800,000 San Francisco MLS
- 2020-06-15 Listed $3,888,000 San Francisco MLS
Property tax history
+2.7%/yrLatest (2025): $3,907 · +3.2% YoY. Source: county tax records.
Cash-flow waterfall
monthlySold comps — $/sqft
last 12 mo · ≤1 miLoading sold comps…