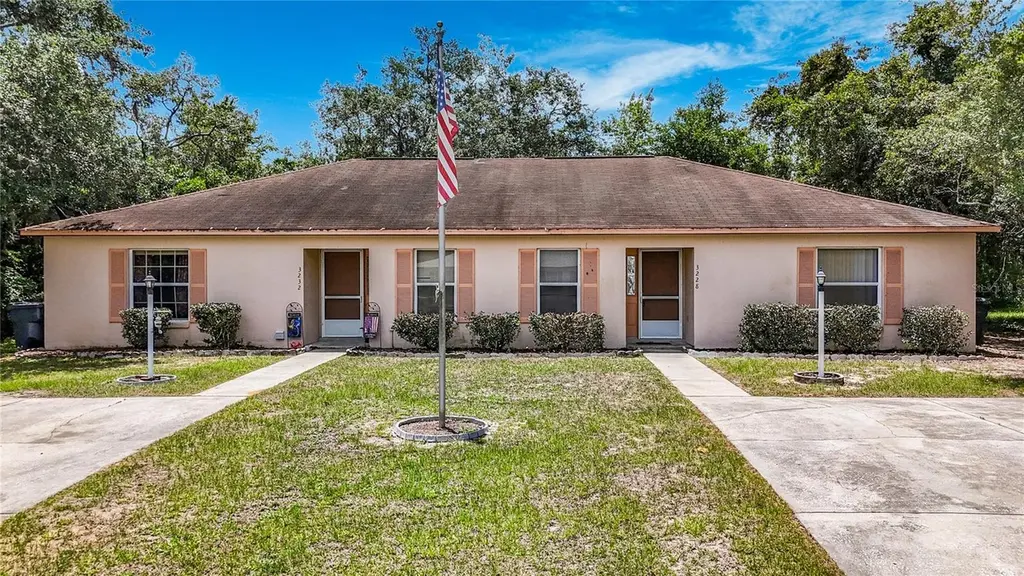
 Duplex
3228 Courtney Dr · Lake Wales, FL
Flood risk 1/10 · Minimal
- FEMA flood zone
- X (unshaded)
- Chance of flooding over 30 yrs
- 0.0%
- Est. flood insurance / yr
- $507 – $1,088
Fire risk 5/10 · Moderate
- Est. fire insurance / yr
- $947 – $1,759
Heat risk 8/10 · Major
- Hot days now (above 108°F)
- 6 days/yr
- Hot days in 30 yrs
- 18 days/yr
Wind risk 9/10 · Severe
- Chance of severe wind over 30 yrs
- 99.0%
Air-quality risk 1/10 · Minimal
- Unhealthy air days now
- 0 days/yr
- Unhealthy air days in 30 yrs
- 0 days/yr
Risk factors via First Street. Map © Google.
Why this score? — see what drove the D+ grade
The composite is a weighted blend of 9 inputs, each scored 0–100. Each bar is that input's sub-score; the figure is the points it added to the 100-point composite (weight × sub-score).
- Cash flow +17.7/30.0
- ARV discount +7.5/15.0
- DSCR +5.5/10.0
- 1% rule +4.9/10.0
- Schools +3.5/10.0
- Livability +3.4/5.0
- Rent growth +2.5/5.0
- Condition / age +2.5/5.0
- Appreciation +0.0/10.0
$299,000
🖨 Deal sheet 📄 Offer letter ✓ Due diligence
Multi-family units
County records classify this as Multi-Family (2-4 Unit). Listing-text estimate: 2 units. confirmed
Listing remarks MLS
In beautiful wooded Arborwood. Gorgeous duplex in great condition.
Key facts
- Screened in terrace
- Private backyard
- Quiet private street
Tags
Property features AI
Finance
- Other: Property type: Residential Income (multifamily); Two units total; Unit mix: three 2-bedroom units (one listed as 1 unit, another as 2 units in unit-type entries) — total 3 rentable units; Total number of buildings: 1
- Financial info: Total annual HOA/association fees approximately $1,104; Annual net income reported as 0.00 (multifamily listing)
- HOA & community: Monthly association fee of $92 (association required); Pets allowed
Exterior
- Utilities: Public water; Septic tank; Cable available; Electricity available; Sewer connected; Water connected
- Home design: Residential income property; Duplex (two-unit building, one building total); Lot roughly 0.51 acre; Paved road access
- Construction: Block, concrete and stucco construction; Shingle roof; Slab foundation; Built with a total living area of approximately 2046 (owner provided)
- Exterior features: Rain gutters; Exterior storage
Interior
- Bedrooms: 6 total bedrooms; Unit breakdown: three 2-bedroom units (one 2‑bed unit and two 2‑bed units)
- Bathrooms: Each unit has 2 bathrooms
- Heating & cooling: Central heating; Central air
- Interior features: Ceiling fans; Living room/dining room combo; Open floorplan; Thermostat; Walk-in closets; Window treatments
- Laundry & utility: Laundry closet
Neighborhood map
What this means for you Summary
Snapshot
- This is a 2 × 2-bed/2.0-bath units multifamily listed at $299k.
Deal economics
- At list price, monthly cash flow is $238 ($3k/yr) — positive. Per door: $119/mo.
- The deal already cash-flows at list — no discount required.
- To meet the 1% rule (rent ≥ 1% of price), the offer needs to be $297k (0.7% below list).
- Recommended offer: $295k (1.5% below list) — sets the bar for market timing.
Location & tenants
- Location reads 68/100 on livability (#535 in FL) — a middle-class / working-renter tenant base. Strengths: cost of living A+, housing A+; Watch: employment D+, schools D, amenities F.
- Polk (suburban): math 39% / reading 43% proficiency, ranked #62 of 73 in FL (top 85%) — families likely to look elsewhere, expect single-tenant / working-renter base with shorter leases.
- Market conditions: 500 active listings in the ZIP; 10,384 units permitted in Polk County in 2024 (1,716 in 5+ unit buildings).
- At $2,969/mo this rent would consume 62% of the median local household income ($57k/yr) (locally 148% of renters already pay >50% of income on rent) — very limited rent-growth headroom before tenants either downsize or default.
Forward outlook
- Local home prices are declining (-3.0%/yr); year-one equity from $2k of loan paydown is wiped out by about $9k of value loss. Plan a longer hold.
- Polk County population projected at +33% by 2050 — long-run rental-demand tailwind backs the buy-and-hold thesis.
Negotiation context
- It's been on market 28 days — a 2% lower offer ($295k) is reasonable based on typical stale-listing flexibility.
- 6 sale attempts since 9y ago; this cycle's ask has dropped $46k (13%) from the opening price — seller is motivated, your offer sets the floor, not the list.
- Current owner paid $140k; list at $299k implies a 114% gain — meaningful room to come down on a strong offer.
Risks & watch-outs
- Climate carrying-cost: severe wind risk, 99% chance of damaging wind over 30y; moderate wildfire risk; extreme-heat days projected 6→18/yr by 2055 (HVAC capex compounding) — expect insurance premiums to compound above CPI over the hold.
Questions for the listing agent
- Can we see the unit-by-unit rent roll, current vacancy, and any below-market leases? What's the average tenancy length?
- What capital expenditures (roof, boiler, parking lot, exteriors) have been made in the last 5 years, and what's planned in the next 2?
- What does the HOA fee cover, when was the last increase, and are there any pending special assessments or reserve-fund shortfalls?
- Is there a deadline driving the sale (1031 exchange, divorce, estate, relocation)? That informs how much negotiation room exists.
- Schools are D-rated, which usually means shorter tenancies and higher turnover. Who's the typical renter profile here, and what's been the actual vacancy rate?
- The area grade is low — what's the realistic commute time and amenity access for the typical tenant pool here? Any planned neighborhood developments (good or bad) we should know about?
- What's the average days-on-market for RENTAL listings here right now (not sales)? A rising rental-DOM trend means longer vacancies and softer asking-rent achievability than the comps imply.
- What's the recent tenant-quality profile in this submarket — average credit score on applications, eviction rate, late-payment / NSF rate, and stable-employment percentage? A property-management company in the area should have these aggregated.
- How much new apartment / multifamily construction is in the pipeline within 1–3 miles? Heavy new supply (>2% of stock underway) typically softens rents 12–24 months out; light construction supports rent growth.
Investment metrics
- 1% rule
- 0.99% ✗
- Cap rate
- 7.25%
- Cash-on-cash
- 3.42%
- DSCR
- 1.15
- GRM
- 8.4
CMA / ARV
No comps found within radius.
Projected returns pro-forma
-3.0% appreciation · 3.0% rent growth · sell at horizon
- IRR
- -10.9%
- Equity multiple
- 0.60×
- Total profit
- $-33,205
- Equity at exit
- $44,582
- IRR
- -1.6%
- Equity multiple
- 0.89×
- Total profit
- $-9,089
- Equity at exit
- $25,852
Cash invested: $83,720 (down + closing). Projections, not guarantees.
Landlord ↔ Tenant lean methodology
- Overall (STATE)
- 87 Strongly Landlord-Friendly
- State Florida
- 87 Strongly Landlord-Friendly · R+3
- County
- — inherits STATE
- City
- — inherits STATE
ZIP-level market 33898
- Home prices YoY
- -15.1%
- Active inventory
- 500
- Price-to-rent
- 16.8×
Monthly cashflow live
- Estimated rent
- $2,969 medium interval (Pro) →
- Mortgage (P&I)
- −$1,568
- Tax from tax record
- −$323 /mo · $3,872/yr
- Insurance
- −$125
- HOA
- −$92
- Vacancy / Maint / Mgmt
- −$623
- Net cashflow
- $238
Break-even live
2-unit breakdown (identical units grouped — click to expand)
| Units | Beds | Baths | Est. rent |
|---|---|---|---|
| 2× units | 2 | 2 | $2,968 |
| #1 | 2 | 2 | $1,484 |
| #2 | 2 | 2 | $1,484 |
| Total (2 units) | $2,969 | ||
UW: 25.0% down · 7.5% · 30yr · 1.5% tax · 5.0% vac · 8.0% maint · 8.0% mgmt
Financing live
Cash to close
- Down payment
- $74,750
- Closing costs
- $8,970
- Reserves months
- —
- Total cash needed
- —
Loan-product check · same deal, 3 products live
Conventional
25% down · 7.5% · 30yr
- Down + closing
- —
- Monthly P&I
- —
- Monthly cashflow
- —
- DSCR
- —
- Eligible?
- —
Personal DTI + credit; lowest rate.
DSCR
20% down · 8.5% · 30yr
- Down + closing
- —
- Monthly P&I
- —
- Monthly cashflow
- —
- DSCR
- —
- Eligible?
- —
No personal income docs; deal must DSCR.
Hard money
10% down · 12.0% · 12mo
- Down + closing
- —
- Monthly P&I
- —
- Monthly cashflow
- —
- DSCR
- —
- Eligible?
- —
Short-term bridge; refi at stabilization.
HOA detail
- Monthly dues
- $92 · $1,104/yr
Listing history 32 events
-
2026-06-18days on market $299,000 Active 28 DOM
-
2026-06-17days on market $299,000 Active 27 DOM
-
2026-06-16days on market $299,000 Active 26 DOM
-
2026-06-15days on market $299,000 Active 25 DOM
-
2026-06-13pricedays on market $299,000 Active 23 DOM
-
2026-06-10days on market $319,000 Active 20 DOM
-
2026-06-09days on market $319,000 Active 19 DOM
-
2026-06-08days on market $319,000 Active 18 DOM
-
2026-06-07days on market $319,000 Active 17 DOM
-
2026-06-05days on market $319,000 Active 14 DOM
-
2026-06-03days on market $319,000 Active 13 DOM
-
2026-06-03days on market $319,000 Active 12 DOM
-
2026-06-01days on market $319,000 Active 11 DOM
-
2026-06-01price $319,000 Active 10 DOM
-
2026-05-31days on market $345,000 Active 10 DOM
-
2026-05-21$345,000 Active
-
2026-05-21historical $1,350
-
2026-05-06$1,350
-
2025-03-06historical $1,300
-
2025-02-20$1,300
-
2025-02-20historical $1,300
-
2025-02-12$1,300
-
2023-12-29historical $1,300
-
2023-12-19price $1,300
-
2023-11-07$1,450
-
2017-12-08soldstatus $140,000
-
2017-12-06soldstatus $140,000 Sold 66-char remark
Show marketing remark (66 chars)
In beautiful wooded Arborwood. Gorgeous duplex in great condition.
-
2017-10-06status Pending 66-char remark
Show marketing remark (66 chars)
In beautiful wooded Arborwood. Gorgeous duplex in great condition.
-
2017-08-22$140,000 Active 66-char remark
Show marketing remark (66 chars)
In beautiful wooded Arborwood. Gorgeous duplex in great condition.
-
2005-03-09soldstatus $124,900
-
1996-05-13soldstatus $400,000
-
1996-05-13soldstatus $400,000
ⓘ Source: listings_history table (triggers on properties + properties_extension) + one-shot
backfill from property_details.listing_events for pre-trigger history.
Tax reassessment forecast FL · Resets to sale price
- Current annual tax
- $3,872 · $323/mo
- Projected year-2 tax
- $3,872 · $323/mo
- Expected delta
- $0/yr ($0/mo · 0.0%)
ⓘ Screening estimate from a state-policy table — verify with the county assessor before closing.
Climate risk First Street
- Flood 1/10 Low FEMA zone X (unshaded) · 0% chance over 30 yrs
- Wildfire 5/10 Major
- Heat 8/10 Severe 6 d/yr ≥108°F today · 18 d/yr by 30 yrs out
- Wind 9/10 Extreme 99% chance of damaging wind over 30 yrs
- Air quality 1/10 Low 0 unhealthy d/yr today · 0 by 30 yrs out
Nearby sold comps map
Loading sold comps map…
Walkable amenities ~0.75 mi
Loading nearby amenities…
Taxation est. · year 1
- Rental income
- $35,628
- − Mortgage interest
- −$16,749
- − Property taxes
- −$3,872
- − Insurance
- −$1,495
- − Repairs & maintenance
- −$2,850
- − Management
- −$2,850
- − HOA
- −$1,104
- − Depreciation
- −$8,698
- Taxable loss
- −$1,990
- Est. tax savings @ 24.0%
- +$478
- After-tax cash flow
- $3,337/yr
For passive investors: Depreciation is non-cash, so a rental often shows a tax loss while cash-flowing — sheltering income. Rental losses are passive: they offset passive income freely, and up to $25,000/yr can offset ordinary (W-2) income if you actively participate and your MAGI is under $100k (phasing out to $0 by $150k); unused losses carry forward. On sale, claimed depreciation is recaptured at up to 25%, and gains may owe capital-gains tax (a 1031 exchange can defer both). Figures are a year-1 estimate at your 24.0% rate — not tax advice; consult a CPA.
Schools (NCES district)
- District
- Polk
- NCES district ID
- 1201590
- Math proficiency
- 39% ▼ -11.00%
- Reading proficiency
- 43% ▼ -4.00%
- Median HH income
- $43,979
- Composite
- 34.74/100
- National rank
- #5132
- State rank
- #62 of 73 in FL
Livability — Lake Wales
- Score
- 68/100
- State rank
- #535
- US rank
- #10036
Category grades
Schools grade is shown separately in the Schools card above.
Census & demographics
- County
- Polk County · 740,051 people
- City population
- 30,351
- Metro
- Lakeland-Winter Haven, FL
- Population (ZIP)
- 18,527
- Household income
- $57,224
- Rent vs Own
- Severe rent burden
- 148.0
Population outlook (Polk County) Hauer SSP2
- Today (2025)
- 752,975 people
- By 2030
- 804,621 · +6.9%
- By 2040
- 906,117 · +20.3%
- By 2050
- 1,000,476 · +32.9%
- By 2075
- 1,197,520 · +59.0%
- By 2100
- 1,271,518 · +68.9%
Race, ethnicity, and origin ACS 2023
- Neighborhood character
- Predominantly White (74%)
- Race & ethnicity
- White 74% Hispanic / Latino 17% Two or more races 10% Black 6%
- Hispanic origin (detail)
- Mexican 6% Puerto Rican 4% Cuban 3%
- Common ancestry
- Slovak 3% Lithuanian 2% Italian 2%
- Foreign-born
- 9% · Canada
- Languages at home
- 81% English-only · Spanish 17% French/Haitian/Cajun 1% Other Indo-European 1%
Political lean MEDSL · Polk
- 2024 margin
- Strong R (+20.7) · D 39.2% · R 59.9%
- 2008→2024 swing
- -14.6pp toward R · 2008: -6.1pp · 2024: -20.7pp
- All cycles
- 2024: R+20.7 2020: R+14.4 2016: R+14.1 2012: R+6.8 2008: R+6.1
Not yet ingested
- Civics
- —
Market trends
- HPI YoY
- ▼ -60.62%
- Current HPI
- 340.6056
- Rent YoY
- —
- Metro
- Lakeland-Winter Haven, FL
- State GDP YoY
- ▲ 3.28%
- F500 in state
- 36
Industry mix (Fortune 500 HQ in FL)
| Industry | F500 HQs | Revenue |
|---|---|---|
| Industrial Technology | 2 | $29B |
|
||
| Insurance | 2 | $17B |
|
||
| Retail | 1 | $60B |
|
||
| Technology Distribution | 1 | $58B |
|
||
| Homebuilding | 1 | $35B |
|
||
| Technology Manufacturing | 1 | $35B |
|
||
Price history
-13.8% since first listed17 events — show timeline
- 2026-05-21 Listed $345,000 Stellar MLS as Distributed by MLS Grid
- 2026-05-21 Rental Removed $1,350 APPFOLIO
- 2026-05-06 Listed for Rent $1,350 APPFOLIO
- 2025-03-06 Rental Removed $1,300 STELLARMLS
- 2025-02-20 Listed for Rent $1,300 STELLARMLS
- 2025-02-20 Rental Removed $1,300 APPFOLIO
- 2025-02-12 Listed for Rent $1,300 APPFOLIO
- 2023-12-29 Rental Removed $1,300 STELLARMLS
- 2023-12-19 Price Changed $1,300 STELLARMLS
- 2023-11-07 Listed for Rent $1,450 STELLARMLS
- 2017-12-08 Sold (Public Records) $140,000 Public Records
- 2017-12-06 Sold (MLS) $140,000 Stellar MLS as Distributed by MLS Grid
- 2017-10-06 Pending — Stellar MLS as Distributed by MLS Grid
- 2017-08-22 Listed $140,000 Stellar MLS as Distributed by MLS Grid
- 2005-03-09 Sold (Public Records) $124,900 Public Records
- 1996-05-13 Sold (Public Records) $400,000 Public Records
- 1996-05-13 Sold (Public Records) $400,000 Public Records
Property tax history
+10.2%/yrLatest (2025): $3,872 · +30.8% YoY. Source: county tax records.
Cash-flow waterfall
monthlySold comps — $/sqft
last 12 mo · ≤1 miLoading sold comps…