4202 Stephanie Ln · Jonesboro, AR
Flood risk 1/10 · Minimal
- FEMA flood zone
- X
- Chance of flooding over 30 yrs
- 0.0%
- Est. flood insurance / yr
- $507 – $1,088
Fire risk 4/10 · Minor
- Est. fire insurance / yr
- $1,499 – $2,785
Heat risk 6/10 · Moderate
- Hot days now (above 108°F)
- 7 days/yr
- Hot days in 30 yrs
- 22 days/yr
Wind risk 4/10 · Minor
- Chance of severe wind over 30 yrs
- 8.0%
Air-quality risk 1/10 · Minimal
- Unhealthy air days now
- 0 days/yr
- Unhealthy air days in 30 yrs
- 0 days/yr
Risk factors via First Street. Map © Google.
Why this score? — see what drove the D grade
The composite is a weighted blend of 9 inputs, each scored 0–100. Each bar is that input's sub-score; the figure is the points it added to the 100-point composite (weight × sub-score).
- ARV discount +9.9/15.0
- Appreciation +9.7/10.0
- Cash flow +7.4/30.0
- Livability +3.2/5.0
- Rent growth +2.5/5.0
- Condition / age +2.5/5.0
- Schools +1.9/10.0
- DSCR +1.6/10.0
- 1% rule +1.3/10.0
$309,900
🖨 Deal sheet 📄 Offer letter ✓ Due diligence
Listing remarks
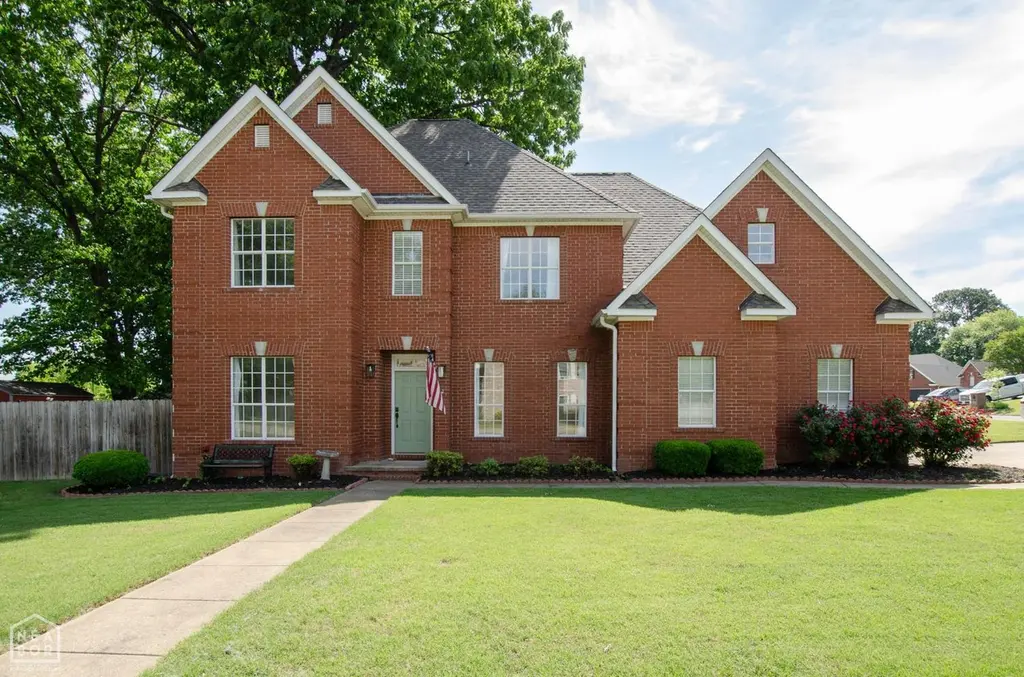
A classic brick exterior and an updated interior make this the perfect balance of charm and functionality. 4202 Stephanie Lane is a traditional two-story home with timeless curb appeal on a corner lot with a fenced backyard. Inside, you'll find pine hardwood floors, fresh paint, and an inviting 4-bedroom, 3-bathroom layout. The kitchen, updated in 2025, features new countertops, painted cabinetry, a tile backsplash, and updated fixtures. Smart thermostats help keep the home energy efficient, and fresh lighting and updates throughout add a modern touch. Outside, the home has been well maintained with newer gutters, and nice landscaping including knockout roses in full bloom! An air-condition
Key facts
- Brick exterior
- Updated interior
- Updated kitchen
Tags
Property features AI
Finance
- Other: Approx. lot size: 0.29 acre; Approx. living area reported as 2,638 (source: courthouse/tax records)
- Financial info: Financing accepted: VA, FHA, Conventional, or Cash
Exterior
- Parking: Side-entry 2-car garage
- Security: Video surveillance
- Utilities: Public sewer; Public water; Municipal electric (Entergy); Natural gas
- Home design: Single-family residence
- Construction: Composition roof with architectural shingles; Slab foundation
- Exterior features: Brick exterior; Deck; Fully fenced yard with wood fence; Guttering; Paved road access; Level, corner lot in a subdivision; Inside city limits
Interior
- Kitchen: Electric range; Dishwasher; Disposal; Pantry
- Flooring: Carpet; Wood; Tile
- Bathrooms: 3 full bathrooms
- Heating & cooling: Central heat (natural gas); Central cooling (electric); Programmable thermostat; Other heating/cooling details (see remarks)
- Interior features: Washer and dryer connections (electric dryer); Electric water heater; Whirlpool/Hot Tub/Spa; Ceiling fans; Walk-in shower; Breakfast bar; Wired for high-speed internet; Video surveillance; Kitchen countertops are quartz; Sheetrock walls/ceilings; Gas log fireplace
- Laundry & utility: Laundry room; Washer connection; Dryer connection (electric)
Neighborhood map
What this means for you Summary
Snapshot
- This is a 4-bed/3.0-bath single-family listed at $310k.
Deal economics
- At list price, monthly cash flow is $-394 ($-5k/yr) — negative.
- To cash-flow at today's rent, offer at most $240k (22.5% below list).
- To meet the 1% rule (rent ≥ 1% of price), the offer needs to be $194k (37.4% below list).
- Recommended offer: $194k (37.4% below list) — sets the bar for 1% rule.
Location & tenants
- Location reads 65/100 on livability (#145 in AR) — a middle-class / working-renter tenant base. Strengths: cost of living A+, housing A+, health & safety A+; Watch: crime F, amenities F, commute F.
- Nettleton School District (urban): math 21% / reading 24% proficiency, ranked #199 of 238 in AR (top 84%) — low school quality limits family demand, transient renter base, plan for 1-2y turnover.
- Zoned schools: Nettleton Steam School (math 33% / reading 26%, grade F, #305 of 454 statewide, top 71%, 324 students, 100% FRL); Nettleton High School (math 11% / reading 27%, grade F, #248 of 292 statewide, top 86%, 981 students, 68% FRL) — zoned schools average 84% FRL vs 56% district-wide (28 pts higher); higher-poverty schools than district average — tighter screening recommended.
- Market conditions: 152 active listings in the ZIP; solid renter incomes; 926 units permitted in Craighead County in 2024 (69 in 5+ unit buildings).
Forward outlook
- In year one you build about $31k of equity ($2k loan paydown + $29k appreciation (9.4% local appreciation)).
- Craighead County population projected at +38% by 2050 — long-run rental-demand tailwind backs the buy-and-hold thesis.
- By year 2, paydown + projected appreciation supports a ~$50k cash-out refi (75% LTV) — recoverable capital for the next deal without selling this one.
Negotiation context
- Only 10 days on market — expect competitive offers; lowballing is unlikely to land.
- 9 sale attempts since 6y ago with the ask held roughly flat each time — persistent listings suggest the price (not the market) is what's stuck; bring a comps-based counter.
- Current owner paid $238k; 30% above their basis — modest negotiation headroom, anchor on the comps not their cost.
Risks & watch-outs
- Climate carrying-cost: extreme-heat days projected 7→22/yr by 2055 (HVAC capex compounding) — expect insurance premiums to compound above CPI over the hold.
Questions for the listing agent
- What do current leases actually rent for vs. the listed asking? Can we see a recent rent roll and the last 12 months of T-12 income?
- Is there a deadline driving the sale (1031 exchange, divorce, estate, relocation)? That informs how much negotiation room exists.
- Schools are D-rated, which usually means shorter tenancies and higher turnover. Who's the typical renter profile here, and what's been the actual vacancy rate?
- Crime grade is F in this area — have there been break-ins, vandalism, or insurance claims at this property in the last 3 years? What carrier currently insures it and at what premium?
- The area grade is low — what's the realistic commute time and amenity access for the typical tenant pool here? Any planned neighborhood developments (good or bad) we should know about?
- What's the average days-on-market for RENTAL listings here right now (not sales)? A rising rental-DOM trend means longer vacancies and softer asking-rent achievability than the comps imply.
- What's the recent tenant-quality profile in this submarket — average credit score on applications, eviction rate, late-payment / NSF rate, and stable-employment percentage? A property-management company in the area should have these aggregated.
- How much new for-sale + rental construction is in the pipeline within 1–3 miles? Heavy new supply typically softens prices + rents 12–24 months out; constrained supply supports both.
Investment metrics
- 1% rule
- 0.63% ✗
- Cap rate
- 4.77%
- Cash-on-cash
- -5.45%
- DSCR
- 0.76
- GRM
- 13.3
CMA / ARV
- ARV (median comp)
- $327,324
- List price
- $309,900
- Delta
- -5.32%
- Verdict
- FAIR
- Comps
- 20 within 1.0 mi
Show comp detail 12 sales within ~0.75 mi
| Address | Dist | Beds/Ba | Sqft | Sold | Price | $/sf | Match |
|---|---|---|---|---|---|---|---|
| 615 Prospect Valley Drive Dr | 0.18mi | 4/3.5 | 2,708 (+3%) | 11mo | $419,900 | $155 | 76 |
| 801 Cypress Knee Cv | 0.19mi | 5/2.5 (+1) | 2,750 (+4%) | 11mo | $325,000 | $118 | 68 |
| 607 Prospect Valley Dr | 0.20mi | 5/3.0 (+1) | 2,920 (+11%) | 1mo | $372,900 | $128 | 67 |
| 611 Prospect Valley Dr | 0.19mi | 4/4.0 | 2,817 (+7%) | 12mo | $408,500 | $145 | 66 |
| 4001 Stoke Dr | 0.22mi | 4/3.0 | 2,300 (-13%) | 8mo | $345,000 | $150 | 61 |
| 4001 Stoke | 0.23mi | 4/3.0 | 2,300 (-13%) | 8mo | $345,000 | $150 | 61 |
| 616 Purton Cv | 0.19mi | 4/4.0 | 2,840 (+8%) | 17mo | $372,000 | $131 | 61 |
| 3804 Burdyshaw Dr | 0.34mi | 4/3.0 | 2,450 (-7%) | 16mo | $240,000 | $98 | 59 |
| 4121 Stephanie Ln | 0.10mi | 3/2.0 (-1) | 2,312 (-12%) | 10mo | $323,000 | $140 | 57 |
| 312 Marzee Ann Dr | 0.73mi | 4/3.0 | 2,768 (+5%) | 1mo | $310,000 | $112 | 57 |
| 905 Cypress Knoll Dr | 0.22mi | 4/3.0 | 3,000 (+14%) | 16mo | $440,000 | $147 | 54 |
| 3105 Maplewood Ter | 0.45mi | 3/2.5 (-1) | 2,280 (-14%) | 10mo | $235,500 | $103 | 41 |
Match score weights: distance 35% · size 25% · config 20% · recency 20%. Top-matched comps best support the ARV.
Projected returns pro-forma
9.42% appreciation · 3.0% rent growth · sell at horizon
- IRR
- 19.1%
- Equity multiple
- 2.51×
- Total profit
- $131,350
- Equity at exit
- $266,162
- IRR
- 17.7%
- Equity multiple
- 5.65×
- Total profit
- $403,462
- Equity at exit
- $560,677
Cash invested: $86,772 (down + closing). Projections, not guarantees.
Landlord ↔ Tenant lean methodology
- Overall (STATE)
- 92 Strongly Landlord-Friendly
- State Arkansas
- 92 Strongly Landlord-Friendly · R+14
- County
- — inherits STATE
- City
- — inherits STATE
ZIP-level market 72405
- Home prices YoY
- 3.5%
- Active inventory
- 152
- Price-to-rent
- 13.3×
Monthly cashflow live
- Estimated rent
- $1,940 medium interval (Pro) →
- Mortgage (P&I)
- −$1,625
- Tax from tax record
- −$172 /mo · $2,063/yr
- Insurance
- −$129
- HOA
- −$0
- Vacancy / Maint / Mgmt
- −$407
- Net cashflow
- $-394
Break-even live
UW: 25.0% down · 7.5% · 30yr · 1.5% tax · 5.0% vac · 8.0% maint · 8.0% mgmt
Financing live
Cash to close
- Down payment
- $77,475
- Closing costs
- $9,297
- Reserves months
- —
- Total cash needed
- —
Loan-product check · same deal, 3 products live
Conventional
25% down · 7.5% · 30yr
- Down + closing
- —
- Monthly P&I
- —
- Monthly cashflow
- —
- DSCR
- —
- Eligible?
- —
Personal DTI + credit; lowest rate.
DSCR
20% down · 8.5% · 30yr
- Down + closing
- —
- Monthly P&I
- —
- Monthly cashflow
- —
- DSCR
- —
- Eligible?
- —
No personal income docs; deal must DSCR.
Hard money
10% down · 12.0% · 12mo
- Down + closing
- —
- Monthly P&I
- —
- Monthly cashflow
- —
- DSCR
- —
- Eligible?
- —
Short-term bridge; refi at stabilization.
Listing history 25 events
-
2026-05-18status Under Contract 1005-char remark
-
2026-05-08$309,900 New Listing 1005-char remark
-
2026-05-08historical
-
2026-03-31price $315,000
-
2026-03-30price $315,000
-
2026-03-28status Active
-
2026-03-28status Back on Market
-
2026-03-12historical
-
2026-03-12status Under Contract
-
2026-03-02status Active
-
2026-03-02status Back on Market
-
2026-03-01historical Take Backups
-
2026-01-21historical
-
2026-01-21status Under Contract
-
2026-01-06price $324,900
-
2026-01-06price $324,900
-
2025-11-07$334,900 New Listing
-
2025-11-07$334,900 Active
-
2025-07-17historical
-
2025-07-16price $349,000
-
2025-06-23$359,000 New Listing
-
2020-11-19soldstatus $238,000
-
2020-11-10soldstatus $238,000
-
2020-08-31$245,000
-
1998-03-02soldstatus $166,000
ⓘ Source: listings_history table (triggers on properties + properties_extension) + one-shot
backfill from property_details.listing_events for pre-trigger history.
Tax reassessment forecast AR · Resets to sale price
- Current annual tax
- $2,063 · $172/mo
- Projected year-2 tax
- $2,063 · $172/mo
- Expected delta
- $0/yr ($0/mo · 0.0%)
ⓘ Screening estimate from a state-policy table — verify with the county assessor before closing.
Climate risk First Street
- Flood 1/10 Low FEMA zone X · 0% chance over 30 yrs
- Wildfire 4/10 Moderate
- Heat 6/10 Major 7 d/yr ≥108°F today · 22 d/yr by 30 yrs out
- Wind 4/10 Moderate 8% chance of damaging wind over 30 yrs
- Air quality 1/10 Low 0 unhealthy d/yr today · 0 by 30 yrs out
Nearby sold comps map
Loading sold comps map…
Walkable amenities ~0.75 mi
Loading nearby amenities…
Taxation est. · year 1
- Rental income
- $23,275
- − Mortgage interest
- −$17,359
- − Property taxes
- −$2,063
- − Insurance
- −$1,550
- − Repairs & maintenance
- −$1,862
- − Management
- −$1,862
- − Depreciation
- −$9,015
- Taxable loss
- −$10,436
- Est. tax savings @ 24.0%
- +$2,505
- After-tax cash flow
- $-2,222/yr
For passive investors: Depreciation is non-cash, so a rental often shows a tax loss while cash-flowing — sheltering income. Rental losses are passive: they offset passive income freely, and up to $25,000/yr can offset ordinary (W-2) income if you actively participate and your MAGI is under $100k (phasing out to $0 by $150k); unused losses carry forward. On sale, claimed depreciation is recaptured at up to 25%, and gains may owe capital-gains tax (a 1031 exchange can defer both). Figures are a year-1 estimate at your 24.0% rate — not tax advice; consult a CPA.
Schools (NCES district)
- District
- Nettleton School District
- NCES district ID
- 0510440
- Math proficiency
- 21% ▼ -16.00%
- Reading proficiency
- 24% ▼ -12.00%
- Median HH income
- $39,754
- Composite
- 19.0/100
- National rank
- #8846
- State rank
- #199 of 238 in AR
Livability — Jonesboro
- Score
- 65/100
- State rank
- #145
- US rank
- #12692
Category grades
Schools grade is shown separately in the Schools card above.
Census & demographics
- Census place
- Jonesboro, AR
- County
- Craighead County · 97,185 people
- City population
- 91,245
- Metro
- Jonesboro, AR
- Population (ZIP)
- 18,675
- Household income
- $92,440
- Rent vs Own
- Severe rent burden
- 443.0
Population outlook (Craighead County) Hauer SSP2
- Today (2025)
- 122,235 people
- By 2030
- 131,338 · +7.4%
- By 2040
- 149,862 · +22.6%
- By 2050
- 168,034 · +37.5%
- By 2075
- 208,094 · +70.2%
- By 2100
- 233,251 · +90.8%
Race, ethnicity, and origin ACS 2023
- Neighborhood character
- Predominantly White (78%)
- Race & ethnicity
- White 78% Two or more races 10% Black 9% Hispanic / Latino 3% Asian 1%
- Common ancestry
- Slovak 2% Italian 1% Serbian 1%
- Foreign-born
- 4% · Canada
- Languages at home
- 93% English-only · Spanish 4% Arabic 1%
Political lean MEDSL · Craighead
- 2024 margin
- Solid R (+37.4) · D 30.1% · R 67.5% · Other 2.4%
- 2008→2024 swing
- -12.9pp toward R · 2008: -24.5pp · 2024: -37.4pp
- All cycles
- 2024: R+37.4 2020: R+35.4 2016: R+35.2 2012: R+31.1 2008: R+24.5
Not yet ingested
- Civics
- —
Market trends
- HPI YoY
- ▲ 9.42%
- Current HPI
- 277.37
- Rent YoY
- —
- Metro
- Jonesboro, AR
- State GDP YoY
- ▲ 3.80%
- F500 in state
- 10
Industry mix (Fortune 500 HQ in AR)
| Industry | F500 HQs | Revenue |
|---|---|---|
| Retail | 1 | $681B |
|
||
| Food / Agriculture | 1 | $53B |
|
||
| Retail / Energy | 1 | $22B |
|
||
| Transportation / Logistics | 1 | $12B |
|
||
| Energy | 1 | $4B |
|
||
Price history
+86.7% since first listed25 events — show timeline
- 2026-05-18 Pending — CARMLS
- 2026-05-08 Listed $309,900 CARMLS
- 2026-05-08 Listing Removed — CARMLS
- 2026-03-31 Price Changed $315,000 CARMLS
- 2026-03-30 Price Changed $315,000 NEABOR MLS
- 2026-03-28 Relisted — NEABOR MLS
- 2026-03-28 Relisted — CARMLS
- 2026-03-12 Delisted — NEABOR MLS
- 2026-03-12 Pending — CARMLS
- 2026-03-02 Relisted — NEABOR MLS
- 2026-03-02 Relisted — CARMLS
- 2026-03-01 Contingent — CARMLS
- 2026-01-21 Delisted — NEABOR MLS
- 2026-01-21 Pending — CARMLS
- 2026-01-06 Price Changed $324,900 CARMLS
- 2026-01-06 Price Changed $324,900 NEABOR MLS
- 2025-11-07 Listed $334,900 NEABOR MLS
- 2025-11-07 Listed $334,900 CARMLS
- 2025-07-17 Listing Removed — CARMLS
- 2025-07-16 Price Changed $349,000 CARMLS
- 2025-06-23 Listed $359,000 CARMLS
- 2020-11-19 Sold (Public Records) $238,000 Public Records
- 2020-11-10 Sold (MLS) $238,000 NEABOR MLS
- 2020-08-31 Listed $245,000 NEABOR MLS
- 1998-03-02 Sold (Public Records) $166,000 Public Records
Property tax history
+1.6%/yrLatest (2025): $2,063 · +7.7% YoY. Source: county tax records.
Cash-flow waterfall
monthlySold comps — $/sqft
last 12 mo · ≤1 miLoading sold comps…