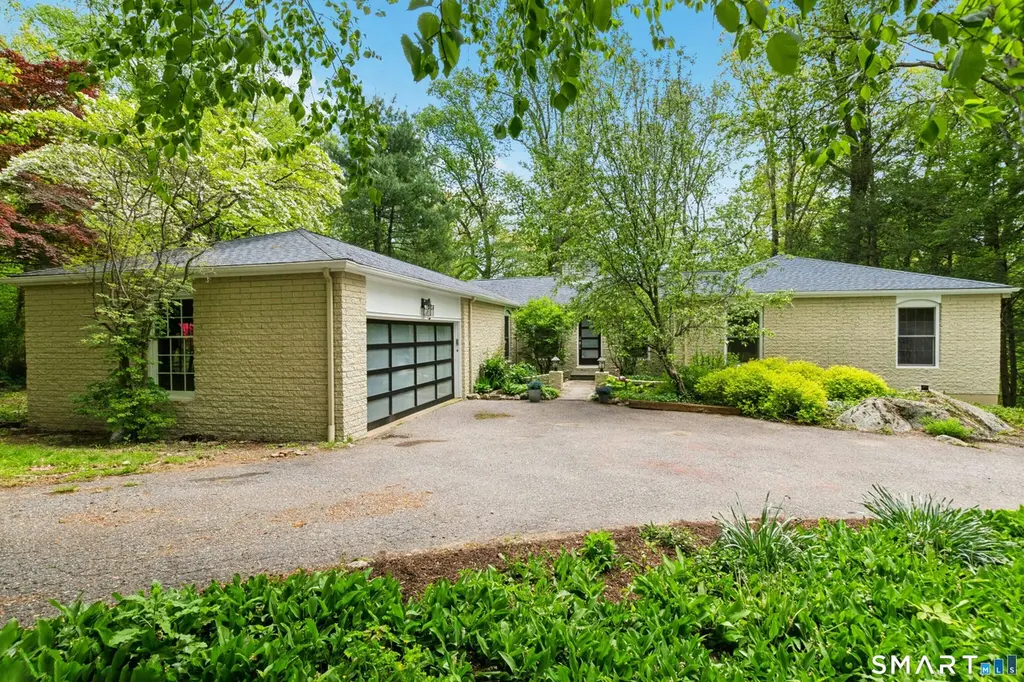
19 Timber Mill Cir · Stamford, CT
Flood risk 1/10 · Minimal
- FEMA flood zone
- X (unshaded)
- Chance of flooding over 30 yrs
- 0.0%
- Est. flood insurance / yr
- $473 – $860
Fire risk 2/10 · Minimal
- Est. fire insurance / yr
- $829 – $1,539
Heat risk 5/10 · Moderate
- Hot days now (above 100°F)
- 7 days/yr
- Hot days in 30 yrs
- 16 days/yr
Wind risk 6/10 · Moderate
- Chance of severe wind over 30 yrs
- 56.0%
Air-quality risk 4/10 · Minor
- Unhealthy air days now
- 5 days/yr
- Unhealthy air days in 30 yrs
- 7 days/yr
Risk factors via First Street. Map © Google.
Why this score? — see what drove the C- grade
The composite is a weighted blend of 9 inputs, each scored 0–100. Each bar is that input's sub-score; the figure is the points it added to the 100-point composite (weight × sub-score).
- Cash flow +19.3/30.0
- ARV discount +11.5/15.0
- DSCR +6.1/10.0
- 1% rule +5.0/10.0
- Schools +3.5/10.0
- Livability +3.5/5.0
- Rent growth +2.5/5.0
- Condition / age +2.5/5.0
- Appreciation +0.0/10.0
$950,000
🖨 Deal sheet (PDF) 📄 Offer letter ✓ Due diligence
Listing remarks
THANK YOU FOR YOUR INTEREST - SELLERS WILL REVIEW OFFERS ON TUESDAY 5/19 AT 1200. Perfectly positioned on a quiet cul-de-sac in the highly sought-after Saw Mill neighborhood, this unique ranch with a contemporary flair and open floor plan offers a seamless blend of comfort and style. Enjoy picturesque pond views from the expansive deck, rebuilt with Brazilian Ipe wood-ideal for relaxing afternoons-or gather around the stone fire pit for evenings with friends. The main level features a spacious living room with fireplace and a formal dining room, both with French doors opening to the deck. A newer European-style eat-in kitchen flows seamlessly into the family room. The primary suite, along w
Key facts
- 1.6 acre lot
- 2 garage spots
- Built 1965
Property features AI
Finance
- HOA & community: Homeowners association with $100 annual fee; Association fee includes grounds maintenance
Exterior
- Parking: Attached garage; 2-car garage
- Utilities: Private well water; Septic system; Energy Star rated features; Generator ready; Thermopane windows
- Home design: Single-family home; Color: Bermuda Sand
- Construction: Frame construction; Brick and cedar siding; Asphalt shingle roof; Block and concrete foundation
- Exterior features: Underground utilities; Shed; Fruit trees; Deck; Exterior lighting; Stone wall; French doors; Patio; Pond access / waterfront; Treed, rocky lot on a cul-de-sac; Direct waterfront
Interior
- Kitchen: Microwave; Refrigerator; Dishwasher
- Bedrooms: 4 bedrooms
- Bathrooms: 3 full bathrooms; 1 half bathroom
- Heating & cooling: Hot water heat (oil); Oil fuel with 40-gallon hot water tank; Programmable thermostat; Central air
- Interior features: Auto garage door opener; Cable pre-wired; Central vacuum; Humidifier; Open floor plan; Security system; Home automation with locks and security system; Two fireplaces; In-law apartment possible with lower level access; Has attic with pull-down stairs; Full, heated, fully finished basement with interior access, storage and walk-out; includes livable space
- Laundry & utility: Washer; Dryer; Main level laundry room
Neighborhood map
What this means for you Summary
Snapshot
- This is a 4-bed/3.0-bath single-family listed at $950k.
Deal economics
- At list price, monthly cash flow is $1k ($13k/yr) — positive.
- The deal already cash-flows at list — no discount required.
- Meets the 1% rule at list price ($10k rent vs $950k).
- Recommended offer: $936k (1.5% below list) — sets the bar for market timing.
- Cap rate 7.6% vs local median 3.0% in Stamford — top-decile yield for the area; either an underpriced asset or a hidden risk that comps aren't pricing in. Stress-test before assuming the spread holds.
Location & tenants
- Location reads 70/100 on livability (#98 in CT) — a middle-class / working-renter tenant base. Strengths: employment A+, health & safety A+, crime A-; Watch: amenities F, commute F, cost of living F.
- Stamford School District (urban): math 32% / reading 43% proficiency, ranked #103 of 153 in CT (top 67%) — families likely to look elsewhere, expect single-tenant / working-renter base with shorter leases.
- Zoned schools: Roxbury School (math 33% / reading 33%, grade F, #354 of 553 statewide, top 64%, 562 students, 53% FRL); Scofield Middle School (math 36% / reading 51%, grade D, #98 of 175 statewide, top 57%, 584 students, 50% FRL); Westhill High School (math 33% / reading 50%, grade F, #102 of 194 statewide, top 53%, 2,265 students, 50% FRL).
- Market conditions: 74 active listings in the ZIP; 1 comparable units currently listed for rent nearby; 1,151 units permitted in Western Connecticut Planning Region in 2024 (714 in 5+ unit buildings).
Forward outlook
- Local home prices are declining (-3.0%/yr); year-one equity from $7k of loan paydown is wiped out by about $28k of value loss. Plan a longer hold.
Negotiation context
- It's been on market 19 days — a 2% lower offer ($936k) is reasonable based on typical stale-listing flexibility.
Risks & watch-outs
- Climate carrying-cost: major wind risk, 56% chance of damaging wind over 30y; extreme-heat days projected 7→16/yr by 2055 (HVAC capex compounding) — expect insurance premiums to compound above CPI over the hold.
Questions for the listing agent
- Built in 1965 — when were the roof, HVAC, electrical panel, plumbing, and water heater last replaced?
- What does the HOA fee cover, when was the last increase, and are there any pending special assessments or reserve-fund shortfalls?
- Is there a deadline driving the sale (1031 exchange, divorce, estate, relocation)? That informs how much negotiation room exists.
- Schools are B-rated — typically a magnet for longer-tenancy family renters. What's the average tenant stay here, and is there a school-zone premium baked into asking?
- What's the average days-on-market for RENTAL listings here right now (not sales)? A rising rental-DOM trend means longer vacancies and softer asking-rent achievability than the comps imply.
- What's the recent tenant-quality profile in this submarket — average credit score on applications, eviction rate, late-payment / NSF rate, and stable-employment percentage? A property-management company in the area should have these aggregated.
- How much new for-sale + rental construction is in the pipeline within 1–3 miles? Heavy new supply typically softens prices + rents 12–24 months out; constrained supply supports both.
Investment metrics
- 1% rule
- 1.00% ✓
- Cap rate
- 7.62%
- Cash-on-cash
- 4.72%
- DSCR
- 1.21
- GRM
- 8.3
CMA / ARV
- ARV (median comp)
- $1,043,181
- List price
- $950,000
- Delta
- -8.93%
- Verdict
- FAIR
- Comps
- 20 within 1.0 mi
Show comp detail 12 sales within ~0.75 mi
| Address | Dist | Beds/Ba | Sqft | Sold | Price | $/sf | Match |
|---|---|---|---|---|---|---|---|
| 494 Sawmill Rd | 0.18mi | 4/3.0 | 4,402 (+8%) | 5mo | $910,000 | $207 | 74 |
| 65 Malibu Rd | 0.32mi | 4/3.0 | 3,820 (-6%) | 6mo | $1,050,000 | $275 | 69 |
| 732 Den Rd | 0.57mi | 4/3.5 | 4,154 (+2%) | 8mo | $1,285,000 | $309 | 61 |
| 288 Shelter Rock Rd | 0.35mi | 4/3.5 | 3,665 (-10%) | 10mo | $1,700,000 | $464 | 57 |
| 277 Dundee Rd | 0.48mi | 5/4.5 (+1) | 3,995 (-2%) | 9mo | $1,155,000 | $289 | 56 |
| 25 Mill Stone Cir | 0.32mi | 4/2.5 | 3,472 (-15%) | 6mo | $1,100,000 | $317 | 54 |
| 21 Easthill Rd | 0.60mi | 4/3.0 | 4,409 (+8%) | 7mo | $1,300,000 | $295 | 53 |
| 230 Butternut Ln | 0.44mi | 3/3.5 (-1) | 4,352 (+7%) | 11mo | $1,375,000 | $316 | 52 |
| 53 Pinnacle Rock Rd | 0.57mi | 5/3.0 (+1) | 3,804 (-7%) | 10mo | $1,270,000 | $334 | 49 |
| 27 Easthill Rd | 0.61mi | 4/4.0 | 4,343 (+7%) | 11mo | $1,250,000 | $288 | 48 |
| 146 Ridgecrest Rd | 0.70mi | 5/4.5 (+1) | 4,188 (+3%) | 11mo | $2,005,000 | $479 | 42 |
| 51 Boulder Brook Dr | 0.62mi | 4/3.5 | 4,558 (+12%) | 10mo | $1,090,000 | $239 | 41 |
Match score weights: distance 35% · size 25% · config 20% · recency 20%. Top-matched comps best support the ARV.
Projected returns pro-forma
-3.0% appreciation · 3.0% rent growth · sell at horizon
- IRR
- -8.9%
- Equity multiple
- 0.67×
- Total profit
- $-87,163
- Equity at exit
- $141,648
- IRR
- 0.6%
- Equity multiple
- 1.04×
- Total profit
- $10,302
- Equity at exit
- $82,139
Cash invested: $266,000 (down + closing). Projections, not guarantees.
Landlord ↔ Tenant lean methodology
- Overall (STATE)
- 27 Tenant-Leaning
- State Connecticut
- 27 Tenant-Leaning · D+7
- County
- — inherits STATE
- City
- — inherits STATE
ZIP-level market 06903
- Active inventory
- 74
- Price-to-rent
- 8.3×
Monthly cashflow live
- Estimated rent
- $9,500 medium interval (Pro) →
- Mortgage (P&I)
- −$4,982
- Tax from tax record
- −$1,072 /mo · $12,864/yr
- Insurance
- −$396
- HOA
- −$8
- Vacancy / Maint / Mgmt
- −$1,995
- Net cashflow
- $1,047
Break-even live
Sensitivity live
| Price | -10% $1,585 | -5% $1,316 | +0% $1,047 | +5% $778 | +10% $509 |
|---|---|---|---|---|---|
| Rent | -10% $297 | -5% $672 | +0% $1,047 | +5% $1,423 | +10% $1,798 |
| Rate | -1.0pp $1,526 | -0.5pp $1,289 | base $1,047 | +0.5pp $801 | +1.0pp $551 |
UW: 25.0% down · 7.5% · 30yr · 1.5% tax · 5.0% vac · 8.0% maint · 8.0% mgmt
Financing live
Cash to close
- Down payment
- $237,500
- Closing costs
- $28,500
- Reserves months
- —
- Total cash needed
- —
Loan-product check · same deal, 3 products live
Conventional
25% down · 7.5% · 30yr
- Down + closing
- —
- Monthly P&I
- —
- Monthly cashflow
- —
- DSCR
- —
- Eligible?
- —
Personal DTI + credit; lowest rate.
DSCR
20% down · 8.5% · 30yr
- Down + closing
- —
- Monthly P&I
- —
- Monthly cashflow
- —
- DSCR
- —
- Eligible?
- —
No personal income docs; deal must DSCR.
Hard money
10% down · 12.0% · 12mo
- Down + closing
- —
- Monthly P&I
- —
- Monthly cashflow
- —
- DSCR
- —
- Eligible?
- —
Short-term bridge; refi at stabilization.
Rent comps 1 comps
| Address | Beds | Baths | Sqft | Rent | $/sqft | DOM | Units | Dist |
|---|---|---|---|---|---|---|---|---|
| 266 W Haviland Ln Stamford, CT | 4.0 | 3.5 | 4560 | $9,500 | $2.08 | 25d | 1 | 0.87mi |
HOA detail
- Monthly dues
- $8 · $96/yr
Listing history 5 events
-
2026-06-03statusdays on market $950,000 Under Contract 19 DOM
-
2026-06-01days on market $950,000 Under Contract - Continue to Show 18 DOM
-
2026-05-31days on market $950,000 Under Contract - Continue to Show 17 DOM
-
2026-05-15$950,000 Active 1445-char remark
-
2026-05-14historical $950,000 1445-char remark
ⓘ Source: listings_history table (triggers on properties + properties_extension) + one-shot
backfill from property_details.listing_events for pre-trigger history.
Tax reassessment forecast CT · Partial reset (capped growth)
- Current annual tax
- $12,864 · $1,072/mo
- Projected year-2 tax
- $16,597 · $1,383/mo
- Expected delta
- +$3,733/yr (+$311/mo · 29.0%)
ⓘ Screening estimate from a state-policy table — verify with the county assessor before closing.
Climate risk First Street
- Flood 1/10 Low FEMA zone X (unshaded) · 0% chance over 30 yrs
- Wildfire 2/10 Low
- Heat 5/10 Major 7 d/yr ≥100°F today · 16 d/yr by 30 yrs out
- Wind 6/10 Major 56% chance of damaging wind over 30 yrs
- Air quality 4/10 Moderate 5 unhealthy d/yr today · 7 by 30 yrs out
Nearby sold comps map
Loading sold comps map…
Walkable amenities ~0.75 mi
Loading nearby amenities…
Taxation est. · year 1
- Rental income
- $114,000
- − Mortgage interest
- −$53,215
- − Property taxes
- −$12,864
- − Insurance
- −$4,750
- − Repairs & maintenance
- −$9,120
- − Management
- −$9,120
- − HOA
- −$96
- − Depreciation
- −$27,636
- Taxable loss
- −$2,801
- Est. tax savings @ 24.0%
- +$672
- After-tax cash flow
- $13,239/yr
For passive investors: Depreciation is non-cash, so a rental often shows a tax loss while cash-flowing — sheltering income. Rental losses are passive: they offset passive income freely, and up to $25,000/yr can offset ordinary (W-2) income if you actively participate and your MAGI is under $100k (phasing out to $0 by $150k); unused losses carry forward. On sale, claimed depreciation is recaptured at up to 25%, and gains may owe capital-gains tax (a 1031 exchange can defer both). Figures are a year-1 estimate at your 24.0% rate — not tax advice; consult a CPA.
Schools (NCES district)
- District
- Stamford School District
- NCES district ID
- 0904320
- Math proficiency
- 32% ▼ -10.00%
- Reading proficiency
- 43% ▼ -7.00%
- Median HH income
- $78,843
- Composite
- 35.14/100
- National rank
- #5010
- State rank
- #103 of 153 in CT
Livability — Stamford
- Score
- 70/100
- State rank
- #98
- US rank
- #7716
Category grades
Schools grade is shown separately in the Schools card above.
Census & demographics
- Census place
- Stamford, CT
- City population
- 123,058
- Population (ZIP)
- 13,630
Population outlook (Western Connecticut County) Hauer SSP2
- By 2040
- 685,031
Race, ethnicity, and origin ACS 2023
- Neighborhood character
- Predominantly White (74%)
- Race & ethnicity
- White 74% Two or more races 11% Hispanic / Latino 9% Black 6% Asian 6%
- Hispanic origin (detail)
- Cuban 1%
- Common ancestry
- Romanian 6% Scotch-Irish 4% Italian 2%
- Foreign-born
- 18% · Canada, China, Dominican Republic
- Languages at home
- 78% English-only · Other Indo-European 6% Spanish 5% Russian/Polish/Slavic 4%
Political lean MEDSL · Western Connecticut
- 2024 margin
- D (+19.1) · D 58.8% · R 39.7% · Other 1.6%
- All cycles
- 2024: D+19.1
Not yet ingested
- Civics
- —
Market trends
- HPI YoY
- ▼ -247.05%
- Current HPI
- 163.3073
- Rent YoY
- —
- Metro
- —
- State GDP YoY
- ▲ 1.06%
- F500 in state
- 38
Industry mix (Fortune 500 HQ in CT)
| Industry | F500 HQs | Revenue |
|---|---|---|
| Industrial Machinery | 4 | $38B |
|
||
| Insurance | 3 | $71B |
|
||
| Financial Services | 2 | $25B |
|
||
| Transportation / Logistics | 2 | $18B |
|
||
| Healthcare | 1 | $247B |
|
||
| Telecommunications | 1 | $55B |
|
||
Price history
+0.0% since first listed4 events — show timeline
- 2026-06-02 Pending — Smart MLS
- 2026-05-20 Contingent — Smart MLS
- 2026-05-15 Listed $950,000 Smart MLS
- 2026-05-14 Coming Soon $950,000 Smart MLS
Property tax history
+3.7%/yrLatest (2022): $12,864 · +1.4% YoY. Source: county tax records.
Cash-flow waterfall
monthlySold comps — $/sqft
last 12 mo · ≤1 miLoading sold comps…