7710 Silversmith Dr · Dawsonville, GA
Flood risk 1/10 · Minimal
- FEMA flood zone
- X (unshaded)
- Chance of flooding over 30 yrs
- 0.0%
- Est. flood insurance / yr
- $507 – $1,088
Fire risk 4/10 · Minor
- Est. fire insurance / yr
- $963 – $1,789
Heat risk 5/10 · Moderate
- Hot days now (above 101°F)
- 7 days/yr
- Hot days in 30 yrs
- 18 days/yr
Wind risk 4/10 · Minor
- Chance of severe wind over 30 yrs
- 10.0%
Air-quality risk 4/10 · Minor
- Unhealthy air days now
- 4 days/yr
- Unhealthy air days in 30 yrs
- 5 days/yr
Risk factors via First Street. Map © Google.
Why this score? — see what drove the D+ grade
The composite is a weighted blend of 9 inputs, each scored 0–100. Each bar is that input's sub-score; the figure is the points it added to the 100-point composite (weight × sub-score).
- ARV discount +15.0/15.0
- Cash flow +12.6/30.0
- Schools +5.7/10.0
- DSCR +3.7/10.0
- Livability +3.4/5.0
- 1% rule +3.3/10.0
- Rent growth +3.3/5.0
- Condition / age +2.5/5.0
- Appreciation +0.0/10.0
$309,900
🖨 Deal sheet (PDF) 📄 Offer letter ✓ Due diligence
Listing remarks MLS
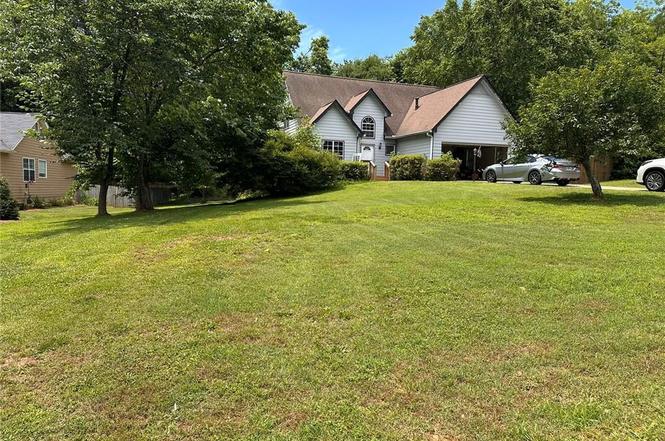
Charming home in well-established neighborhood. Freshly painted interior, this 3 bedroom, 2.5 bath, 2 story home offers a master on main, fireside family room and a large private backyard. Low Forsyth taxes and wonderful Forsyth County schools, close to Hwy 9 and 369!
Key facts
- Spacious lot
- Master-on-main
- Functional layout
Tags
Property features AI
Finance
- Other: Road frontage on a county road with asphalt surface; Directions: Use GPS
- HOA & community: Homeowners association with an annual fee of $378; Community features include an HOA
Exterior
- Parking: Detached garage with 2 garage spaces; Total parking for 8 vehicles
- Utilities: Public water available; Septic tank for sewer; Electricity available; Cable available
- Home design: Two levels; Resale property; Shingle roof
- Construction: Constructed with other materials
- Exterior features: Front porch and rear porch; Fenced yard; Other exterior features
Interior
- Kitchen: Eat-in kitchen; Dishwasher; Electric oven; Gas range
- Bedrooms: Master bedroom on the main level; One bedroom on the main level; Two bedrooms on the upper level
- Flooring: Hardwood flooring
- Bathrooms: Two full bathrooms; One half bathroom; Main level has one full bathroom and one half bath; Upper level has one full bathroom; Master bath with tub/shower combo
- Heating & cooling: Central heating; Central air conditioning
- Interior features: One fireplace located in the family room; Other interior features; No shared/common walls
- Laundry & utility: Laundry located on the upper level
Neighborhood map
What this means for you Summary
Snapshot
- This is a 3-bed/2.5-bath single-family listed at $310k.
Deal economics
- At list price, monthly cash flow is $-42 ($-504/yr) — negative.
- To cash-flow at today's rent, offer at most $302k (2.4% below list).
- To meet the 1% rule (rent ≥ 1% of price), the offer needs to be $259k (16.5% below list).
- Recommended offer: $259k (16.5% below list) — sets the bar for 1% rule.
- Cap rate 6.1% vs local median 3.0% in Dawsonville — top-decile yield for the area; either an underpriced asset or a hidden risk that comps aren't pricing in. Stress-test before assuming the spread holds.
Location & tenants
- Location reads 68/100 on livability (#155 in GA) — a middle-class / working-renter tenant base. Strengths: crime A+, cost of living A+, housing A+; Watch: amenities F, commute F, health & safety D-.
- Forsyth County (suburban): math 62% / reading 62% proficiency, ranked #5 of 174 in GA (top 3%) — acceptable for families but not a draw, mixed tenant base, ~2y average lease; only 15% free/reduced lunch — higher-income household profile.
- Zoned schools: Silver City Elementary School (math 66% / reading 56%, grade B, #118 of 1,228 statewide, top 10%, 1,128 students, 16% FRL); North Forsyth Middle School (math 47% / reading 49%, grade C-, #80 of 470 statewide, top 17%, 1,191 students, 20% FRL); North Forsyth High School (math 22% / reading 37%, grade F, #140 of 424 statewide, top 35%, 2,065 students, 14% FRL) — zoned schools at 17% FRL track the district average.
- Zoned-school proficiency averages 46% at this address vs 62% district-wide (-16 pts) — the specific schools serving this property underperform the Forsyth County average; the district grade overstates school quality for this exact location.
- Market conditions: Rents rising (+3.3%/yr); 544 active listings in the ZIP; high-income renter base; 2,525 units permitted in Forsyth County in 2024 (810 in 5+ unit buildings).
Forward outlook
- Local home prices are declining (-3.0%/yr); year-one equity from $2k of loan paydown is wiped out by about $9k of value loss. Plan a longer hold.
- Forsyth County population projected at +71% by 2050 — long-run rental-demand tailwind backs the buy-and-hold thesis.
Negotiation context
- Only 7 days on market — expect competitive offers; lowballing is unlikely to land.
- 3 sale attempts since 9y ago with the ask held roughly flat each time — persistent listings suggest the price (not the market) is what's stuck; bring a comps-based counter.
- Current owner paid $173k; list at $310k implies a 79% gain — meaningful room to come down on a strong offer.
Risks & watch-outs
- Climate carrying-cost: extreme-heat days projected 7→18/yr by 2055 (HVAC capex compounding) — expect insurance premiums to compound above CPI over the hold.
Questions for the listing agent
- What do current leases actually rent for vs. the listed asking? Can we see a recent rent roll and the last 12 months of T-12 income?
- What does the HOA fee cover, when was the last increase, and are there any pending special assessments or reserve-fund shortfalls?
- Is there a deadline driving the sale (1031 exchange, divorce, estate, relocation)? That informs how much negotiation room exists.
- Schools are D-rated, which usually means shorter tenancies and higher turnover. Who's the typical renter profile here, and what's been the actual vacancy rate?
- The area grade is low — what's the realistic commute time and amenity access for the typical tenant pool here? Any planned neighborhood developments (good or bad) we should know about?
- What's the average days-on-market for RENTAL listings here right now (not sales)? A rising rental-DOM trend means longer vacancies and softer asking-rent achievability than the comps imply.
- What's the recent tenant-quality profile in this submarket — average credit score on applications, eviction rate, late-payment / NSF rate, and stable-employment percentage? A property-management company in the area should have these aggregated.
- How much new for-sale + rental construction is in the pipeline within 1–3 miles? Heavy new supply typically softens prices + rents 12–24 months out; constrained supply supports both.
Investment metrics
- 1% rule
- 0.83% ✗
- Cap rate
- 6.13%
- Cash-on-cash
- -0.58%
- DSCR
- 0.97
- GRM
- 10.0
CMA / ARV
- ARV (on-the-fly)
- $375,734
- Comps found
- 11
Show comp detail 11 sales within ~0.75 mi
| Address | Dist | Beds/Ba | Sqft | Sold | Price | $/sf | Match |
|---|---|---|---|---|---|---|---|
| 7820 Silversmith Dr | 0.12mi | 3/2.0 | 1,478 (+1%) | 10mo | $435,000 | $294 | 83 |
| 7725 Silversmith Dr | 0.07mi | 3/2.0 | 1,362 (-7%) | 1mo | $350,000 | $257 | 82 |
| 6785 Concord Rd | 0.46mi | 3/2.0 | 1,456 (-0%) | 2mo | $490,000 | $337 | 74 |
| 7840 Silversmith Ct | 0.18mi | 3/2.0 | 1,548 (+6%) | 8mo | $360,000 | $233 | 74 |
| 7750 Silversmith Dr | 0.08mi | 3/2.0 | 1,364 (-7%) | 13mo | $389,000 | $285 | 72 |
| 7870 Silversmith Dr | 0.21mi | 3/2.5 | 1,425 (-2%) | 18mo | $385,000 | $270 | 71 |
| 7925 Silversmith Dr | 0.29mi | 3/2.0 | 1,516 (+4%) | 12mo | $412,500 | $272 | 68 |
| 7920 Silversmith Dr | 0.27mi | 3/3.0 | 1,650 (+13%) | 9mo | $378,000 | $229 | 57 |
| 7960 Jackson Ln | 0.30mi | 3/2.0 | 1,626 (+11%) | 20mo | $394,300 | $242 | 49 |
| 6755 Riley Rd | 0.52mi | 3/1.5 | 1,325 (-9%) | 20mo | $315,000 | $238 | 40 |
| 6585 A C Smith Rd | 0.70mi | 3/2.0 | 1,678 (+15%) | 2mo | $415,000 | $247 | 39 |
Match score weights: distance 35% · size 25% · config 20% · recency 20%. Top-matched comps best support the ARV.
Projected returns pro-forma
-3.0% appreciation · 3.32% rent growth · sell at horizon
- IRR
- -16.9%
- Equity multiple
- 0.40×
- Total profit
- $-52,055
- Equity at exit
- $46,207
- IRR
- -8.2%
- Equity multiple
- 0.48×
- Total profit
- $-45,308
- Equity at exit
- $26,794
Cash invested: $86,772 (down + closing). Projections, not guarantees.
Landlord ↔ Tenant lean methodology
- Overall (STATE)
- 90 Strongly Landlord-Friendly
- State Georgia
- 90 Strongly Landlord-Friendly · R+3
- County
- — inherits STATE
- City
- — inherits STATE
ZIP-level market 30028
- Home prices YoY
- -23.1%
- Rents YoY
- 3.3%
- Active inventory
- 544
- Price-to-rent
- 10.0×
Monthly cashflow live
- Estimated rent
- $2,586 medium interval (Pro) →
- Mortgage (P&I)
- −$1,625
- Tax from tax record
- −$299 /mo · $3,586/yr
- Insurance
- −$129
- HOA
- −$32
- Vacancy / Maint / Mgmt
- −$543
- Net cashflow
- $-42
Break-even live
Sensitivity live
| Price | -10% $133 | -5% $46 | +0% $-42 | +5% $-130 | +10% $-217 |
|---|---|---|---|---|---|
| Rent | -10% $-246 | -5% $-144 | +0% $-42 | +5% $60 | +10% $162 |
| Rate | -1.0pp $114 | -0.5pp $37 | base $-42 | +0.5pp $-122 | +1.0pp $-204 |
UW: 25.0% down · 7.5% · 30yr · 1.5% tax · 5.0% vac · 8.0% maint · 8.0% mgmt
Financing live
Cash to close
- Down payment
- $77,475
- Closing costs
- $9,297
- Reserves months
- —
- Total cash needed
- —
Loan-product check · same deal, 3 products live
Conventional
25% down · 7.5% · 30yr
- Down + closing
- —
- Monthly P&I
- —
- Monthly cashflow
- —
- DSCR
- —
- Eligible?
- —
Personal DTI + credit; lowest rate.
DSCR
20% down · 8.5% · 30yr
- Down + closing
- —
- Monthly P&I
- —
- Monthly cashflow
- —
- DSCR
- —
- Eligible?
- —
No personal income docs; deal must DSCR.
Hard money
10% down · 12.0% · 12mo
- Down + closing
- —
- Monthly P&I
- —
- Monthly cashflow
- —
- DSCR
- —
- Eligible?
- —
Short-term bridge; refi at stabilization.
HOA detail
- Monthly dues
- $32 · $384/yr
Listing history 6 events
-
2026-06-21days on market $309,900 Active 7 DOM
-
2026-06-18days on market $309,900 Active 4 DOM
-
2026-06-17days on market $309,900 Active 3 DOM
-
2026-06-16days on market $309,900 Active 2 DOM
-
2026-06-15remarks 593-char remark
-
2026-06-15$309,900 Active 1 DOM
ⓘ Source: listings_history table (triggers on properties + properties_extension) + one-shot
backfill from property_details.listing_events for pre-trigger history.
Tax reassessment forecast GA · Resets to sale price
- Current annual tax
- $3,586 · $299/mo
- Projected year-2 tax
- $3,586 · $299/mo
- Expected delta
- $0/yr ($0/mo · 0.0%)
ⓘ Screening estimate from a state-policy table — verify with the county assessor before closing.
Climate risk First Street
- Flood 1/10 Low FEMA zone X (unshaded) · 0% chance over 30 yrs
- Wildfire 4/10 Moderate
- Heat 5/10 Major 7 d/yr ≥101°F today · 18 d/yr by 30 yrs out
- Wind 4/10 Moderate 10% chance of damaging wind over 30 yrs
- Air quality 4/10 Moderate 4 unhealthy d/yr today · 5 by 30 yrs out
Nearby sold comps map
Loading sold comps map…
Walkable amenities ~0.75 mi
Loading nearby amenities…
Taxation est. · year 1
- Rental income
- $31,034
- − Mortgage interest
- −$17,359
- − Property taxes
- −$3,586
- − Insurance
- −$1,550
- − Repairs & maintenance
- −$2,483
- − Management
- −$2,483
- − HOA
- −$384
- − Depreciation
- −$9,015
- Taxable loss
- −$5,825
- Est. tax savings @ 24.0%
- +$1,398
- After-tax cash flow
- $894/yr
For passive investors: Depreciation is non-cash, so a rental often shows a tax loss while cash-flowing — sheltering income. Rental losses are passive: they offset passive income freely, and up to $25,000/yr can offset ordinary (W-2) income if you actively participate and your MAGI is under $100k (phasing out to $0 by $150k); unused losses carry forward. On sale, claimed depreciation is recaptured at up to 25%, and gains may owe capital-gains tax (a 1031 exchange can defer both). Figures are a year-1 estimate at your 24.0% rate — not tax advice; consult a CPA.
Schools (NCES district)
- District
- Forsyth County
- NCES district ID
- 1302220
- Math proficiency
- 62% ▼ -13.00%
- Reading proficiency
- 62% ▼ -11.00%
- Median HH income
- $89,763
- Composite
- 56.54/100
- National rank
- #1151
- State rank
- #5 of 174 in GA
Livability — Dawsonville
- Score
- 68/100
- State rank
- #155
- US rank
- #9928
Category grades
Schools grade is shown separately in the Schools card above.
Census & demographics
- County
- Forsyth County · 198,629 people
- City population
- 198,629
- Metro
- Atlanta-Sandy Springs-Alpharetta, GA
- Population (ZIP)
- 38,433
- Household income
- $138,011
- Rent vs Own
- Severe rent burden
- 257.0
Population outlook (Forsyth County) Hauer SSP2
- Today (2025)
- 294,519 people
- By 2030
- 336,546 · +14.3%
- By 2040
- 421,220 · +43.0%
- By 2050
- 502,754 · +70.7%
- By 2075
- 683,179 · +132.0%
- By 2100
- 792,174 · +169.0%
Race, ethnicity, and origin ACS 2023
- Neighborhood character
- Predominantly White (78%)
- Race & ethnicity
- White 78% Hispanic / Latino 11% Two or more races 10% Asian 3% Black 3%
- Hispanic origin (detail)
- Mexican 5% Puerto Rican 2%
- Common ancestry
- Slovak 3% Romanian 3% Italian 2%
- Foreign-born
- 11% · Canada, Jamaica, China
- Languages at home
- 86% English-only · Spanish 8% Other Indo-European 2% Other Asian/Pacific 2%
Political lean MEDSL · Forsyth
- 2024 margin
- Solid R (+33.1) · D 32.9% · R 66.0% · Other 1.1%
- 2008→2024 swing
- +24.9pp toward D · 2008: -58.0pp · 2024: -33.1pp
- All cycles
- 2024: R+33.1 2020: R+33.2 2016: R+47.7 2012: R+62.9 2008: R+58.0
Not yet ingested
- Civics
- —
Market trends
- HPI YoY
- ▼ -79.48%
- Current HPI
- 264.5815
- Rent YoY
- ▲ 3.32%
- Metro
- Atlanta-Sandy Springs-Alpharetta, GA
- State GDP YoY
- ▲ 2.66%
- F500 in state
- 28
Industry mix (Fortune 500 HQ in GA)
| Industry | F500 HQs | Revenue |
|---|---|---|
| Paper / Packaging | 2 | $29B |
|
||
| Retail | 1 | $160B |
|
||
| Transportation / Logistics | 1 | $91B |
|
||
| Airlines | 1 | $62B |
|
||
| Consumer Goods | 1 | $47B |
|
||
| Utilities | 1 | $25B |
|
||
Price history
+287.9% since first listed13 events — show timeline
- 2026-06-03 Listed $309,900 FMLS
- 2017-04-25 Sold (Public Records) $173,000 Public Records
- 2017-04-21 Sold (MLS) $173,000 GAMLS
- 2017-04-21 Sold (MLS) $173,000 FMLS
- 2017-03-21 Pending — GAMLS
- 2017-03-21 Contingent — FMLS
- 2017-03-16 Listed $169,000 GAMLS
- 2017-03-16 Listed $169,000 FMLS
- 2006-08-03 Sold (Public Records) $168,600 Public Records
- 2006-03-07 Sold (Public Records) $125,000 Public Records
- 1996-08-14 Sold (Public Records) $95,000 Public Records
- 1996-08-08 Sold (Public Records) $95,000 Public Records
- 1992-09-14 Sold (Public Records) $79,900 Public Records
Property tax history
+5.9%/yrLatest (2025): $3,586 · +3.4% YoY. Source: county tax records.
Cash-flow waterfall
monthlySold comps — $/sqft
last 12 mo · ≤1 miLoading sold comps…