1262 Chestuee Rd · Benton, TN
Flood risk 1/10 · Minimal
- FEMA flood zone
- X (unshaded)
- Chance of flooding over 30 yrs
- 0.0%
- Est. flood insurance / yr
- $507 – $1,088
Fire risk 6/10 · Moderate
- Est. fire insurance / yr
- $949 – $1,763
Heat risk 6/10 · Moderate
- Hot days now (above 105°F)
- 7 days/yr
- Hot days in 30 yrs
- 20 days/yr
Wind risk 3/10 · Minor
- Chance of severe wind over 30 yrs
- 7.0%
Air-quality risk 3/10 · Minor
- Unhealthy air days now
- 2 days/yr
- Unhealthy air days in 30 yrs
- 2 days/yr
Risk factors via First Street. Map © Google.
Why this score? — see what drove the D- grade
The composite is a weighted blend of 9 inputs, each scored 0–100. Each bar is that input's sub-score; the figure is the points it added to the 100-point composite (weight × sub-score).
- Appreciation +10.0/10.0
- Cash flow +7.6/30.0
- ARV discount +7.5/15.0
- Livability +3.3/5.0
- Schools +2.7/10.0
- Rent growth +2.5/5.0
- Condition / age +2.5/5.0
- DSCR +1.7/10.0
- 1% rule +0.9/10.0
$219,900
🖨 Deal sheet 📄 Offer letter ✓ Due diligence
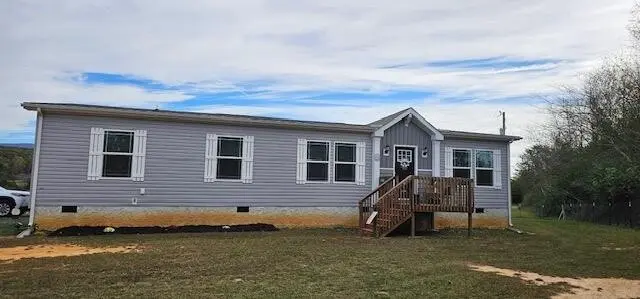
Listing remarks
VIEWS, VIEWS, and more VIEWS. This beautiful home is situated in the middle of a peaceful serenity countryside. Just minutes from the River and Ocoee kayaking. This Home has 3ba/2ba. Large master bath w/ garden tub and shower. 2 Family Rooms walk in Laundry room with tons of storage. You'll love waking up to beautiful Mt Views and Fresh Air.
Key facts
- 0.78 acre lot
- Built 2021
Neighborhood map
What this means for you Summary
Snapshot
- This is a 3-bed/2.0-bath manufactured listed at $220k.
Deal economics
- At list price, monthly cash flow is $-265 ($-3k/yr) — negative.
- To cash-flow at today's rent, offer at most $173k (21.3% below list).
- To meet the 1% rule (rent ≥ 1% of price), the offer needs to be $131k (40.6% below list).
- Recommended offer: $131k (40.6% below list) — sets the bar for 1% rule.
- Cap rate 4.8% vs local median 2.2% in Benton — top-decile yield for the area; either an underpriced asset or a hidden risk that comps aren't pricing in. Stress-test before assuming the spread holds.
Location & tenants
- Location reads 66/100 on livability (#118 in TN) — a middle-class / working-renter tenant base. Strengths: cost of living A+, housing A+, crime A; Watch: health & safety C-, amenities F, commute F.
- Polk County (rural): math 32% / reading 32% proficiency, ranked #44 of 139 in TN (top 32%) — families likely to look elsewhere, expect single-tenant / working-renter base with shorter leases.
- Zoned schools: Polk County High School (math 12% / reading 42%, grade F, #104 of 332 statewide, top 33%, 443 students, 0% FRL) — zoned schools average 0% FRL vs 55% district-wide (55 pts lower); this property's tenant base skews higher-income than the district average.
- Market conditions: 20 active listings in the ZIP; 211 units permitted in Polk County in 2024 (0 in 5+ unit buildings).
Forward outlook
- In year one you build about $24k of equity ($2k loan paydown + $22k appreciation (10.0% local appreciation)).
- Polk County population projected to shrink 9% by 2050 — rents likely to lag national; underwrite the cash flow, not the appreciation.
- By year 2, paydown + projected appreciation supports a ~$38k cash-out refi (75% LTV) — recoverable capital for the next deal without selling this one.
Negotiation context
- Only 0 days on market — expect competitive offers; lowballing is unlikely to land.
- 3 sale attempts with the ask held roughly flat each time — persistent listings suggest the price (not the market) is what's stuck; bring a comps-based counter.
Risks & watch-outs
- Climate carrying-cost: major wildfire risk; extreme-heat days projected 7→20/yr by 2055 (HVAC capex compounding) — expect insurance premiums to compound above CPI over the hold.
Questions for the listing agent
- What do current leases actually rent for vs. the listed asking? Can we see a recent rent roll and the last 12 months of T-12 income?
- Is there a deadline driving the sale (1031 exchange, divorce, estate, relocation)? That informs how much negotiation room exists.
- Schools are F-rated, which usually means shorter tenancies and higher turnover. Who's the typical renter profile here, and what's been the actual vacancy rate?
- The area grade is low — what's the realistic commute time and amenity access for the typical tenant pool here? Any planned neighborhood developments (good or bad) we should know about?
- What's the average days-on-market for RENTAL listings here right now (not sales)? A rising rental-DOM trend means longer vacancies and softer asking-rent achievability than the comps imply.
- What's the recent tenant-quality profile in this submarket — average credit score on applications, eviction rate, late-payment / NSF rate, and stable-employment percentage? A property-management company in the area should have these aggregated.
- How much new for-sale + rental construction is in the pipeline within 1–3 miles? Heavy new supply typically softens prices + rents 12–24 months out; constrained supply supports both.
Investment metrics
- 1% rule
- 0.59% ✗
- Cap rate
- 4.85%
- Cash-on-cash
- -5.16%
- DSCR
- 0.77
- GRM
- 14.0
CMA / ARV
No comps found within radius.
Projected returns pro-forma
10.0% appreciation · 3.0% rent growth · sell at horizon
- IRR
- 20.6%
- Equity multiple
- 2.67×
- Total profit
- $102,787
- Equity at exit
- $198,103
- IRR
- 18.7%
- Equity multiple
- 6.13×
- Total profit
- $315,717
- Equity at exit
- $427,217
Cash invested: $61,572 (down + closing). Projections, not guarantees.
Landlord ↔ Tenant lean methodology
- Overall (STATE)
- 87 Strongly Landlord-Friendly
- State Tennessee
- 87 Strongly Landlord-Friendly · R+13
- County
- — inherits STATE
- City
- — inherits STATE
ZIP-level market 37325
- Active inventory
- 20
- Price-to-rent
- 14.0×
Monthly cashflow live
- Estimated rent
- $1,307 medium interval (Pro) →
- Mortgage (P&I)
- −$1,153
- Tax from tax record
- −$52 /mo · $630/yr
- Insurance
- −$92
- HOA
- −$0
- Vacancy / Maint / Mgmt
- −$274
- Net cashflow
- $-265
Break-even live
UW: 25.0% down · 7.5% · 30yr · 1.5% tax · 5.0% vac · 8.0% maint · 8.0% mgmt
Financing live
Cash to close
- Down payment
- $54,975
- Closing costs
- $6,597
- Reserves months
- —
- Total cash needed
- —
Loan-product check · same deal, 3 products live
Conventional
25% down · 7.5% · 30yr
- Down + closing
- —
- Monthly P&I
- —
- Monthly cashflow
- —
- DSCR
- —
- Eligible?
- —
Personal DTI + credit; lowest rate.
DSCR
20% down · 8.5% · 30yr
- Down + closing
- —
- Monthly P&I
- —
- Monthly cashflow
- —
- DSCR
- —
- Eligible?
- —
No personal income docs; deal must DSCR.
Hard money
10% down · 12.0% · 12mo
- Down + closing
- —
- Monthly P&I
- —
- Monthly cashflow
- —
- DSCR
- —
- Eligible?
- —
Short-term bridge; refi at stabilization.
Listing history 11 events
-
2026-04-23historical
-
2026-04-22$219,900
-
2025-11-02status Pending
-
2025-11-01historical
-
2025-09-16price $249,900
-
2025-08-06price $259,900
-
2025-07-01price $269,900
-
2025-06-04soldstatus $369,900
-
2025-05-13price $279,900
-
2025-04-12$289,900 Active
-
2025-04-12$249,900
ⓘ Source: listings_history table (triggers on properties + properties_extension) + one-shot
backfill from property_details.listing_events for pre-trigger history.
Tax reassessment forecast TN · Resets to sale price
- Current annual tax
- $630 · $52/mo
- Projected year-2 tax
- $1,561 · $130/mo
- Expected delta
- +$931/yr (+$78/mo · 147.8%)
ⓘ Screening estimate from a state-policy table — verify with the county assessor before closing.
Climate risk First Street
- Flood 1/10 Low FEMA zone X (unshaded) · 0% chance over 30 yrs
- Wildfire 6/10 Major
- Heat 6/10 Major 7 d/yr ≥105°F today · 20 d/yr by 30 yrs out
- Wind 3/10 Moderate 7% chance of damaging wind over 30 yrs
- Air quality 3/10 Moderate 2 unhealthy d/yr today · 2 by 30 yrs out
Nearby sold comps map
Loading sold comps map…
Walkable amenities ~0.75 mi
Loading nearby amenities…
Taxation est. · year 1
- Rental income
- $15,685
- − Mortgage interest
- −$12,318
- − Property taxes
- −$630
- − Insurance
- −$1,100
- − Repairs & maintenance
- −$1,255
- − Management
- −$1,255
- − Depreciation
- −$6,397
- Taxable loss
- −$7,269
- Est. tax savings @ 24.0%
- +$1,745
- After-tax cash flow
- $-1,432/yr
For passive investors: Depreciation is non-cash, so a rental often shows a tax loss while cash-flowing — sheltering income. Rental losses are passive: they offset passive income freely, and up to $25,000/yr can offset ordinary (W-2) income if you actively participate and your MAGI is under $100k (phasing out to $0 by $150k); unused losses carry forward. On sale, claimed depreciation is recaptured at up to 25%, and gains may owe capital-gains tax (a 1031 exchange can defer both). Figures are a year-1 estimate at your 24.0% rate — not tax advice; consult a CPA.
Schools (NCES district)
- District
- Polk County
- NCES district ID
- 4703450
- Math proficiency
- 32% ▼ -6.00%
- Reading proficiency
- 32% ▼ -1.00%
- Median HH income
- $37,990
- Composite
- 26.72/100
- National rank
- #7149
- State rank
- #44 of 139 in TN
Livability — Benton
- Score
- 66/100
- State rank
- #118
- US rank
- #11569
Category grades
Schools grade is shown separately in the Schools card above.
Census & demographics
- Population (ZIP)
- 1,952
Population outlook (Polk County) Hauer SSP2
- Today (2025)
- 16,734 people
- By 2030
- 16,567 · -1.0%
- By 2040
- 16,015 · -4.3%
- By 2050
- 15,172 · -9.3%
- By 2075
- 12,998 · -22.3%
- By 2100
- 10,606 · -36.6%
Race, ethnicity, and origin ACS 2023
- Neighborhood character
- Predominantly White (96%)
- Race & ethnicity
- White 96% Two or more races 3% Hispanic / Latino 1%
- Common ancestry
- Polish 2% Serbian 2% Lithuanian 1%
- Foreign-born
- 4% · Canada, China
- Languages at home
- 89% English-only · German/W. Germanic 10% Spanish 1%
Political lean MEDSL · Polk
- 2024 margin
- Solid R (+68.1) · D 15.5% · R 83.7%
- 2008→2024 swing
- -35.2pp toward R · 2008: -33.0pp · 2024: -68.1pp
- All cycles
- 2024: R+68.1 2020: R+63.4 2016: R+59.0 2012: R+37.2 2008: R+33.0
Not yet ingested
- Civics
- —
Market trends
- HPI YoY
- ▲ 118.08%
- Current HPI
- 433.79
- Rent YoY
- —
- Metro
- —
- State GDP YoY
- ▲ 2.78%
- F500 in state
- 22
Industry mix (Fortune 500 HQ in TN)
| Industry | F500 HQs | Revenue |
|---|---|---|
| Healthcare | 3 | $91B |
|
||
| Retail | 3 | $72B |
|
||
| Transportation / Logistics | 1 | $88B |
|
||
| Paper / Packaging | 1 | $19B |
|
||
| Insurance | 1 | $13B |
|
||
| Energy | 1 | $12B |
|
||
Price history
-12.0% since first listed11 events — show timeline
- 2026-04-23 Delisted — RCAOR
- 2026-04-22 Listed $219,900 RCAOR
- 2025-11-02 Pending — RCAOR
- 2025-11-01 Listing Removed — REALTRACS as Distributed by MLS Grid
- 2025-09-16 Price Changed $249,900 RCAOR
- 2025-08-06 Price Changed $259,900 RCAOR
- 2025-07-01 Price Changed $269,900 RCAOR
- 2025-06-04 Sold (Public Records) $369,900 Public Records
- 2025-05-13 Price Changed $279,900 RCAOR
- 2025-04-12 Listed $289,900 RCAOR
- 2025-04-12 Listed $249,900 REALTRACS as Distributed by MLS Grid
Property tax history
+0.0%/yrLatest (2025): $630 · +0.0% YoY. Source: county tax records.
Cash-flow waterfall
monthlySold comps — $/sqft
last 12 mo · ≤1 miLoading sold comps…