22122 Canal St · Orchard City, CO
Flood risk 3/10 · Minor
- FEMA flood zone
- X (unshaded)
- Chance of flooding over 30 yrs
- 0.2%
- Est. flood insurance / yr
- $507 – $1,088
Fire risk 3/10 · Minor
- Est. fire insurance / yr
- $939 – $1,743
Heat risk 5/10 · Moderate
- Hot days now (above 95°F)
- 5 days/yr
- Hot days in 30 yrs
- 13 days/yr
Wind risk 1/10 · Minimal
- Chance of severe wind over 30 yrs
- —
Air-quality risk 1/10 · Minimal
- Unhealthy air days now
- 0 days/yr
- Unhealthy air days in 30 yrs
- 0 days/yr
Risk factors via First Street. Map © Google.
Why this score? — see what drove the C grade
The composite is a weighted blend of 9 inputs, each scored 0–100. Each bar is that input's sub-score; the figure is the points it added to the 100-point composite (weight × sub-score).
- Cash flow +17.1/30.0
- Appreciation +10.0/10.0
- ARV discount +7.5/15.0
- DSCR +5.3/10.0
- 1% rule +4.6/10.0
- Schools +3.0/10.0
- Livability +2.9/5.0
- Rent growth +2.5/5.0
- Condition / age +2.5/5.0
$95,000
🖨 Deal sheet (PDF) 📄 Offer letter ✓ Due diligence
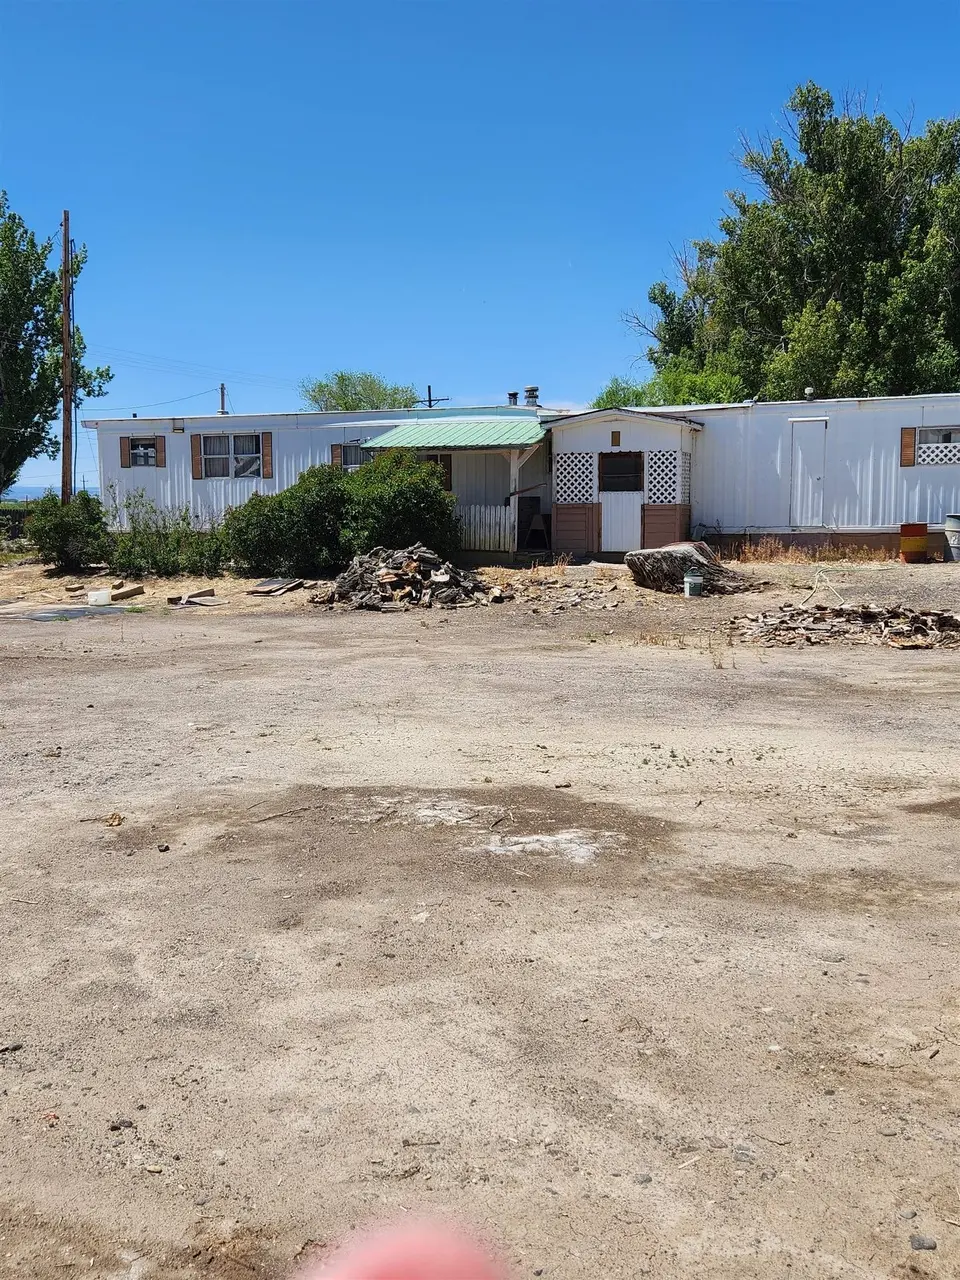
Listing remarks
This is a wonderful chance to own your own land with no HOA, combining affordability with room to expand in the quiet town of Austin, Colorado! The mobile home and land (parcel #:345306204004) will be conveyed with the vacant lot to the east (parcel #:345306204003), providing plenty of room to spread out. While the home is livable, it does need some updating, paint, and a good dusting off to reach its full potential. Includes Washer/Dryer and Refrigerator. RV parking! Shed with power. It is a great opportunity for extra space and growth. Schedule a viewing today!
Key facts
- Vacant lot
- Rv parking
- No hoa
Tags
Property features AI
Finance
- Other: Elevation approximately 5,043 ft; Zoning: RSF; Lot dimensions approximately 14' x 70' x 14' x 70'; Subdivision: Peach Valley Orchard
Exterior
- Parking: Attached garage; 1 garage space; RV access/parking
- Utilities: Public water; Septic tank sewer
- Home design: Single-family residence; One-story; Faces east
- Construction: Metal siding; Metal roof; Built with foundation (details not provided)
- Exterior features: Shed(s); Paved road access; Publicly maintained road; City street frontage
Interior
- Kitchen: Electric oven; Electric range; Gas oven; Gas range; Refrigerator; Disposal
- Flooring: Carpet; Linoleum
- Heating & cooling: Forced air heating (natural gas); Ceiling fans; Evaporative cooling
- Interior features: Ceiling fans; Laminate counters; Window coverings; Wood-burning fireplace
- Laundry & utility: Washer; Dryer; Washer hookup
Neighborhood map
What this means for you Summary
Snapshot
- This is a 2-bed/1.0-bath manufactured listed at $95k.
Deal economics
- At list price, monthly cash flow is $65 ($785/yr) — positive.
- The deal already cash-flows at list — no discount required.
- To meet the 1% rule (rent ≥ 1% of price), the offer needs to be $91k (3.8% below list).
- Recommended offer: $91k (3.8% below list) — sets the bar for 1% rule.
- Cap rate 7.1% vs local median 1.8% in Orchard City — top-decile yield for the area; either an underpriced asset or a hidden risk that comps aren't pricing in. Stress-test before assuming the spread holds.
Location & tenants
- Location reads 57/100 on livability (#316 in CO) — a working-class tenant base; expect higher turnover. Strengths: housing A+, crime B; Watch: amenities F, commute F, health & safety F.
- Delta County Joint District No. 50 (town): math 29% / reading 43% proficiency, ranked #38 of 86 in CO (top 44%) — families likely to look elsewhere, expect single-tenant / working-renter base with shorter leases.
- Zoned schools: Cedaredge Elementary School (math 32% / reading 37%, grade F, #430 of 966 statewide, top 47%, 352 students, 58% FRL); Cedaredge Middle School (math 27% / reading 42%, grade F, #106 of 270 statewide, top 42%, 188 students, 50% FRL); Cedaredge High School (math 34% / reading 64%, grade D, #115 of 381 statewide, top 34%, 296 students, 35% FRL).
- Market conditions: 23 active listings in the ZIP; 113 units permitted in Delta County in 2024 (50 in 5+ unit buildings).
Forward outlook
- In year one you build about $10k of equity ($657 loan paydown + $10k appreciation (10.0% local appreciation)).
- Delta County population projected at -29% by 2050 — secular population decline; favor cash flow + early exit over multi-decade hold.
- At projected returns (10.0% appreciation + 3.0% rent growth), your $27k cash investment doubles in ~3 years — after that, you're playing with house money.
- By year 4, paydown + projected appreciation supports a ~$36k cash-out refi (75% LTV) — recoverable capital for the next deal without selling this one.
Negotiation context
- Only 3 days on market — expect competitive offers; lowballing is unlikely to land.
- 2 sale attempts with the ask held roughly flat each time — persistent listings suggest the price (not the market) is what's stuck; bring a comps-based counter.
Risks & watch-outs
- Climate carrying-cost: extreme-heat days projected 5→13/yr by 2055 (HVAC capex compounding) — expect insurance premiums to compound above CPI over the hold.
Questions for the listing agent
- Built in 1973 — when were the roof, HVAC, electrical panel, plumbing, and water heater last replaced?
- Is there a deadline driving the sale (1031 exchange, divorce, estate, relocation)? That informs how much negotiation room exists.
- Schools are F-rated, which usually means shorter tenancies and higher turnover. Who's the typical renter profile here, and what's been the actual vacancy rate?
- What's the average days-on-market for RENTAL listings here right now (not sales)? A rising rental-DOM trend means longer vacancies and softer asking-rent achievability than the comps imply.
- What's the recent tenant-quality profile in this submarket — average credit score on applications, eviction rate, late-payment / NSF rate, and stable-employment percentage? A property-management company in the area should have these aggregated.
- How much new for-sale + rental construction is in the pipeline within 1–3 miles? Heavy new supply typically softens prices + rents 12–24 months out; constrained supply supports both.
Investment metrics
- 1% rule
- 0.96% ✗
- Cap rate
- 7.12%
- Cash-on-cash
- 2.95%
- DSCR
- 1.13
- GRM
- 8.7
CMA / ARV
No comps found within radius.
Projected returns pro-forma
10.0% appreciation · 3.0% rent growth · sell at horizon
- IRR
- 26.4%
- Equity multiple
- 3.10×
- Total profit
- $55,919
- Equity at exit
- $85,584
- IRR
- 23.2%
- Equity multiple
- 7.07×
- Total profit
- $161,423
- Equity at exit
- $184,564
Cash invested: $26,600 (down + closing). Projections, not guarantees.
Landlord ↔ Tenant lean methodology
- Overall (STATE)
- 38 Tenant-Leaning
- State Colorado
- 38 Tenant-Leaning · D+4
- County
- — inherits STATE
- City
- — inherits STATE
ZIP-level market 81410
- Home prices YoY
- 8.2%
- Active inventory
- 23
- Price-to-rent
- 8.7×
Monthly cashflow live
- Estimated rent
- $914 medium interval (Pro) →
- Mortgage (P&I)
- −$498
- Tax est. 1.5%
- −$119 /mo · $1,425/yr
- Insurance
- −$40
- HOA
- −$0
- Vacancy / Maint / Mgmt
- −$192
- Net cashflow
- $65
Break-even live
Sensitivity live
| Price | -10% $131 | -5% $98 | +0% $65 | +5% $33 | +10% $0 |
|---|---|---|---|---|---|
| Rent | -10% $-7 | -5% $29 | +0% $65 | +5% $101 | +10% $138 |
| Rate | -1.0pp $113 | -0.5pp $90 | base $65 | +0.5pp $41 | +1.0pp $16 |
UW: 25.0% down · 7.5% · 30yr · 1.5% tax · 5.0% vac · 8.0% maint · 8.0% mgmt
Financing live
Cash to close
- Down payment
- $23,750
- Closing costs
- $2,850
- Reserves months
- —
- Total cash needed
- —
Loan-product check · same deal, 3 products live
Conventional
25% down · 7.5% · 30yr
- Down + closing
- —
- Monthly P&I
- —
- Monthly cashflow
- —
- DSCR
- —
- Eligible?
- —
Personal DTI + credit; lowest rate.
DSCR
20% down · 8.5% · 30yr
- Down + closing
- —
- Monthly P&I
- —
- Monthly cashflow
- —
- DSCR
- —
- Eligible?
- —
No personal income docs; deal must DSCR.
Hard money
10% down · 12.0% · 12mo
- Down + closing
- —
- Monthly P&I
- —
- Monthly cashflow
- —
- DSCR
- —
- Eligible?
- —
Short-term bridge; refi at stabilization.
Listing history 3 events
-
2026-05-11status Pending
-
2026-05-07$95,000 Active
-
2026-05-07$95,000 Active
ⓘ Source: listings_history table (triggers on properties + properties_extension) + one-shot
backfill from property_details.listing_events for pre-trigger history.
Climate risk First Street
- Flood 3/10 Moderate FEMA zone X (unshaded) · 20% chance over 30 yrs
- Wildfire 3/10 Moderate
- Heat 5/10 Major 5 d/yr ≥95°F today · 13 d/yr by 30 yrs out
- Wind 1/10 Low
- Air quality 1/10 Low 0 unhealthy d/yr today · 0 by 30 yrs out
Nearby sold comps map
Loading sold comps map…
Walkable amenities ~0.75 mi
Loading nearby amenities…
Taxation est. · year 1
- Rental income
- $10,966
- − Mortgage interest
- −$5,321
- − Property taxes
- −$1,425
- − Insurance
- −$475
- − Repairs & maintenance
- −$877
- − Management
- −$877
- − Depreciation
- −$2,764
- Taxable loss
- −$774
- Est. tax savings @ 24.0%
- +$186
- After-tax cash flow
- $971/yr
For passive investors: Depreciation is non-cash, so a rental often shows a tax loss while cash-flowing — sheltering income. Rental losses are passive: they offset passive income freely, and up to $25,000/yr can offset ordinary (W-2) income if you actively participate and your MAGI is under $100k (phasing out to $0 by $150k); unused losses carry forward. On sale, claimed depreciation is recaptured at up to 25%, and gains may owe capital-gains tax (a 1031 exchange can defer both). Figures are a year-1 estimate at your 24.0% rate — not tax advice; consult a CPA.
Schools (NCES district)
- District
- Delta County Joint District No. 50
- NCES district ID
- 0803330
- Math proficiency
- 29% ▼ -1.00%
- Reading proficiency
- 43% ▼ -4.00%
- Median HH income
- $41,741
- Composite
- 30.33/100
- National rank
- #6268
- State rank
- #38 of 86 in CO
Livability — Orchard City
- Score
- 57/100
- State rank
- #316
- US rank
- #22198
Category grades
Schools grade is shown separately in the Schools card above.
Census & demographics
- Census place
- Orchard City, CO
- City population
- 1,557
- Population (ZIP)
- 1,557
Population outlook (Delta County) Hauer SSP2
- Today (2025)
- 27,529 people
- By 2030
- 25,951 · -5.7%
- By 2040
- 22,510 · -18.2%
- By 2050
- 19,460 · -29.3%
- By 2075
- 14,030 · -49.0%
- By 2100
- 9,093 · -67.0%
Race, ethnicity, and origin ACS 2023
- Neighborhood character
- Predominantly White (88%)
- Race & ethnicity
- White 88% Hispanic / Latino 7% Two or more races 4% Asian 1%
- Hispanic origin (detail)
- Mexican 6%
- Common ancestry
- Portuguese 7% Slovak 6% Iranian 5%
- Foreign-born
- 6% · Canada
- Languages at home
- 97% English-only · Spanish 2% German/W. Germanic 1% Other Asian/Pacific 1%
Political lean MEDSL · Delta
- 2024 margin
- Solid R (+35.5) · D 31.0% · R 66.5% · Other 2.6%
- 2008→2024 swing
- -3.2pp toward R · 2008: -32.3pp · 2024: -35.5pp
- All cycles
- 2024: R+35.5 2020: R+37.1 2016: R+45.2 2012: R+39.7 2008: R+32.3
Not yet ingested
- Civics
- —
Market trends
- HPI YoY
- ▲ 16.66%
- Current HPI
- 220.5691
- Rent YoY
- —
- Metro
- —
- State GDP YoY
- ▲ 1.95%
- F500 in state
- 14
Industry mix (Fortune 500 HQ in CO)
| Industry | F500 HQs | Revenue |
|---|---|---|
| Technology Distribution | 1 | $31B |
|
||
| Food / Agriculture | 1 | $18B |
|
||
| Packaging | 1 | $14B |
|
||
| Healthcare | 1 | $13B |
|
||
| Energy | 1 | $10B |
|
||
| Technology | 1 | $4B |
|
||
Price history
+0.0% since first listed3 events — show timeline
- 2026-05-11 Pending — GJARA
- 2026-05-07 Listed $95,000 cren
- 2026-05-07 Listed $95,000 GJARA
Property tax history
+1.4%/yrLatest (2021): $9 · -40.9% YoY. Source: county tax records.
Cash-flow waterfall
monthlySold comps — $/sqft
last 12 mo · ≤1 miLoading sold comps…