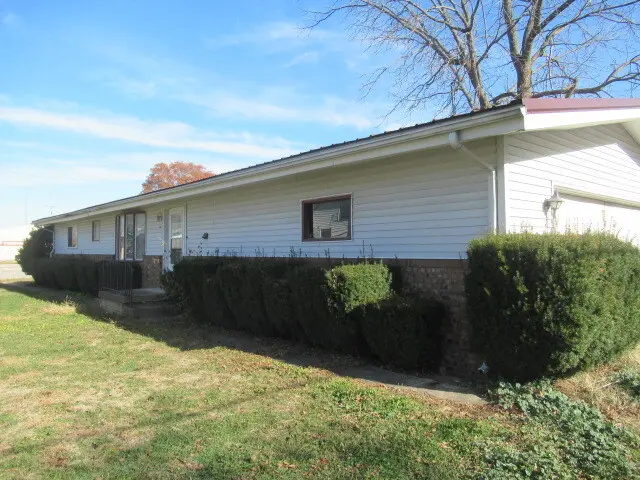
106 W Lincoln Ave · Ogden, IL
Flood risk 1/10 · Minimal
- FEMA flood zone
- X (unshaded)
- Chance of flooding over 30 yrs
- 0.0%
- Est. flood insurance / yr
- $507 – $1,088
Fire risk 1/10 · Minimal
- Est. fire insurance / yr
- $804 – $1,492
Heat risk 3/10 · Minor
- Hot days now (above 104°F)
- 7 days/yr
- Hot days in 30 yrs
- 18 days/yr
Wind risk 2/10 · Minimal
- Chance of severe wind over 30 yrs
- 1.0%
Air-quality risk 1/10 · Minimal
- Unhealthy air days now
- 0 days/yr
- Unhealthy air days in 30 yrs
- 0 days/yr
Risk factors via First Street. Map © Google.
Why this score? — see what drove the B+ grade
The composite is a weighted blend of 9 inputs, each scored 0–100. Each bar is that input's sub-score; the figure is the points it added to the 100-point composite (weight × sub-score).
- Cash flow +25.6/30.0
- ARV discount +15.0/15.0
- Appreciation +10.0/10.0
- DSCR +8.5/10.0
- 1% rule +5.9/10.0
- Schools +5.1/10.0
- Livability +3.2/5.0
- Rent growth +2.5/5.0
- Condition / age +2.5/5.0
$110,250
🖨 Deal sheet (PDF) 📄 Offer letter ✓ Due diligence
Listing remarks MLS
-SELLERS' ADDENDA AND BANK OF AMERICA PREQUALIFICATION REQUIRED ON ALL OFFERS. ATTRACTIVE KITCHEN WITH BREAKFAST BAR. CATHEDRAL CEILING IN LIVING ROOM, DINING ROOM AND KITCHEN. SLIDING DOOR FROM DINING ROOM TO BACK YARD. BAY WINDOW IN LIVING ROOM. OVERSIZED GARAGE.
Key facts
- Spacious dining room
- White countertops
- Antique style hinges
Tags
Property features AI
Finance
- HOA & community: No master association fee required
Exterior
- Parking: Attached garage (2 spaces total)
- Utilities: Public water; Public sewer
- Home design: Detached single manufactured home; Fee simple ownership; Main living area only (single story implied)
- Construction: Vinyl siding; Built approximately 41–50 years ago
- Exterior features: Lot dimensions approximately 56 x 125; Lot under 0.25 acre
Interior
- Kitchen: Kitchen with eating area / breakfast bar (approx. 13 x 11); Range; Dishwasher; Refrigerator; Range hood
- Bedrooms: Master bedroom on main level (approx. 13 x 11); Bedroom on main level (approx. 11 x 9); Bedroom on main level (approx. 10 x 8)
- Flooring: Laminate flooring in dining room; Laminate flooring in living room
- Bathrooms: One full bathroom
- Heating & cooling: Natural gas heating; Central air conditioning
- Interior features: Six total rooms; Separate dining room
- Laundry & utility: Laundry room
Neighborhood map
What this means for you Summary
Snapshot
- This is a 3-bed/1.0-bath single-family listed at $110k.
Deal economics
- At list price, monthly cash flow is $259 ($3k/yr) — positive.
- The deal already cash-flows at list — no discount required.
- Meets the 1% rule at list price ($1k rent vs $110k).
- Recommended offer: $104k (6.0% below list) — sets the bar for market timing.
Location & tenants
- Location reads 63/100 on livability (#806 in IL) — a middle-class / working-renter tenant base. Strengths: cost of living A+, housing A+; Watch: crime C-, amenities F, commute F.
- St Joseph Ogden Chsd 305 (town): math 55% / reading 55% proficiency, ranked #97 of 919 in IL (top 11%) — acceptable for families but not a draw, mixed tenant base, ~2y average lease.
- Zoned schools: Prairieview-Ogden South Elem (math 17% / reading 17%, grade F, #1,141 of 2,056 statewide, top 59%, 128 students, 0% FRL); Prairieview-Ogden Jr High Sch (math 44% / reading 54%, grade C, #51 of 665 statewide, top 9%, 53 students, 0% FRL); St Joseph-Ogden High School (math 52% / reading 42%, grade D-, #53 of 693 statewide, top 8%, 463 students, 0% FRL).
- Zoned-school proficiency averages 38% at this address vs 55% district-wide (-17 pts) — the specific schools serving this property underperform the St Joseph Ogden Chsd 305 average; the district grade overstates school quality for this exact location.
- Market conditions: 4 active listings in the ZIP; 573 units permitted in Champaign County in 2024 (359 in 5+ unit buildings).
Forward outlook
- In year one you build about $12k of equity ($762 loan paydown + $11k appreciation (10.0% local appreciation)).
- Champaign County population projected at +15% by 2050 — modest demand growth; plan on rents tracking national, not racing it.
- At projected returns (10.0% appreciation + 3.0% rent growth), your $31k cash investment doubles in ~2 years — after that, you're playing with house money.
- By year 4, paydown + projected appreciation supports a ~$42k cash-out refi (75% LTV) — recoverable capital for the next deal without selling this one.
Negotiation context
- It's been on market 62 days — a 6% lower offer ($104k) is reasonable based on typical stale-listing flexibility.
- 4 sale attempts since 15y ago with the ask held roughly flat each time — persistent listings suggest the price (not the market) is what's stuck; bring a comps-based counter.
- Current owner paid $32k; list at $110k implies a 243% gain — meaningful room to come down on a strong offer.
Questions for the listing agent
- It's been on market 62 days. Have you received any prior offers? Is the seller open to a 6% concession, seller financing, or rate buy-down credit?
- Built in 1979 — when were the roof, HVAC, electrical panel, plumbing, and water heater last replaced?
- Why hasn't it sold? Are there any deal-killer items the seller is aware of (foundation, flood, title, zoning, code violations)?
- Is there a deadline driving the sale (1031 exchange, divorce, estate, relocation)? That informs how much negotiation room exists.
- Schools are D-rated, which usually means shorter tenancies and higher turnover. Who's the typical renter profile here, and what's been the actual vacancy rate?
- What's the average days-on-market for RENTAL listings here right now (not sales)? A rising rental-DOM trend means longer vacancies and softer asking-rent achievability than the comps imply.
- What's the recent tenant-quality profile in this submarket — average credit score on applications, eviction rate, late-payment / NSF rate, and stable-employment percentage? A property-management company in the area should have these aggregated.
- How much new for-sale + rental construction is in the pipeline within 1–3 miles? Heavy new supply typically softens prices + rents 12–24 months out; constrained supply supports both.
Investment metrics
- 1% rule
- 1.09% ✓
- Cap rate
- 9.11%
- Cash-on-cash
- 10.07%
- DSCR
- 1.45
- GRM
- 7.6
CMA / ARV
- ARV (on-the-fly)
- $192,384
- Comps found
- 6
Show comp detail 6 sales within ~0.75 mi
| Address | Dist | Beds/Ba | Sqft | Sold | Price | $/sf | Match |
|---|---|---|---|---|---|---|---|
| 408 S East Ave | 0.06mi | 3/1.0 | 1,150 (-0%) | 20mo | $155,000 | $135 | 80 |
| 305 E Main St | 0.29mi | 3/1.0 | 1,011 (-12%) | 1mo | $174,900 | $173 | 65 |
| 207 N East Ave | 0.30mi | 2/1.0 (-1) | 1,224 (+6%) | 11mo | $205,000 | $167 | 62 |
| 108 W Main St | 0.17mi | 3/2.0 | 1,293 (+12%) | 13mo | $257,000 | $199 | 56 |
| 510 E Maple St | 0.39mi | 3/2.0 | 1,116 (-3%) | 22mo | $180,000 | $161 | 54 |
| 409 W Broadway St | 0.33mi | 3/2.0 | 1,280 (+11%) | 17mo | $183,000 | $143 | 48 |
Match score weights: distance 35% · size 25% · config 20% · recency 20%. Top-matched comps best support the ARV.
Projected returns pro-forma
10.0% appreciation · 3.0% rent growth · sell at horizon
- IRR
- 31.6%
- Equity multiple
- 3.48×
- Total profit
- $76,525
- Equity at exit
- $99,322
- IRR
- 27.3%
- Equity multiple
- 7.88×
- Total profit
- $212,324
- Equity at exit
- $214,192
Cash invested: $30,870 (down + closing). Projections, not guarantees.
Landlord ↔ Tenant lean methodology
- Overall (STATE)
- 43 Moderately Tenant-Leaning
- State Illinois
- 43 Moderately Tenant-Leaning · D+7
- County
- — inherits STATE
- City
- — inherits STATE
ZIP-level market 61859
- Home prices YoY
- 10.4%
- Active inventory
- 4
- Price-to-rent
- 7.6×
Monthly cashflow live
- Estimated rent
- $1,204 medium interval (Pro) →
- Mortgage (P&I)
- −$578
- Tax from tax record
- −$68 /mo · $812/yr
- Insurance
- −$46
- HOA
- −$0
- Vacancy / Maint / Mgmt
- −$253
- Net cashflow
- $259
Break-even live
Sensitivity live
| Price | -10% $322 | -5% $290 | +0% $259 | +5% $228 | +10% $197 |
|---|---|---|---|---|---|
| Rent | -10% $164 | -5% $212 | +0% $259 | +5% $307 | +10% $354 |
| Rate | -1.0pp $315 | -0.5pp $287 | base $259 | +0.5pp $231 | +1.0pp $202 |
UW: 25.0% down · 7.5% · 30yr · 1.5% tax · 5.0% vac · 8.0% maint · 8.0% mgmt
Financing live
Cash to close
- Down payment
- $27,562
- Closing costs
- $3,308
- Reserves months
- —
- Total cash needed
- —
Loan-product check · same deal, 3 products live
Conventional
25% down · 7.5% · 30yr
- Down + closing
- —
- Monthly P&I
- —
- Monthly cashflow
- —
- DSCR
- —
- Eligible?
- —
Personal DTI + credit; lowest rate.
DSCR
20% down · 8.5% · 30yr
- Down + closing
- —
- Monthly P&I
- —
- Monthly cashflow
- —
- DSCR
- —
- Eligible?
- —
No personal income docs; deal must DSCR.
Hard money
10% down · 12.0% · 12mo
- Down + closing
- —
- Monthly P&I
- —
- Monthly cashflow
- —
- DSCR
- —
- Eligible?
- —
Short-term bridge; refi at stabilization.
Listing history 29 events
-
2026-06-21days on market $110,250 Active 62 DOM
-
2026-06-18days on market $110,250 Active 59 DOM
-
2026-06-17days on market $110,250 Active 58 DOM
-
2026-06-16days on market $110,250 Active 57 DOM
-
2026-06-15days on market $110,250 Active 56 DOM
-
2026-06-14days on market $110,250 Active 54 DOM
-
2026-06-13days on market $110,250 Active 53 DOM
-
2026-06-10days on market $110,250 Active 51 DOM
-
2026-06-09days on market $110,250 Active 50 DOM
-
2026-06-08days on market $110,250 Active 49 DOM
-
2026-06-07days on market $110,250 Active 48 DOM
-
2026-06-03days on market $110,250 Active 44 DOM
-
2026-06-02days on market $110,250 Active 43 DOM
-
2026-06-01days on market $110,250 Active 42 DOM
-
2026-05-31days on market $110,250 Active 41 DOM
-
2026-05-30days on market $110,250 Active 40 DOM
-
2026-04-19$110,250 Active
-
2025-05-01status Temporarily No Showings
-
2025-05-01historical
-
2025-02-12historical
-
2025-02-04price
-
2025-01-27price
-
2025-01-07price
-
2024-12-29Active
-
2011-08-25soldstatus $32,100 265-char remark
Show marketing remark (265 chars)
-SELLERS' ADDENDA AND BANK OF AMERICA PREQUALIFICATION REQUIRED ON ALL OFFERS. ATTRACTIVE KITCHEN WITH BREAKFAST BAR. CATHEDRAL CEILING IN LIVING ROOM, DINING ROOM AND KITCHEN. SLIDING DOOR FROM DINING ROOM TO BACK YARD. BAY WINDOW IN LIVING ROOM. OVERSIZED GARAGE.
-
2011-07-22historical 265-char remark
Show marketing remark (265 chars)
-SELLERS' ADDENDA AND BANK OF AMERICA PREQUALIFICATION REQUIRED ON ALL OFFERS. ATTRACTIVE KITCHEN WITH BREAKFAST BAR. CATHEDRAL CEILING IN LIVING ROOM, DINING ROOM AND KITCHEN. SLIDING DOOR FROM DINING ROOM TO BACK YARD. BAY WINDOW IN LIVING ROOM. OVERSIZED GARAGE.
-
2011-07-15$33,000 265-char remark
Show marketing remark (265 chars)
-SELLERS' ADDENDA AND BANK OF AMERICA PREQUALIFICATION REQUIRED ON ALL OFFERS. ATTRACTIVE KITCHEN WITH BREAKFAST BAR. CATHEDRAL CEILING IN LIVING ROOM, DINING ROOM AND KITCHEN. SLIDING DOOR FROM DINING ROOM TO BACK YARD. BAY WINDOW IN LIVING ROOM. OVERSIZED GARAGE.
-
1995-12-15soldstatus $28,333
-
1995-12-15soldstatus $28,333
ⓘ Source: listings_history table (triggers on properties + properties_extension) + one-shot
backfill from property_details.listing_events for pre-trigger history.
Tax reassessment forecast IL · Partial reset (capped growth)
- Current annual tax
- $812 · $68/mo
- Projected year-2 tax
- $1,657 · $138/mo
- Expected delta
- +$845/yr (+$70/mo · 104.1%)
ⓘ Screening estimate from a state-policy table — verify with the county assessor before closing.
Climate risk First Street
- Flood 1/10 Low FEMA zone X (unshaded) · 0% chance over 30 yrs
- Wildfire 1/10 Low
- Heat 3/10 Moderate 7 d/yr ≥104°F today · 18 d/yr by 30 yrs out
- Wind 2/10 Low 100% chance of damaging wind over 30 yrs
- Air quality 1/10 Low 0 unhealthy d/yr today · 0 by 30 yrs out
Nearby sold comps map
Loading sold comps map…
Walkable amenities ~0.75 mi
Loading nearby amenities…
Taxation est. · year 1
- Rental income
- $14,444
- − Mortgage interest
- −$6,176
- − Property taxes
- −$812
- − Insurance
- −$551
- − Repairs & maintenance
- −$1,156
- − Management
- −$1,156
- − Depreciation
- −$3,207
- Taxable income
- $1,387
- Est. tax owed @ 24.0%
- −$333
- After-tax cash flow
- $2,777/yr
For passive investors: Depreciation is non-cash, so a rental often shows a tax loss while cash-flowing — sheltering income. Rental losses are passive: they offset passive income freely, and up to $25,000/yr can offset ordinary (W-2) income if you actively participate and your MAGI is under $100k (phasing out to $0 by $150k); unused losses carry forward. On sale, claimed depreciation is recaptured at up to 25%, and gains may owe capital-gains tax (a 1031 exchange can defer both). Figures are a year-1 estimate at your 24.0% rate — not tax advice; consult a CPA.
Schools (NCES district)
- District
- St Joseph Ogden Chsd 305
- NCES district ID
- 1737410
- Math proficiency
- 55% ▬ 0.00%
- Reading proficiency
- 55% ▬ 0.00%
- Median HH income
- $72,624
- Composite
- 50.9/100
- National rank
- #3854
- State rank
- #97 of 919 in IL
Livability — Ogden
- Score
- 63/100
- State rank
- #806
- US rank
- #15962
Category grades
Schools grade is shown separately in the Schools card above.
Census & demographics
- Census place
- Ogden, IL
- Population (ZIP)
- 1,271
Population outlook (Champaign County) Hauer SSP2
- Today (2025)
- 223,848 people
- By 2030
- 231,416 · +3.4%
- By 2040
- 244,321 · +9.1%
- By 2050
- 256,432 · +14.6%
- By 2075
- 285,823 · +27.7%
- By 2100
- 296,406 · +32.4%
Race, ethnicity, and origin ACS 2023
- Neighborhood character
- Predominantly White (93%)
- Race & ethnicity
- White 93% Asian 3% Two or more races 2% Hispanic / Latino 2%
- Common ancestry
- Italian 4% Romanian 3% Slovak 1%
- Foreign-born
- 2%
- Languages at home
- 96% English-only · Other Indo-European 3%
Political lean MEDSL · Champaign
- 2024 margin
- Strong D (+24.1) · D 61.3% · R 37.2% · Other 1.5%
- 2008→2024 swing
- +6.6pp toward D · 2008: 17.5pp · 2024: 24.1pp
- All cycles
- 2024: D+24.1 2020: D+22.8 2016: D+18.4 2012: D+6.8 2008: D+17.5
Not yet ingested
- Civics
- —
Market trends
- HPI YoY
- ▲ 26.92%
- Current HPI
- 285.1487
- Rent YoY
- —
- Metro
- —
- State GDP YoY
- ▲ 1.59%
- F500 in state
- 60
Industry mix (Fortune 500 HQ in IL)
| Industry | F500 HQs | Revenue |
|---|---|---|
| Insurance | 4 | $201B |
|
||
| Consumer Goods | 4 | $87B |
|
||
| Industrial Machinery | 3 | $64B |
|
||
| Healthcare | 2 | $55B |
|
||
| Retail / Pharmacy | 1 | $148B |
|
||
| Agriculture / Food | 1 | $86B |
|
||
Price history
+289.1% since first listed13 events — show timeline
- 2026-04-19 Listed $110,250 MRED as Distributed by MLS Grid
- 2025-05-01 Relisted — MRED as Distributed by MLS Grid
- 2025-05-01 Listing Removed — MRED as Distributed by MLS Grid
- 2025-02-12 Listing Removed — MRED as Distributed by MLS Grid
- 2025-02-04 Price Changed — MRED as Distributed by MLS Grid
- 2025-01-27 Price Changed — MRED as Distributed by MLS Grid
- 2025-01-07 Price Changed — MRED as Distributed by MLS Grid
- 2024-12-29 Listed — MRED as Distributed by MLS Grid
- 2011-08-25 Sold (MLS) $32,100 MRED as Distributed by MLS Grid
- 2011-07-22 Listing Removed — MRED as Distributed by MLS Grid
- 2011-07-15 Listed $33,000 MRED as Distributed by MLS Grid
- 1995-12-15 Sold (Public Records) $28,333 Public Records
- 1995-12-15 Sold (Public Records) $28,333 Public Records
Property tax history
+7.0%/yrLatest (2024): $812 · +10.2% YoY. Source: county tax records.
Cash-flow waterfall
monthlySold comps — $/sqft
last 12 mo · ≤1 miLoading sold comps…