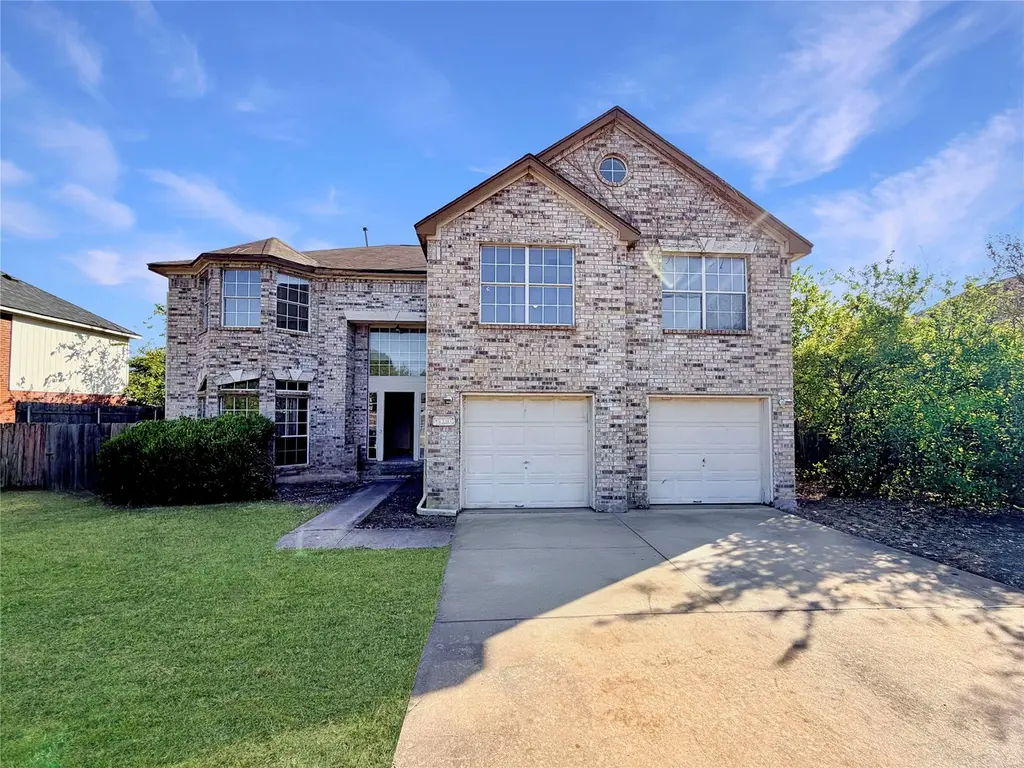
1106 Thistle Trl · Cedar Park, TX
Flood risk 1/10 · Minimal
- FEMA flood zone
- X (unshaded)
- Chance of flooding over 30 yrs
- 0.0%
- Est. flood insurance / yr
- $507 – $1,088
Fire risk 2/10 · Minimal
- Est. fire insurance / yr
- $1,222 – $2,270
Heat risk 8/10 · Major
- Hot days now (above 107°F)
- 7 days/yr
- Hot days in 30 yrs
- 23 days/yr
Wind risk 6/10 · Moderate
- Chance of severe wind over 30 yrs
- 70.0%
Air-quality risk 2/10 · Minimal
- Unhealthy air days now
- 1 days/yr
- Unhealthy air days in 30 yrs
- 1 days/yr
Risk factors via First Street. Map © Google.
Why this score? — see what drove the D grade
The composite is a weighted blend of 9 inputs, each scored 0–100. Each bar is that input's sub-score; the figure is the points it added to the 100-point composite (weight × sub-score).
- ARV discount +15.0/15.0
- Cash flow +9.0/30.0
- Schools +4.8/10.0
- 1% rule +4.3/10.0
- DSCR +2.5/10.0
- Livability +2.5/5.0
- Condition / age +2.5/5.0
- Rent growth +1.7/5.0
- Appreciation +0.0/10.0
$369,000
🖨 Deal sheet (PDF) 📄 Offer letter ✓ Due diligence
Listing remarks MLS
This is a great opportunity to own a home in Cedar Park, located in the highly sought-after subdivision of Buttercup Creek. To help visualize this homes floor plan and to highlight its potential virtual furnishings may have been added to photos found in this listing.
Key facts
- 9,931 sq ft lot
- 2 garage spots
- Built 1991
Neighborhood map
What this means for you Summary
Snapshot
- This is a 4-bed/2.5-bath single-family listed at $369k.
Deal economics
- At list price, monthly cash flow is $-290 ($-3k/yr) — negative.
- To cash-flow at today's rent, offer at most $318k (13.9% below list).
- To meet the 1% rule (rent ≥ 1% of price), the offer needs to be $344k (6.8% below list).
- Recommended offer: $318k (13.9% below list) — sets the bar for cash-flow.
- Cap rate 5.4% vs local median 2.0% in Cedar Park — top-decile yield for the area; either an underpriced asset or a hidden risk that comps aren't pricing in. Stress-test before assuming the spread holds.
Location & tenants
- Location reads: area grade D — affects rentability + tenant quality, not the cash-flow math above.
- Leander ISD (suburban): math 50% / reading 54% proficiency, ranked #100 of 826 in TX (top 12%) — acceptable for families but not a draw, mixed tenant base, ~2y average lease; only 19% free/reduced lunch — higher-income household profile.
- Zoned schools: Ada Mae Faubion El (math 32% / reading 37%, grade F, #1,995 of 4,322 statewide, top 50%, 402 students, 39% FRL); Artie L Henry Middle (math 53% / reading 52%, grade C+, #293 of 1,662 statewide, top 18%, 1,254 students, 23% FRL); Vista Ridge H S (math 57% / reading 56%, grade C, #357 of 1,632 statewide, top 22%, 2,646 students, 16% FRL).
- Market conditions: Rents falling (-3.4%/yr); 388 active listings in the ZIP; 11 comparable units currently listed for rent nearby; rentals at typical pace (median 17d on market — plan ~3-4 weeks tenant-placement turnaround); high-income renter base; 7,543 units permitted in Williamson County in 2024 (1,425 in 5+ unit buildings).
- This rent runs 33% of the median local income ($125k/yr) — at the standard rent-burdened threshold; future hikes will face affordability resistance.
Forward outlook
- Local home prices are declining (-3.0%/yr); year-one equity from $3k of loan paydown is wiped out by about $11k of value loss. Plan a longer hold.
- Williamson County population projected at +69% by 2050 — long-run rental-demand tailwind backs the buy-and-hold thesis.
Negotiation context
- It's been on market 219 days — a 12% lower offer ($325k) is reasonable based on typical stale-listing flexibility.
- 5 sale attempts since 23y ago; this cycle's ask has dropped $56k (13%) from the opening price — seller is motivated, your offer sets the floor, not the list.
Risks & watch-outs
- Watch-outs: property tax is 3.0% of price.
- Climate carrying-cost: major wind risk, 70% chance of damaging wind over 30y; extreme-heat days projected 7→23/yr by 2055 (HVAC capex compounding) — expect insurance premiums to compound above CPI over the hold.
Questions for the listing agent
- What do current leases actually rent for vs. the listed asking? Can we see a recent rent roll and the last 12 months of T-12 income?
- It's been on market 219 days. Have you received any prior offers? Is the seller open to a 14% concession, seller financing, or rate buy-down credit?
- Property tax is high relative to price — has the assessment been appealed recently, and will the sale trigger a re-assessment?
- Why hasn't it sold? Are there any deal-killer items the seller is aware of (foundation, flood, title, zoning, code violations)?
- Is there a deadline driving the sale (1031 exchange, divorce, estate, relocation)? That informs how much negotiation room exists.
- The area grade is low — what's the realistic commute time and amenity access for the typical tenant pool here? Any planned neighborhood developments (good or bad) we should know about?
- What's the average days-on-market for RENTAL listings here right now (not sales)? A rising rental-DOM trend means longer vacancies and softer asking-rent achievability than the comps imply.
- What's the recent tenant-quality profile in this submarket — average credit score on applications, eviction rate, late-payment / NSF rate, and stable-employment percentage? A property-management company in the area should have these aggregated.
- How much new for-sale + rental construction is in the pipeline within 1–3 miles? Heavy new supply typically softens prices + rents 12–24 months out; constrained supply supports both.
Investment metrics
- 1% rule
- 0.93% ✗
- Cap rate
- 5.35%
- Cash-on-cash
- -3.36%
- DSCR
- 0.85
- GRM
- 8.9
CMA / ARV
- ARV (median comp)
- $590,168
- List price
- $369,000
- Delta
- -37.48%
- Verdict
- UNDERPRICED
- Comps
- 20 within 1.0 mi
Show comp detail 12 sales within ~0.75 mi
| Address | Dist | Beds/Ba | Sqft | Sold | Price | $/sf | Match |
|---|---|---|---|---|---|---|---|
| 738 Nelson Ranch Rd | 0.23mi | 4/2.5 | 3,430 (-3%) | 3mo | $599,000 | $175 | 81 |
| 740 Nelson Ranch Rd | 0.22mi | 5/3.0 (+1) | 3,751 (+6%) | 11mo | $750,000 | $200 | 64 |
| 109 S Big Sur Dr | 0.38mi | 4/3.5 | 3,235 (-9%) | 6mo | $879,000 | $272 | 58 |
| 1113 Red Ranch Cir | 0.61mi | 4/2.5 | 3,096 (-13%) | 5mo | $550,000 | $178 | 46 |
| 502 Madisons Way | 0.68mi | 4/3.5 | 3,182 (-10%) | 1mo | $735,000 | $231 | 46 |
| 703 Hegarty Dr | 0.63mi | 4/3.0 | 3,076 (-13%) | 1mo | $717,999 | $233 | 46 |
| 1105 Red Ranch Cir | 0.58mi | 4/3.0 | 3,156 (-11%) | 10mo | $675,000 | $214 | 44 |
| 807 Lone Buck Pass | 0.63mi | 4/2.5 | 3,071 (-14%) | 5mo | $575,000 | $187 | 44 |
| 1006 Cedar Park Dr | 0.65mi | 4/4.5 | 3,325 (-6%) | 8mo | $1,299,999 | $391 | 44 |
| 1606 Hughes Dr | 0.68mi | 4/2.5 | 3,150 (-11%) | 8mo | $544,000 | $173 | 43 |
| 504 Madisons Way | 0.68mi | 3/2.5 (-1) | 3,124 (-12%) | 4mo | $550,000 | $176 | 40 |
| 1019 Lone Buck Pass | 0.66mi | 5/3.5 (+1) | 3,909 (+10%) | 11mo | $739,000 | $189 | 35 |
Match score weights: distance 35% · size 25% · config 20% · recency 20%. Top-matched comps best support the ARV.
Projected returns pro-forma
-3.0% appreciation · 0.0% rent growth · sell at horizon
- IRR
- -25.9%
- Equity multiple
- 0.15×
- Total profit
- $-87,993
- Equity at exit
- $55,019
- IRR
- -40.7%
- Equity multiple
- -0.34×
- Total profit
- $-137,993
- Equity at exit
- $31,904
Cash invested: $103,320 (down + closing). Projections, not guarantees.
Landlord ↔ Tenant lean methodology
- Overall (STATE)
- 87 Strongly Landlord-Friendly
- State Texas
- 87 Strongly Landlord-Friendly · R+5
- County
- — inherits STATE
- City
- — inherits STATE
ZIP-level market 78613
- Home prices YoY
- -32.3%
- Rents YoY
- -3.4%
- Active inventory
- 388
- Price-to-rent
- 8.9×
Monthly cashflow live
- Estimated rent
- $3,441 high interval (Pro) →
- Mortgage (P&I)
- −$1,935
- Tax from tax record
- −$919 /mo · $11,028/yr
- Insurance
- −$154
- HOA
- −$0
- Vacancy / Maint / Mgmt
- −$723
- Net cashflow
- $-290
Break-even live
Sensitivity live
| Price | -10% $-81 | -5% $-185 | +0% $-290 | +5% $-394 | +10% $-499 |
|---|---|---|---|---|---|
| Rent | -10% $-561 | -5% $-426 | +0% $-290 | +5% $-154 | +10% $-18 |
| Rate | -1.0pp $-104 | -0.5pp $-196 | base $-290 | +0.5pp $-385 | +1.0pp $-483 |
UW: 25.0% down · 7.5% · 30yr · 1.5% tax · 5.0% vac · 8.0% maint · 8.0% mgmt
Financing live
Cash to close
- Down payment
- $92,250
- Closing costs
- $11,070
- Reserves months
- —
- Total cash needed
- —
Loan-product check · same deal, 3 products live
Conventional
25% down · 7.5% · 30yr
- Down + closing
- —
- Monthly P&I
- —
- Monthly cashflow
- —
- DSCR
- —
- Eligible?
- —
Personal DTI + credit; lowest rate.
DSCR
20% down · 8.5% · 30yr
- Down + closing
- —
- Monthly P&I
- —
- Monthly cashflow
- —
- DSCR
- —
- Eligible?
- —
No personal income docs; deal must DSCR.
Hard money
10% down · 12.0% · 12mo
- Down + closing
- —
- Monthly P&I
- —
- Monthly cashflow
- —
- DSCR
- —
- Eligible?
- —
Short-term bridge; refi at stabilization.
Rent comps 11 comps
| Address | Beds | Baths | Sqft | Rent | $/sqft | DOM | Units | Dist |
|---|---|---|---|---|---|---|---|---|
| 109 S Big Sur Dr Cedar Park, TX | 4.0 | 3.5 | 3234 | $6,000 | $1.86 | 16d | 1 | 0.37mi |
| 1703 Elkins Ln Cedar Park, TX | 4.0 | 3.5 | 3016 | $2,899 | $0.96 | 19d | 1 | 0.63mi |
| 1204 Stepp Bnd Cedar Park, TX | 4.0 | 2.5 | 2529 | $2,495 | $0.99 | 6d | 1 | 0.74mi |
| 1832 Nelson Ranch Loop Cedar Park, TX | 4.0 | 3.0 | 2741 | $2,600 | $0.95 | 14d | 1 | 1.00mi |
| 1302 Hunter Ace Way Cedar Park, TX | 4.0 | 3.0 | 3346 | $2,999 | $0.90 | 0d | 1 | 1.02mi |
| 2405 Erica Kaitlin Ln Cedar Park, TX | 4.0 | 3.0 | 2502 | $2,500 | $1.00 | 25d | 1 | 1.27mi |
| 1621 Liberty Oaks Blvd Cedar Park, TX | 4.0 | 2.0 | 2547 | $2,749 | $1.08 | 19d | 1 | 1.29mi |
| 1621 Liberty Oaks Blvd Cedar Park, TX | 4.0 | 2.0 | 2547 | $2,749 | $1.08 | 0d | 1 | 1.29mi |
| 1400 Little Elm Trl Unit 1206 Cedar Park, TX | 4.0 | 3.5 | 3078 | $3,495 | $1.14 | 16d | 1 | 1.42mi |
| 1400 Little Elm Trl Unit 1404 Cedar Park, TX | 4.0 | 3.5 | 3000 | $3,800 | $1.27 | 45d | 1 | 1.42mi |
| 1400 Little Elm Trl Cedar Park, TX | 5.0 | 4.0 | 3915 | $3,895 | $0.99 | 23d | 1 | 1.42mi |
Listing history 29 events
-
2026-06-21days on market $369,000 Active 219 DOM
-
2026-06-18days on market $369,000 Active 216 DOM
-
2026-06-17days on market $369,000 Active 215 DOM
-
2026-06-15days on market $369,000 Active 213 DOM
-
2026-06-13days on market $369,000 Active 211 DOM
-
2026-06-09days on market $369,000 Active 207 DOM
-
2026-06-08days on market $369,000 Active 206 DOM
-
2026-06-07days on market $369,000 Active 205 DOM
-
2026-06-05days on market $369,000 Active 202 DOM
-
2026-06-03days on market $369,000 Active 201 DOM
-
2026-06-02days on market $369,000 Active 200 DOM
-
2026-06-01days on market $369,000 Active 199 DOM
-
2026-05-31days on market $369,000 Active 198 DOM
-
2026-05-11status Active 267-char remark
Show marketing remark (267 chars)
This is a great opportunity to own a home in Cedar Park, located in the highly sought-after subdivision of Buttercup Creek. To help visualize this homes floor plan and to highlight its potential virtual furnishings may have been added to photos found in this listing.
-
2026-04-27status Pending 267-char remark
Show marketing remark (267 chars)
This is a great opportunity to own a home in Cedar Park, located in the highly sought-after subdivision of Buttercup Creek. To help visualize this homes floor plan and to highlight its potential virtual furnishings may have been added to photos found in this listing.
-
2026-04-17historical Active Under Contract 267-char remark
Show marketing remark (267 chars)
This is a great opportunity to own a home in Cedar Park, located in the highly sought-after subdivision of Buttercup Creek. To help visualize this homes floor plan and to highlight its potential virtual furnishings may have been added to photos found in this listing.
-
2026-04-07price $369,000 267-char remark
Show marketing remark (267 chars)
This is a great opportunity to own a home in Cedar Park, located in the highly sought-after subdivision of Buttercup Creek. To help visualize this homes floor plan and to highlight its potential virtual furnishings may have been added to photos found in this listing.
-
2026-02-23price $375,000 267-char remark
Show marketing remark (267 chars)
This is a great opportunity to own a home in Cedar Park, located in the highly sought-after subdivision of Buttercup Creek. To help visualize this homes floor plan and to highlight its potential virtual furnishings may have been added to photos found in this listing.
-
2026-01-14price $399,900 267-char remark
Show marketing remark (267 chars)
This is a great opportunity to own a home in Cedar Park, located in the highly sought-after subdivision of Buttercup Creek. To help visualize this homes floor plan and to highlight its potential virtual furnishings may have been added to photos found in this listing.
-
2025-12-12price $419,000 267-char remark
Show marketing remark (267 chars)
This is a great opportunity to own a home in Cedar Park, located in the highly sought-after subdivision of Buttercup Creek. To help visualize this homes floor plan and to highlight its potential virtual furnishings may have been added to photos found in this listing.
-
2025-10-31$425,000 Active 267-char remark
Show marketing remark (267 chars)
This is a great opportunity to own a home in Cedar Park, located in the highly sought-after subdivision of Buttercup Creek. To help visualize this homes floor plan and to highlight its potential virtual furnishings may have been added to photos found in this listing.
-
2003-07-28soldstatus
-
2003-07-25soldstatus 17-char remark
Show marketing remark (17 chars)
Restrictions: Yes
-
2003-07-12historical 17-char remark
Show marketing remark (17 chars)
Restrictions: Yes
-
2003-06-14$214,990 17-char remark
Show marketing remark (17 chars)
Restrictions: Yes
-
2003-06-12historical
-
2003-04-14historical
-
2003-04-14
-
2003-02-11
ⓘ Source: listings_history table (triggers on properties + properties_extension) + one-shot
backfill from property_details.listing_events for pre-trigger history.
Tax reassessment forecast TX · Resets to sale price
- Current annual tax
- $11,028 · $919/mo
- Projected year-2 tax
- $11,028 · $919/mo
- Expected delta
- $0/yr ($0/mo · 0.0%)
ⓘ Screening estimate from a state-policy table — verify with the county assessor before closing.
Climate risk First Street
- Flood 1/10 Low FEMA zone X (unshaded) · 0% chance over 30 yrs
- Wildfire 2/10 Low
- Heat 8/10 Severe 7 d/yr ≥107°F today · 23 d/yr by 30 yrs out
- Wind 6/10 Major 70% chance of damaging wind over 30 yrs
- Air quality 2/10 Low 1 unhealthy d/yr today · 1 by 30 yrs out
Nearby sold comps map
Loading sold comps map…
Walkable amenities ~0.75 mi
Loading nearby amenities…
Taxation est. · year 1
- Rental income
- $41,289
- − Mortgage interest
- −$20,670
- − Property taxes
- −$11,028
- − Insurance
- −$1,845
- − Repairs & maintenance
- −$3,303
- − Management
- −$3,303
- − Depreciation
- −$10,735
- Taxable loss
- −$9,595
- Est. tax savings @ 24.0%
- +$2,303
- After-tax cash flow
- $-1,173/yr
For passive investors: Depreciation is non-cash, so a rental often shows a tax loss while cash-flowing — sheltering income. Rental losses are passive: they offset passive income freely, and up to $25,000/yr can offset ordinary (W-2) income if you actively participate and your MAGI is under $100k (phasing out to $0 by $150k); unused losses carry forward. On sale, claimed depreciation is recaptured at up to 25%, and gains may owe capital-gains tax (a 1031 exchange can defer both). Figures are a year-1 estimate at your 24.0% rate — not tax advice; consult a CPA.
Schools (NCES district)
- District
- Leander ISD
- NCES district ID
- 4827030
- Math proficiency
- 50% ▼ -16.00%
- Reading proficiency
- 54% ▼ -11.00%
- Median HH income
- $84,527
- Composite
- 47.73/100
- National rank
- #2238
- State rank
- #100 of 826 in TX
Livability — Cedar Park
No livability data for this city. (Only ~50 U.S. cities are tracked.)
Census & demographics
- Census place
- Cedar Park, TX
- County
- Williamson County · 680,029 people
- City population
- 89,956
- Metro
- Austin-Round Rock-Georgetown, TX
- Population (ZIP)
- 89,956
- Household income
- $125,487
- Rent vs Own
- Severe rent burden
- 2478.0
Population outlook (Williamson County) Hauer SSP2
- Today (2025)
- 699,027 people
- By 2030
- 795,537 · +13.8%
- By 2040
- 990,683 · +41.7%
- By 2050
- 1,184,292 · +69.4%
- By 2075
- 1,623,825 · +132.3%
- By 2100
- 1,924,153 · +175.3%
Race, ethnicity, and origin ACS 2023
- Neighborhood character
- Diverse neighborhood (Simpson 0.59)
- Race & ethnicity
- White 60% Hispanic / Latino 18% Asian 13% Two or more races 11% Black 3%
- Hispanic origin (detail)
- Mexican 13%
- Common ancestry
- Slovak 3% Italian 3% Lithuanian 2%
- Foreign-born
- 17% · Canada, China, South Korea
- Languages at home
- 76% English-only · Spanish 9% Other Asian/Pacific 4% Other Indo-European 3%
Political lean MEDSL · Williamson
- 2024 margin
- Toss-up / Even · D 48.0% · R 50.4% · Other 1.6%
- 2008→2024 swing
- +10.6pp toward D · 2008: -13.0pp · 2024: -2.5pp
- All cycles
- 2024: R+2.5 2020: D+1.4 2016: R+9.9 2012: R+21.5 2008: R+13.0
Not yet ingested
- Civics
- —
Market trends
- HPI YoY
- ▼ -120.11%
- Current HPI
- 252.0798
- Rent YoY
- ▼ -3.37%
- Metro
- Austin-Round Rock-Georgetown, TX
- State GDP YoY
- ▲ 3.95%
- F500 in state
- 110
Industry mix (Fortune 500 HQ in TX)
| Industry | F500 HQs | Revenue |
|---|---|---|
| Energy | 16 | $1,198B |
|
||
| Technology | 5 | $198B |
|
||
| Engineering / Construction | 4 | $72B |
|
||
| Energy Services | 3 | $60B |
|
||
| Utilities | 3 | $41B |
|
||
| Healthcare | 2 | $330B |
|
||
Price history
+71.6% since first listed16 events — show timeline
- 2026-05-11 Relisted — Unlock MLS
- 2026-04-27 Pending — Unlock MLS
- 2026-04-17 Contingent — Unlock MLS
- 2026-04-07 Price Changed $369,000 Unlock MLS
- 2026-02-23 Price Changed $375,000 Unlock MLS
- 2026-01-14 Price Changed $399,900 Unlock MLS
- 2025-12-12 Price Changed $419,000 Unlock MLS
- 2025-10-31 Listed $425,000 Unlock MLS
- 2003-07-28 Sold (Public Records) — Public Records
- 2003-07-25 Sold (MLS) — Unlock MLS
- 2003-07-12 Delisted — Unlock MLS
- 2003-06-14 Listed $214,990 Unlock MLS
- 2003-06-12 Delisted — Unlock MLS
- 2003-04-14 Listed — Unlock MLS
- 2003-04-14 Delisted — Unlock MLS
- 2003-02-11 Listed — Unlock MLS
Property tax history
+3.9%/yrLatest (2026): $11,028 · -0.2% YoY. Source: county tax records.
Cash-flow waterfall
monthlySold comps — $/sqft
last 12 mo · ≤1 miLoading sold comps…