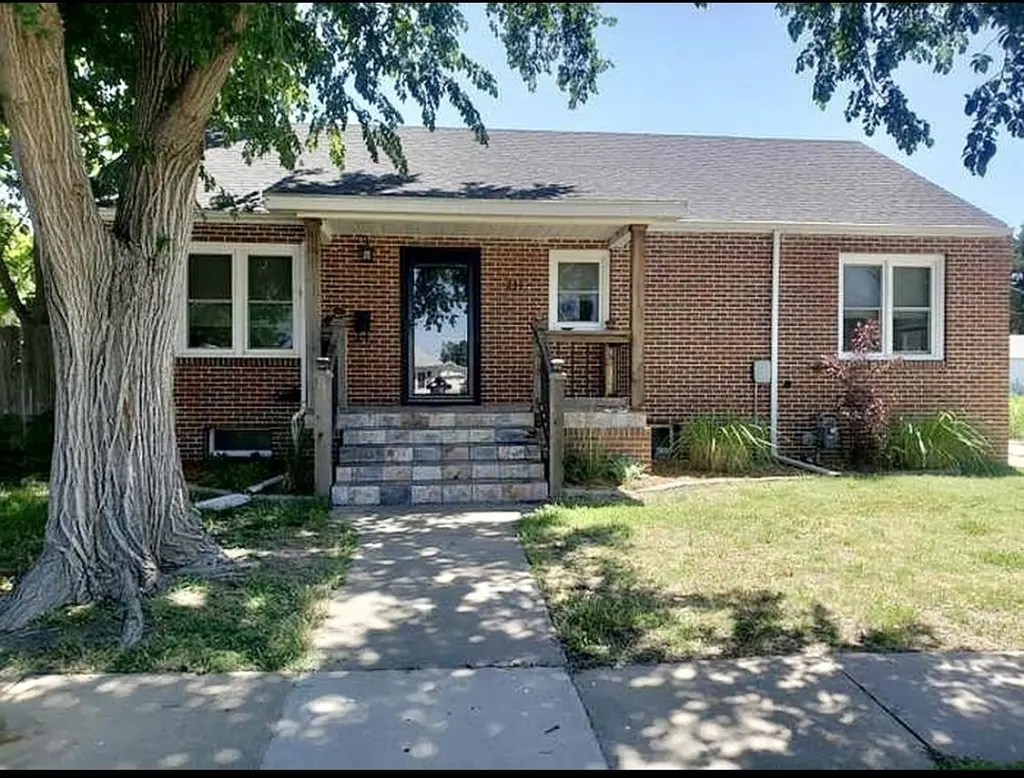
231 N Grant St · Russell, KS
Flood risk 1/10 · Minimal
- FEMA flood zone
- X
- Chance of flooding over 30 yrs
- 0.0%
- Est. flood insurance / yr
- $473 – $860
Fire risk 5/10 · Moderate
- Est. fire insurance / yr
- $1,154 – $2,142
Heat risk 5/10 · Moderate
- Hot days now (above 105°F)
- 7 days/yr
- Hot days in 30 yrs
- 16 days/yr
Wind risk 2/10 · Minimal
- Chance of severe wind over 30 yrs
- —
Air-quality risk 2/10 · Minimal
- Unhealthy air days now
- 1 days/yr
- Unhealthy air days in 30 yrs
- 1 days/yr
Risk factors via First Street. Map © Google.
Why this score? — see what drove the F grade
The composite is a weighted blend of 9 inputs, each scored 0–100. Each bar is that input's sub-score; the figure is the points it added to the 100-point composite (weight × sub-score).
- Appreciation +8.6/10.0
- ARV discount +7.5/15.0
- Cash flow +5.7/30.0
- Livability +3.5/5.0
- Rent growth +2.5/5.0
- Condition / age +2.5/5.0
- Schools +2.0/10.0
- 1% rule +1.2/10.0
- DSCR +0.1/10.0
$158,500
🖨 Deal sheet (PDF) 📄 Offer letter ✓ Due diligence
Listing remarks MLS
Freshly painted interior, freshly painted garage. Tankless water heater, brick, no exterior maintenance home. Back yard adjacent to the Bickerdyke Park!! Tened chicken coop and fully functional dog wash in garage. Under Contract. .
Key facts
- Location near parks
- 8,712 sq ft lot
- 2 garage spots
Tags
Property features AI
Finance
- Other: Lot dimensions approximately 66 x 132 (0.2 acre); Zoning: NC.2 / R-2
Exterior
- Parking: 2-car garage
- Utilities: Public water; Public sewer; Natural gas available
- Home design: Residential property; Single-story entry level
- Construction: Brick construction
- Exterior features: Covered patio; Fenced yard; Composition roof
Interior
- Kitchen: Dishwasher; Range; Oven
- Bedrooms: 2 main-level bedrooms
- Heating & cooling: Central air
- Interior features: Eat-in kitchen; Window coverings; Has basement with concrete floor
- Laundry & utility: Washer; Dryer
Neighborhood map
What this means for you Summary
Snapshot
- This is a 3-bed/2.0-bath single-family listed at $158k.
Deal economics
- At list price, monthly cash flow is $-322 ($-4k/yr) — negative.
- To cash-flow at today's rent, offer at most $112k (29.4% below list).
- To meet the 1% rule (rent ≥ 1% of price), the offer needs to be $98k (38.2% below list).
- Recommended offer: $98k (38.2% below list) — sets the bar for 1% rule.
Location & tenants
- Location reads 69/100 on livability (#186 in KS) — a middle-class / working-renter tenant base. Strengths: cost of living A+, housing A+, health & safety A+; Watch: employment C-, amenities F, commute F.
- Russell County (town): math 22% / reading 26% proficiency, ranked #144 of 169 in KS (top 85%) — low school quality limits family demand, transient renter base, plan for 1-2y turnover.
- Zoned schools: Bickerdyke Elem (math 34% / reading 37%, grade F, #386 of 684 statewide, top 56%, 228 students, 55% FRL); Ruppenthal Middle (math 12% / reading 17%, grade F, #180 of 219 statewide, top 83%, 186 students, 59% FRL); Russell High (math 15% / reading 15%, grade F, #249 of 327 statewide, top 79%, 207 students, 55% FRL) — zoned schools average 56% FRL vs 41% district-wide (15 pts higher); higher-poverty schools than district average — tighter screening recommended.
- Market conditions: 43 active listings in the ZIP; 6 units permitted in Russell County in 2024 (0 in 5+ unit buildings).
Forward outlook
- In year one you build about $13k of equity ($1k loan paydown + $12k appreciation (7.3% local appreciation)).
- Russell County population projected at +4% by 2050 — modest demand growth; plan on rents tracking national, not racing it.
- By year 3, paydown + projected appreciation supports a ~$32k cash-out refi (75% LTV) — recoverable capital for the next deal without selling this one.
Negotiation context
- It's been on market 56 days — a 3% lower offer ($154k) is reasonable based on typical stale-listing flexibility.
- 3 sale attempts since 6y ago with the ask held roughly flat each time — persistent listings suggest the price (not the market) is what's stuck; bring a comps-based counter.
- Current owner paid $52k; list at $158k implies a 205% gain — meaningful room to come down on a strong offer.
Risks & watch-outs
- Watch-outs: built in 1942 — expect roof / HVAC / electrical / plumbing capex.
- Climate carrying-cost: moderate wildfire risk; extreme-heat days projected 7→16/yr by 2055 (HVAC capex compounding) — expect insurance premiums to compound above CPI over the hold.
Questions for the listing agent
- What do current leases actually rent for vs. the listed asking? Can we see a recent rent roll and the last 12 months of T-12 income?
- It's been on market 56 days. Have you received any prior offers? Is the seller open to a 38% concession, seller financing, or rate buy-down credit?
- Built in 1942 — when were the roof, HVAC, electrical panel, plumbing, and water heater last replaced?
- Is there a deadline driving the sale (1031 exchange, divorce, estate, relocation)? That informs how much negotiation room exists.
- Schools are F-rated, which usually means shorter tenancies and higher turnover. Who's the typical renter profile here, and what's been the actual vacancy rate?
- The area grade is low — what's the realistic commute time and amenity access for the typical tenant pool here? Any planned neighborhood developments (good or bad) we should know about?
- What's the average days-on-market for RENTAL listings here right now (not sales)? A rising rental-DOM trend means longer vacancies and softer asking-rent achievability than the comps imply.
- What's the recent tenant-quality profile in this submarket — average credit score on applications, eviction rate, late-payment / NSF rate, and stable-employment percentage? A property-management company in the area should have these aggregated.
- How much new for-sale + rental construction is in the pipeline within 1–3 miles? Heavy new supply typically softens prices + rents 12–24 months out; constrained supply supports both.
Investment metrics
- 1% rule
- 0.62% ✗
- Cap rate
- 3.86%
- Cash-on-cash
- -8.70%
- DSCR
- 0.61
- GRM
- 13.5
CMA / ARV
No comps found within radius.
Projected returns pro-forma
7.29% appreciation · 3.0% rent growth · sell at horizon
- IRR
- 11.7%
- Equity multiple
- 1.85×
- Total profit
- $37,739
- Equity at exit
- $112,893
- IRR
- 12.4%
- Equity multiple
- 3.81×
- Total profit
- $124,822
- Equity at exit
- $217,272
Cash invested: $44,380 (down + closing). Projections, not guarantees.
Landlord ↔ Tenant lean methodology
- Overall (STATE)
- 83 Strongly Landlord-Friendly
- State Kansas
- 83 Strongly Landlord-Friendly · R+10
- County
- — inherits STATE
- City
- — inherits STATE
ZIP-level market 67665
- Home prices YoY
- 3.8%
- Active inventory
- 43
- Price-to-rent
- 13.5×
Monthly cashflow live
- Estimated rent
- $979 medium interval (Pro) →
- Mortgage (P&I)
- −$831
- Tax est. 1.5%
- −$198 /mo · $2,378/yr
- Insurance
- −$66
- HOA
- −$0
- Vacancy / Maint / Mgmt
- −$206
- Net cashflow
- $-322
Break-even live
Sensitivity live
| Price | -10% $-212 | -5% $-267 | +0% $-322 | +5% $-377 | +10% $-431 |
|---|---|---|---|---|---|
| Rent | -10% $-399 | -5% $-360 | +0% $-322 | +5% $-283 | +10% $-244 |
| Rate | -1.0pp $-242 | -0.5pp $-281 | base $-322 | +0.5pp $-363 | +1.0pp $-405 |
UW: 25.0% down · 7.5% · 30yr · 1.5% tax · 5.0% vac · 8.0% maint · 8.0% mgmt
Financing live
Cash to close
- Down payment
- $39,625
- Closing costs
- $4,755
- Reserves months
- —
- Total cash needed
- —
Loan-product check · same deal, 3 products live
Conventional
25% down · 7.5% · 30yr
- Down + closing
- —
- Monthly P&I
- —
- Monthly cashflow
- —
- DSCR
- —
- Eligible?
- —
Personal DTI + credit; lowest rate.
DSCR
20% down · 8.5% · 30yr
- Down + closing
- —
- Monthly P&I
- —
- Monthly cashflow
- —
- DSCR
- —
- Eligible?
- —
No personal income docs; deal must DSCR.
Hard money
10% down · 12.0% · 12mo
- Down + closing
- —
- Monthly P&I
- —
- Monthly cashflow
- —
- DSCR
- —
- Eligible?
- —
Short-term bridge; refi at stabilization.
Listing history 16 events
-
2026-06-09status $158,500 Pending 56 DOM
-
2026-06-08days on market $158,500 Active Under Contract 56 DOM
-
2026-06-07days on market $158,500 Active Under Contract 55 DOM
-
2026-06-05days on market $158,500 Active Under Contract 53 DOM
-
2026-06-04days on market $158,500 Active Under Contract 51 DOM
-
2026-06-02days on market $158,500 Active Under Contract 50 DOM
-
2026-06-01days on market $158,500 Active Under Contract 49 DOM
-
2026-05-31days on market $158,500 Active Under Contract 48 DOM
-
2026-05-31days on market $158,500 Active Under Contract 47 DOM
-
2026-05-21historical Active Under Contract
-
2026-04-12$158,500 Active
-
2020-10-23soldstatus 231-char remark
Show marketing remark (231 chars)
Freshly painted interior, freshly painted garage. Tankless water heater, brick, no exterior maintenance home. Back yard adjacent to the Bickerdyke Park!! Tened chicken coop and fully functional dog wash in garage. Under Contract. .
-
2020-06-05$105,000 231-char remark
Show marketing remark (231 chars)
Freshly painted interior, freshly painted garage. Tankless water heater, brick, no exterior maintenance home. Back yard adjacent to the Bickerdyke Park!! Tened chicken coop and fully functional dog wash in garage. Under Contract. .
-
2020-06-04$105,000
-
2002-06-01soldstatus $52,000
-
1997-05-01soldstatus $53,000
ⓘ Source: listings_history table (triggers on properties + properties_extension) + one-shot
backfill from property_details.listing_events for pre-trigger history.
Climate risk First Street
- Flood 1/10 Low FEMA zone X · 0% chance over 30 yrs
- Wildfire 5/10 Major
- Heat 5/10 Major 7 d/yr ≥105°F today · 16 d/yr by 30 yrs out
- Wind 2/10 Low
- Air quality 2/10 Low 1 unhealthy d/yr today · 1 by 30 yrs out
Nearby sold comps map
Loading sold comps map…
Walkable amenities ~0.75 mi
Loading nearby amenities…
Taxation est. · year 1
- Rental income
- $11,750
- − Mortgage interest
- −$8,878
- − Property taxes
- −$2,378
- − Insurance
- −$792
- − Repairs & maintenance
- −$940
- − Management
- −$940
- − Depreciation
- −$4,611
- Taxable loss
- −$6,789
- Est. tax savings @ 24.0%
- +$1,629
- After-tax cash flow
- $-2,232/yr
For passive investors: Depreciation is non-cash, so a rental often shows a tax loss while cash-flowing — sheltering income. Rental losses are passive: they offset passive income freely, and up to $25,000/yr can offset ordinary (W-2) income if you actively participate and your MAGI is under $100k (phasing out to $0 by $150k); unused losses carry forward. On sale, claimed depreciation is recaptured at up to 25%, and gains may owe capital-gains tax (a 1031 exchange can defer both). Figures are a year-1 estimate at your 24.0% rate — not tax advice; consult a CPA.
Schools (NCES district)
- District
- Russell County
- NCES district ID
- 2011310
- Math proficiency
- 22% ▲ 1.00%
- Reading proficiency
- 26% ▲ 2.00%
- Median HH income
- $41,397
- Composite
- 20.4/100
- National rank
- #8591
- State rank
- #144 of 169 in KS
Livability — Russell
- Score
- 69/100
- State rank
- #186
- US rank
- #8488
Category grades
Schools grade is shown separately in the Schools card above.
Census & demographics
- Census place
- Russell, KS
- Population (ZIP)
- 4,893
Population outlook (Russell County) Hauer SSP2
- Today (2025)
- 7,010 people
- By 2030
- 7,035 · +0.4%
- By 2040
- 7,181 · +2.4%
- By 2050
- 7,290 · +4.0%
- By 2075
- 8,229 · +17.4%
- By 2100
- 8,868 · +26.5%
Race, ethnicity, and origin ACS 2023
- Neighborhood character
- Predominantly White (89%)
- Race & ethnicity
- White 89% Two or more races 8% Hispanic / Latino 5%
- Hispanic origin (detail)
- Mexican 3%
- Common ancestry
- Scotch-Irish 5% Lithuanian 3% Iranian 2%
- Foreign-born
- 2% · Canada
- Languages at home
- 99% English-only · Spanish 1%
Political lean MEDSL · Russell
- 2024 margin
- Solid R (+61.3) · D 18.4% · R 79.7% · Other 1.9%
- 2008→2024 swing
- -7.5pp toward R · 2008: -53.8pp · 2024: -61.3pp
- All cycles
- 2024: R+61.3 2020: R+63.4 2016: R+66.4 2012: R+61.2 2008: R+53.8
Not yet ingested
- Civics
- —
Market trends
- HPI YoY
- ▲ 7.29%
- Current HPI
- 201.0595
- Rent YoY
- —
- Metro
- —
- State GDP YoY
- —
- F500 in state
- 0
Price history
+199.1% since first listed7 events — show timeline
- 2026-05-21 Contingent — Hays MLS
- 2026-04-12 Listed $158,500 Hays MLS
- 2020-10-23 Sold (MLS) — Hays MLS
- 2020-06-05 Listed $105,000 Hays MLS
- 2020-06-04 Listed $105,000 SCKMLS as Distributed by MLS Grid
- 2002-06-01 Sold (Public Records) $52,000 Public Records
- 1997-05-01 Sold (Public Records) $53,000 Public Records
Cash-flow waterfall
monthlySold comps — $/sqft
last 12 mo · ≤1 miLoading sold comps…