 Multi-family
2081 Chaffee Rd S · Jacksonville, FL
Flood risk 1/10 · Minimal
- FEMA flood zone
- X (unshaded)
- Chance of flooding over 30 yrs
- 0.0%
- Est. flood insurance / yr
- $507 – $1,088
Fire risk 6/10 · Moderate
- Est. fire insurance / yr
- $947 – $1,759
Heat risk 8/10 · Major
- Hot days now (above 108°F)
- 7 days/yr
- Hot days in 30 yrs
- 19 days/yr
Wind risk 9/10 · Severe
- Chance of severe wind over 30 yrs
- 99.0%
Air-quality risk 5/10 · Moderate
- Unhealthy air days now
- 6 days/yr
- Unhealthy air days in 30 yrs
- 7 days/yr
Risk factors via First Street. Map © Google.
Why this score? — see what drove the B- grade
The composite is a weighted blend of 9 inputs, each scored 0–100. Each bar is that input's sub-score; the figure is the points it added to the 100-point composite (weight × sub-score).
- Cash flow +30.0/30.0
- 1% rule +10.0/10.0
- DSCR +10.0/10.0
- ARV discount +7.5/15.0
- Livability +4.2/5.0
- Schools +3.9/10.0
- Rent growth +3.0/5.0
- Condition / age +1.0/5.0
- Appreciation +0.0/10.0
$48,500
🖨 Deal sheet (PDF) 📄 Offer letter ✓ Due diligence
Multi-family units
County records classify this as Multi-Family (5+ Unit). Listing-text estimate: 1 unit. estimate disagrees with records
5+ unit building — per-unit beds/baths from public records are typically unavailable; the breakdown below (if shown) is an estimate from the listing text.
Listing remarks MLS
Beautifully treed Cul-de-sac street with 18 homesites. Lot 4,5,6,7,and 8 are available each lot is $39,500. Bring your own builer.
Key facts
- Oversized shed
- Corner lot
- Quiet growing area
Tags
Neighborhood map
What this means for you Summary
Snapshot
- This is a 3-bed/2.0-bath multifamily listed at $48k. Condition is rated poor.
Deal economics
- At list price, monthly cash flow is $1k ($14k/yr) — positive.
- The deal already cash-flows at list — no discount required.
- Meets the 1% rule at list price ($2k rent vs $48k).
- Recommended offer: $48k (1.5% below list) — sets the bar for market timing.
- Cap rate 36.1% vs local median 3.9% in Jacksonville — top-decile yield for the area; either an underpriced asset or a hidden risk that comps aren't pricing in. Stress-test before assuming the spread holds.
Location & tenants
- Location reads 83/100 on livability (#50 in FL, #911 nationally) — a professional / high-income tenant draw. Strengths: amenities A+, commute A+, housing A+.
- Duval (urban): math 46% / reading 45% proficiency, ranked #48 of 73 in FL (top 66%) — families likely to look elsewhere, expect single-tenant / working-renter base with shorter leases.
- Zoned schools: Chaffee Trail Elementary (math 57% / reading 52%, grade C, #892 of 2,144 statewide, top 44%, 765 students, 52% FRL); Charger Academy (math 33% / reading 26%, grade F, #469 of 571 statewide, top 84%, 961 students, 71% FRL); Edward H. White High School (math 31% / reading 25%, grade F, #464 of 667 statewide, top 70%, 1,538 students, 64% FRL).
- Market conditions: Rents rising (+2.1%/yr); 219 active listings in the ZIP; 29 comparable units currently listed for rent nearby; rentals at typical pace (median 16d on market — plan ~3-4 weeks tenant-placement turnaround); solid renter incomes; 6,503 units permitted in Duval County in 2024 (1,131 in 5+ unit buildings).
Forward outlook
- Local home prices are declining (-3.0%/yr); year-one equity from $335 of loan paydown is wiped out by about $1k of value loss. Plan a longer hold.
- Duval County population projected at +19% by 2050 — long-run rental-demand tailwind backs the buy-and-hold thesis.
- At projected returns (-3.0% appreciation + 2.1% rent growth), your $14k cash investment doubles in ~2 years — after that, you're playing with house money.
Negotiation context
- It's been on market 20 days — a 2% lower offer ($48k) is reasonable based on typical stale-listing flexibility.
- 4 sale attempts since 21y ago with the ask held roughly flat each time — persistent listings suggest the price (not the market) is what's stuck; bring a comps-based counter.
Risks & watch-outs
- Climate carrying-cost: severe wind risk, 99% chance of damaging wind over 30y; major wildfire risk; extreme-heat days projected 7→19/yr by 2055 (HVAC capex compounding) — expect insurance premiums to compound above CPI over the hold.
Questions for the listing agent
- Have any recent inspections been done? Can we get a copy of the seller's disclosures and any deferred-maintenance estimates?
- Is there a deadline driving the sale (1031 exchange, divorce, estate, relocation)? That informs how much negotiation room exists.
- Schools are B-rated — typically a magnet for longer-tenancy family renters. What's the average tenant stay here, and is there a school-zone premium baked into asking?
- What's the average days-on-market for RENTAL listings here right now (not sales)? A rising rental-DOM trend means longer vacancies and softer asking-rent achievability than the comps imply.
- What's the recent tenant-quality profile in this submarket — average credit score on applications, eviction rate, late-payment / NSF rate, and stable-employment percentage? A property-management company in the area should have these aggregated.
- How much new apartment / multifamily construction is in the pipeline within 1–3 miles? Heavy new supply (>2% of stock underway) typically softens rents 12–24 months out; light construction supports rent growth.
Investment metrics
- 1% rule
- 4.02% ✓
- Cap rate
- 36.11%
- Cash-on-cash
- 106.51%
- DSCR
- 5.74
- GRM
- 2.1
CMA / ARV
No comps found within radius.
Projected returns pro-forma
-3.0% appreciation · 2.12% rent growth · sell at horizon
- IRR
- —
- Equity multiple
- 5.95×
- Total profit
- $67,225
- Equity at exit
- $7,232
- IRR
- —
- Equity multiple
- 12.09×
- Total profit
- $150,607
- Equity at exit
- $4,193
Cash invested: $13,580 (down + closing). Projections, not guarantees.
Landlord ↔ Tenant lean methodology
- Overall (STATE)
- 87 Strongly Landlord-Friendly
- State Florida
- 87 Strongly Landlord-Friendly · R+3
- County
- — inherits STATE
- City
- — inherits STATE
ZIP-level market 32221
- Home prices YoY
- -19.2%
- Rents YoY
- 2.1%
- Active inventory
- 219
- Price-to-rent
- 2.1×
Monthly cashflow live
- Estimated rent
- $1,950 high interval (Pro) →
- Mortgage (P&I)
- −$254
- Tax est. 1.5%
- −$61 /mo · $728/yr
- Insurance
- −$20
- HOA
- −$0
- Vacancy / Maint / Mgmt
- −$409
- Net cashflow
- $1,205
Break-even live
Sensitivity live
| Price | -10% $1,239 | -5% $1,222 | +0% $1,205 | +5% $1,189 | +10% $1,172 |
|---|---|---|---|---|---|
| Rent | -10% $1,051 | -5% $1,128 | +0% $1,205 | +5% $1,282 | +10% $1,359 |
| Rate | -1.0pp $1,230 | -0.5pp $1,218 | base $1,205 | +0.5pp $1,193 | +1.0pp $1,180 |
UW: 25.0% down · 7.5% · 30yr · 1.5% tax · 5.0% vac · 8.0% maint · 8.0% mgmt
Financing live
Cash to close
- Down payment
- $12,125
- Closing costs
- $1,455
- Reserves months
- —
- Total cash needed
- —
Loan-product check · same deal, 3 products live
Conventional
25% down · 7.5% · 30yr
- Down + closing
- —
- Monthly P&I
- —
- Monthly cashflow
- —
- DSCR
- —
- Eligible?
- —
Personal DTI + credit; lowest rate.
DSCR
20% down · 8.5% · 30yr
- Down + closing
- —
- Monthly P&I
- —
- Monthly cashflow
- —
- DSCR
- —
- Eligible?
- —
No personal income docs; deal must DSCR.
Hard money
10% down · 12.0% · 12mo
- Down + closing
- —
- Monthly P&I
- —
- Monthly cashflow
- —
- DSCR
- —
- Eligible?
- —
Short-term bridge; refi at stabilization.
Rent comps 29 comps
| Address | Beds | Baths | Sqft | Rent | $/sqft | DOM | Units | Dist |
|---|---|---|---|---|---|---|---|---|
| 2081 Chaffee Rd S #19 Jacksonville, FL | 3.0 | 2.0 | 1152 | $1,619 | $1.41 | 25d | 1 | 0.10mi |
| 2081 Chaffee Rd S #72 Jacksonville, FL | 2.0 | 2.0 | 1216 | $1,309 | $1.08 | 25d | 1 | 0.13mi |
| 2081 Chaffee Rd S Unit 43 Jacksonville, FL | 4.0 | 2.0 | 1904 | $1,829 | $0.96 | 6d | 1 | 0.13mi |
| 10804 Old Gainesville Rd Jacksonville, FL | 3.0 | 1.0 | — | $1,395 | — | 9d | 1 | 0.50mi |
| 2120 Blair Rd Jacksonville, FL | 3.0 | 2.0 | 1272 | $1,675 | $1.32 | 25d | 1 | 0.54mi |
| 2167 Kistlers Ridge Way Jacksonville, FL | 4.0 | 2.0 | 1456 | $1,900 | $1.30 | 16d | 1 | 0.58mi |
| 2210 Kistlers Ridge Way Jacksonville, FL | 4.0 | 2.0 | 1456 | $1,846 | $1.27 | 25d | 1 | 0.66mi |
| 2573 Cold Creek Blvd Jacksonville, FL | 3.0 | 2.0 | — | $2,500 | — | 25d | 1 | 0.76mi |
| 2012 James Wilson Way Jacksonville, FL | 3.0 | 2.5 | 2038 | $1,989 | $0.98 | 14d | 1 | 0.79mi |
| 2625 Fox Creek Dr Jacksonville, FL | 4.0 | 2.0 | 2018 | $2,040 | $1.01 | 25d | 1 | 0.85mi |
| 10308 Angel Ct Jacksonville, FL | 2.0 | 1.0 | 750 | $1,050 | $1.40 | 25d | 1 | 0.92mi |
| 2300 Justin Lake Dr Jacksonville, FL | 3.0 | 2.5 | 2539 | $2,360 | $0.93 | 4d | 1 | 0.95mi |
| 1916 Constitutional Republic Pl Jacksonville, FL | 4.0 | 2.5 | 1975 | $2,029 | $1.03 | 3d | 1 | 0.98mi |
| 11269 Revolutionary Way Jacksonville, FL | 3.0 | 2.0 | 1716 | $1,919 | $1.12 | 9d | 1 | 1.06mi |
| 2514 Paris Mill Rd Jacksonville, FL | 3.0 | 2.0 | 1974 | $2,096 | $1.06 | 9d | 1 | 1.07mi |
| 10367 Shelby Creek Rd S Jacksonville, FL | 4.0 | 3.0 | 2470 | $2,325 | $0.94 | 18d | 1 | 1.07mi |
| 1832 James Madison Ct Jacksonville, FL | 3.0 | 2.0 | 1716 | $2,010 | $1.17 | 16d | 1 | 1.08mi |
| 10355 Shelby Creek Rd S Jacksonville, FL | 4.0 | 2.0 | 1917 | $2,100 | $1.10 | 22d | 1 | 1.09mi |
| 2346 Adams Lake Blvd Jacksonville, FL | 3.0 | 2.0 | 2251 | $2,100 | $0.93 | 16d | 1 | 1.10mi |
| 1916 Allegiance Pl Jacksonville, FL | 2.0–3.0 | 2.5 | 1439 | $2,100 | $1.46 | 5d | 12 | 1.10mi |
| 1362 Panther Preserve Pkwy Jacksonville, FL | 3.0 | 2.0 | 1599 | $2,400 | $1.50 | 19d | 1 | 1.22mi |
| 9836 Marine Ct Jacksonville, FL | 4.0 | 3.0 | 2286 | $2,221 | $0.97 | 25d | 1 | 1.28mi |
| 2274 Tyson Lake Dr Jacksonville, FL | 3.0 | 2.0 | 1710 | $1,975 | $1.15 | 4d | 1 | 1.28mi |
| 11242 Panther Creek Pkwy Jacksonville, FL | 3.0 | 2.0 | 1529 | $2,100 | $1.37 | 6d | 1 | 1.29mi |
| 1433 Royal Dornoch Dr Jacksonville, FL | 4.0 | 3.0 | 1860 | $2,400 | $1.29 | 25d | 1 | 1.30mi |
| 1951 April Oaks Dr Jacksonville, FL | 4.0 | 2.0 | 1705 | $1,879 | $1.10 | 5d | 1 | 1.35mi |
| 11288 Panther Creek Pkwy Jacksonville, FL | 4.0 | 2.5 | 2931 | $2,600 | $0.89 | 25d | 1 | 1.35mi |
| 2067 Tyson Lake Dr Jacksonville, FL | 3.0 | 2.0 | 1564 | $1,935 | $1.24 | 3d | 1 | 1.44mi |
| 11561 Admirals Cove Dr Jacksonville, FL | 3.0 | 2.5 | 1780 | $2,100 | $1.18 | 18d | 1 | 1.46mi |
Listing history 16 events
-
2026-06-15days on market $48,500 Active 20 DOM
-
2026-06-10days on market $48,500 Active 14 DOM
-
2026-06-08days on market $48,500 Active 13 DOM
-
2026-06-08days on market $48,500 Active 12 DOM
-
2026-06-03days on market $48,500 Active 8 DOM
-
2026-06-02days on market $48,500 Active 7 DOM
-
2026-06-01days on market $48,500 Active 6 DOM
-
2026-05-31days on market $48,500 Active 5 DOM
-
2026-05-26$48,500 Active
-
2012-02-07historical 132-char remark
Show marketing remark (132 chars)
Beautifully treed Cul-de-sac street with 18 homesites. Lot 4,5,6,7,and 8 are available each lot is $39,500. Bring your own builer.
-
2011-04-05$39,500 132-char remark
Show marketing remark (132 chars)
Beautifully treed Cul-de-sac street with 18 homesites. Lot 4,5,6,7,and 8 are available each lot is $39,500. Bring your own builer.
-
2008-08-11historical 52-char remark
Show marketing remark (52 chars)
extremely secluded building lot in the heart of town
-
2008-08-04soldstatus $59,500 52-char remark
Show marketing remark (52 chars)
extremely secluded building lot in the heart of town
-
2007-08-03$59,900 52-char remark
Show marketing remark (52 chars)
extremely secluded building lot in the heart of town
-
2006-08-16historical
-
2005-08-23$629,500
ⓘ Source: listings_history table (triggers on properties + properties_extension) + one-shot
backfill from property_details.listing_events for pre-trigger history.
Climate risk First Street
- Flood 1/10 Low FEMA zone X (unshaded) · 0% chance over 30 yrs
- Wildfire 6/10 Major
- Heat 8/10 Severe 7 d/yr ≥108°F today · 19 d/yr by 30 yrs out
- Wind 9/10 Extreme 99% chance of damaging wind over 30 yrs
- Air quality 5/10 Major 6 unhealthy d/yr today · 7 by 30 yrs out
Nearby sold comps map
Loading sold comps map…
Walkable amenities ~0.75 mi
Loading nearby amenities…
Taxation est. · year 1
- Rental income
- $23,400
- − Mortgage interest
- −$2,717
- − Property taxes
- −$728
- − Insurance
- −$242
- − Repairs & maintenance
- −$1,872
- − Management
- −$1,872
- − Depreciation
- −$1,411
- Taxable income
- $14,558
- Est. tax owed @ 24.0%
- −$3,494
- After-tax cash flow
- $10,970/yr
For passive investors: Depreciation is non-cash, so a rental often shows a tax loss while cash-flowing — sheltering income. Rental losses are passive: they offset passive income freely, and up to $25,000/yr can offset ordinary (W-2) income if you actively participate and your MAGI is under $100k (phasing out to $0 by $150k); unused losses carry forward. On sale, claimed depreciation is recaptured at up to 25%, and gains may owe capital-gains tax (a 1031 exchange can defer both). Figures are a year-1 estimate at your 24.0% rate — not tax advice; consult a CPA.
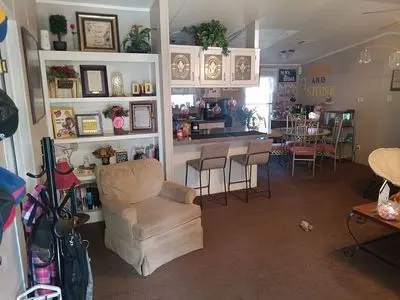
Condition & rehab AI · 1 photo
This multi-family property requires extensive renovations and updates to bring it up to market standards, significantly impacting its resale and rental value.
Repairs flagged
- Major Kitchen organization — Cluttered and disorganized, needs decluttering and reorganization.
- Major Bathroom updates — No visible condition details, likely outdated and in need of updates.
- Major Flooring replacement — Worn and dirty carpet, needs replacement.
- Major Painting — Paint appears chipped and dirty, needs repainting.
- Major Kitchen appliances — No visible appliances, likely outdated and in need of replacement.
- Major Bathroom fixtures — No visible fixtures, likely outdated and in need of replacement.
- Major HVAC system — No visible system, likely outdated and in need of replacement.
- Major Landscaping — No visible landscaping, needs improvement to enhance curb appeal.
Value-add opportunities
- Both Kitchen renovation — A fresh, organized kitchen can significantly increase both resale and rental value.
- Both Bathroom updates — Modern bathrooms are crucial for both resale and rental appeal.
- Both Flooring replacement — New flooring can greatly enhance the home's appearance and value.
- Both Painting — Fresh paint can make a significant difference in the home's curb appeal and value.
- Both HVAC system replacement — A new HVAC system is essential for comfort and can improve both resale and rental value.
- Both Landscaping — A well-maintained yard can greatly enhance the home's curb appeal and value.
Renovation cost estimate screening
| Repair item | Severity | Est. cost |
|---|---|---|
| Kitchen organization · Cluttered and disorganized, needs decluttering and reorganization. | Major | $15,000–50,000 |
| Bathroom updates · No visible condition details, likely outdated and in need of updates. | Major | $15,000–50,000 |
| Flooring replacement · Worn and dirty carpet, needs replacement. | Major | $15,000–50,000 |
| Painting · Paint appears chipped and dirty, needs repainting. | Major | $15,000–50,000 |
| Kitchen appliances · No visible appliances, likely outdated and in need of replacement. | Major | $15,000–50,000 |
| Bathroom fixtures · No visible fixtures, likely outdated and in need of replacement. | Major | $15,000–50,000 |
| HVAC system · No visible system, likely outdated and in need of replacement. | Major | $15,000–50,000 |
| Landscaping · No visible landscaping, needs improvement to enhance curb appeal. | Major | $15,000–50,000 |
| Total estimated repair cost · 8 items | $120,000–400,000 |
Value-add ROI direction
- Both Kitchen renovation — A fresh, organized kitchen can significantly increase both resale and rental value. ↑
- Both Bathroom updates — Modern bathrooms are crucial for both resale and rental appeal. ↑
- Both Flooring replacement — New flooring can greatly enhance the home's appearance and value. ↑
- Both Painting — Fresh paint can make a significant difference in the home's curb appeal and value. ↑
- Both HVAC system replacement — A new HVAC system is essential for comfort and can improve both resale and rental value. ↑
- Both Landscaping — A well-maintained yard can greatly enhance the home's curb appeal and value. ↑
ⓘ Cost ranges are severity-bucket heuristics (US national rule-of-thumb). Get contractor quotes + a written scope before underwriting a rehab budget.
Schools (NCES district)
- District
- Duval
- NCES district ID
- 1200480
- Math proficiency
- 46% ▼ -11.00%
- Reading proficiency
- 45% ▼ -4.00%
- Median HH income
- $48,987
- Composite
- 38.97/100
- National rank
- #4076
- State rank
- #48 of 73 in FL
Livability — Jacksonville
- Score
- 83/100
- State rank
- #50
- US rank
- #911
Category grades
Schools grade is shown separately in the Schools card above.
Census & demographics
- Census place
- Jacksonville, FL
- County
- Duval County · 1,015,274 people
- City population
- 979,034
- Metro
- Jacksonville, FL
- Population (ZIP)
- 32,833
- Household income
- $82,969
- Rent vs Own
- Severe rent burden
- 516.0
Population outlook (Duval County) Hauer SSP2
- Today (2025)
- 1,013,010 people
- By 2030
- 1,059,228 · +4.6%
- By 2040
- 1,141,439 · +12.7%
- By 2050
- 1,205,258 · +19.0%
- By 2075
- 1,324,282 · +30.7%
- By 2100
- 1,319,620 · +30.3%
Race, ethnicity, and origin ACS 2023
- Neighborhood character
- Diverse neighborhood (Simpson 0.65)
- Race & ethnicity
- White 48% Black 33% Hispanic / Latino 9% Two or more races 6% Asian 4%
- Hispanic origin (detail)
- Mexican 2% Puerto Rican 5%
- Common ancestry
- Italian 3% Slovak 2% Hispanic 1%
- Foreign-born
- 9% · Canada, Vietnam
- Languages at home
- 88% English-only · Spanish 6% French/Haitian/Cajun 2% Vietnamese 2%
Political lean MEDSL · Duval
- 2024 margin
- Toss-up / Even · D 48.7% · R 50.1% · Other 1.2%
- 2008→2024 swing
- +0.4pp no change · 2008: -1.9pp · 2024: -1.5pp
- All cycles
- 2024: R+1.5 2020: D+3.8 2016: R+1.5 2012: R+3.6 2008: R+1.9
Not yet ingested
- Civics
- —
Market trends
- HPI YoY
- ▼ -62.74%
- Current HPI
- 263.7591
- Rent YoY
- ▲ 2.12%
- Metro
- Jacksonville, FL
- State GDP YoY
- ▲ 3.28%
- F500 in state
- 36
Industry mix (Fortune 500 HQ in FL)
| Industry | F500 HQs | Revenue |
|---|---|---|
| Industrial Technology | 2 | $29B |
|
||
| Insurance | 2 | $17B |
|
||
| Retail | 1 | $60B |
|
||
| Technology Distribution | 1 | $58B |
|
||
| Homebuilding | 1 | $35B |
|
||
| Technology Manufacturing | 1 | $35B |
|
||
Price history
-92.3% since first listed8 events — show timeline
- 2026-05-26 Listed $48,500 FSBO.com
- 2012-02-07 Listing Removed — realMLS
- 2011-04-05 Listed $39,500 realMLS
- 2008-08-11 Listing Removed — realMLS
- 2008-08-04 Sold (MLS) $59,500 realMLS
- 2007-08-03 Listed $59,900 realMLS
- 2006-08-16 Listing Removed — realMLS
- 2005-08-23 Listed $629,500 realMLS
Cash-flow waterfall
monthlySold comps — $/sqft
last 12 mo · ≤1 miLoading sold comps…