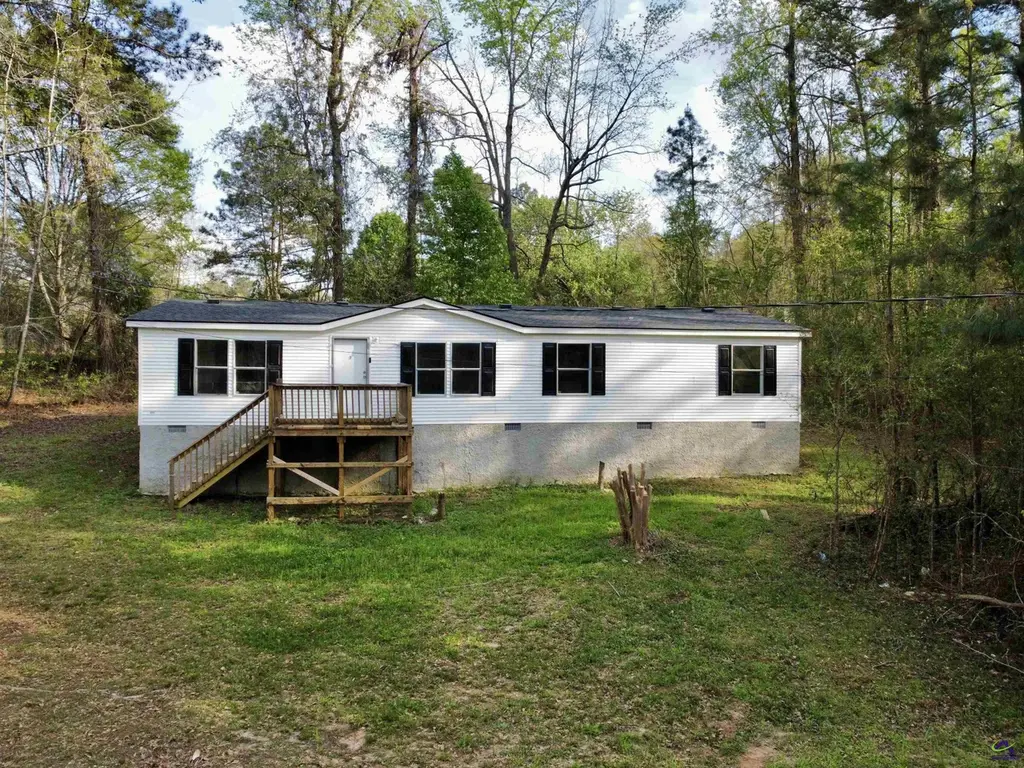
290 Forestwood Drive Dr · Macon-Bibb County, GA
Flood risk 1/10 · Minimal
- FEMA flood zone
- X (unshaded)
- Chance of flooding over 30 yrs
- 0.0%
- Est. flood insurance / yr
- $507 – $1,088
Fire risk 6/10 · Moderate
- Est. fire insurance / yr
- $963 – $1,789
Heat risk 6/10 · Moderate
- Hot days now (above 108°F)
- 7 days/yr
- Hot days in 30 yrs
- 17 days/yr
Wind risk 6/10 · Moderate
- Chance of severe wind over 30 yrs
- 68.0%
Air-quality risk 4/10 · Minor
- Unhealthy air days now
- 5 days/yr
- Unhealthy air days in 30 yrs
- 5 days/yr
Risk factors via First Street. Map © Google.
Why this score? — see what drove the B- grade
The composite is a weighted blend of 9 inputs, each scored 0–100. Each bar is that input's sub-score; the figure is the points it added to the 100-point composite (weight × sub-score).
- Cash flow +22.7/30.0
- ARV discount +15.0/15.0
- DSCR +7.3/10.0
- Appreciation +7.2/10.0
- Rent growth +5.0/5.0
- 1% rule +4.7/10.0
- Livability +2.5/5.0
- Condition / age +2.5/5.0
- Schools +1.0/10.0
$139,900
🖨 Deal sheet 📄 Offer letter ✓ Due diligence
Listing remarks MLS
Country Living! New roof, new stove, new hot water heater, fresh paint and flooring throughout! This 3/2 located on one acre and offers 2 living areas, dining room, fireplace, island, oversized rooms, separate laundry room, split plan and open floor plan. Enjoy the privacy on the front porch deck plus more! Make your appointment today! Title is retired.
Key facts
- New stove
- Fresh paint
- New hot water heater
Tags
Neighborhood map
What this means for you Summary
Snapshot
- This is a 3-bed/2.0-bath manufactured listed at $140k.
Deal economics
- At list price, monthly cash flow is $240 ($3k/yr) — positive.
- The deal already cash-flows at list — no discount required.
- To meet the 1% rule (rent ≥ 1% of price), the offer needs to be $136k (2.9% below list).
- Recommended offer: $132k (6.0% below list) — sets the bar for market timing.
- Cap rate 8.4% vs local median 5.4% in Macon-Bibb County — top-decile yield for the area; either an underpriced asset or a hidden risk that comps aren't pricing in. Stress-test before assuming the spread holds.
Location & tenants
- Location reads: area grade B — affects rentability + tenant quality, not the cash-flow math above.
- Twiggs County (rural): math 5% / reading 21% proficiency, ranked #164 of 174 in GA (top 94%) — low school quality limits family demand, transient renter base, plan for 1-2y turnover; 79% free/reduced lunch — lower-income household profile, screen leases tightly.
- Market conditions: Rents rising fast (+10.8%/yr); 122 active listings in the ZIP; lower-income renter base — watch delinquency; 7 units permitted in Twiggs County in 2024 (0 in 5+ unit buildings).
- This rent runs 36% of the median local income ($45k/yr) — at the standard rent-burdened threshold; future hikes will face affordability resistance.
Forward outlook
- In year one you build about $7k of equity ($967 loan paydown + $6k appreciation (4.3% local appreciation)).
- Twiggs County population projected at -41% by 2050 — secular population decline; favor cash flow + early exit over multi-decade hold.
- At projected returns (4.3% appreciation + 8.0% rent growth), your $39k cash investment doubles in ~4 years — after that, you're playing with house money.
- By year 5, paydown + projected appreciation supports a ~$30k cash-out refi (75% LTV) — recoverable capital for the next deal without selling this one.
Negotiation context
- It's been on market 80 days — a 6% lower offer ($132k) is reasonable based on typical stale-listing flexibility.
- 6 sale attempts since 5y ago; this cycle's ask has dropped $19k (12%) from the opening price — seller is motivated, your offer sets the floor, not the list.
- Current owner paid $34k; list at $140k implies a 310% gain — meaningful room to come down on a strong offer.
Risks & watch-outs
- Climate carrying-cost: major wind risk, 68% chance of damaging wind over 30y; major wildfire risk; extreme-heat days projected 7→17/yr by 2055 (HVAC capex compounding) — expect insurance premiums to compound above CPI over the hold.
Questions for the listing agent
- It's been on market 80 days. Have you received any prior offers? Is the seller open to a 6% concession, seller financing, or rate buy-down credit?
- Why hasn't it sold? Are there any deal-killer items the seller is aware of (foundation, flood, title, zoning, code violations)?
- Is there a deadline driving the sale (1031 exchange, divorce, estate, relocation)? That informs how much negotiation room exists.
- What's the average days-on-market for RENTAL listings here right now (not sales)? A rising rental-DOM trend means longer vacancies and softer asking-rent achievability than the comps imply.
- What's the recent tenant-quality profile in this submarket — average credit score on applications, eviction rate, late-payment / NSF rate, and stable-employment percentage? A property-management company in the area should have these aggregated.
- How much new for-sale + rental construction is in the pipeline within 1–3 miles? Heavy new supply typically softens prices + rents 12–24 months out; constrained supply supports both.
Investment metrics
- 1% rule
- 0.97% ✗
- Cap rate
- 8.35%
- Cash-on-cash
- 7.36%
- DSCR
- 1.33
- GRM
- 8.6
CMA / ARV
- ARV (median comp)
- $192,677
- List price
- $139,900
- Delta
- -27.39%
- Verdict
- UNDERPRICED
- Comps
- 4 within 1.0 mi
Show comp detail 2 sales within ~0.75 mi
| Address | Dist | Beds/Ba | Sqft | Sold | Price | $/sf | Match |
|---|---|---|---|---|---|---|---|
| 1659 Henderson Rd Rd | 0.50mi | 3/2.0 | 1,620 (-7%) | 19mo | $180,000 | $111 | 50 |
| 1659 Henderson Rd | 0.50mi | 3/2.0 | 1,620 (-7%) | 19mo | $180,000 | $111 | 50 |
Match score weights: distance 35% · size 25% · config 20% · recency 20%. Top-matched comps best support the ARV.
Projected returns pro-forma
4.31% appreciation · 8.0% rent growth · sell at horizon
- IRR
- 20.1%
- Equity multiple
- 2.26×
- Total profit
- $49,235
- Equity at exit
- $73,498
- IRR
- 22.5%
- Equity multiple
- 4.97×
- Total profit
- $155,516
- Equity at exit
- $122,308
Cash invested: $39,172 (down + closing). Projections, not guarantees.
Landlord ↔ Tenant lean methodology
- Overall (STATE)
- 90 Strongly Landlord-Friendly
- State Georgia
- 90 Strongly Landlord-Friendly · R+3
- County
- — inherits STATE
- City
- — inherits STATE
ZIP-level market 31217
- Home prices YoY
- 2.1%
- Rents YoY
- 10.8%
- Active inventory
- 122
- Price-to-rent
- 8.6×
Monthly cashflow live
- Estimated rent
- $1,358 medium interval (Pro) →
- Mortgage (P&I)
- −$734
- Tax from tax record
- −$41 /mo · $489/yr
- Insurance
- −$58
- HOA
- −$0
- Vacancy / Maint / Mgmt
- −$285
- Net cashflow
- $240
Break-even live
UW: 25.0% down · 7.5% · 30yr · 1.5% tax · 5.0% vac · 8.0% maint · 8.0% mgmt
Financing live
Cash to close
- Down payment
- $34,975
- Closing costs
- $4,197
- Reserves months
- —
- Total cash needed
- —
Loan-product check · same deal, 3 products live
Conventional
25% down · 7.5% · 30yr
- Down + closing
- —
- Monthly P&I
- —
- Monthly cashflow
- —
- DSCR
- —
- Eligible?
- —
Personal DTI + credit; lowest rate.
DSCR
20% down · 8.5% · 30yr
- Down + closing
- —
- Monthly P&I
- —
- Monthly cashflow
- —
- DSCR
- —
- Eligible?
- —
No personal income docs; deal must DSCR.
Hard money
10% down · 12.0% · 12mo
- Down + closing
- —
- Monthly P&I
- —
- Monthly cashflow
- —
- DSCR
- —
- Eligible?
- —
Short-term bridge; refi at stabilization.
Listing history 50 events
-
2026-06-19days on market $139,900 Active 80 DOM
-
2026-06-18days on market $139,900 Active 79 DOM
-
2026-06-17days on market $139,900 Active 78 DOM
-
2026-06-16days on market $139,900 Active 77 DOM
-
2026-06-15days on market $139,900 Active 76 DOM
-
2026-06-14days on market $139,900 Active 74 DOM
-
2026-06-13pricedays on market $139,900 Active 73 DOM
-
2026-06-10days on market $149,700 Active 71 DOM
-
2026-06-09days on market $149,700 Active 70 DOM
-
2026-06-08days on market $149,700 Active 69 DOM
-
2026-06-07pricedays on market $149,700 Active 68 DOM
-
2026-06-03days on market $149,800 Active 64 DOM
-
2026-06-02days on market $149,800 Active 63 DOM
-
2026-06-01days on market $149,800 Active 62 DOM
-
2026-05-31days on market $149,800 Active 61 DOM
-
2026-05-30pricedays on market $149,800 Active 60 DOM
-
2026-05-01price $149,900 359-char remark
Show marketing remark (359 chars)
Country Living! New roof, new stove, new hot water heater, fresh paint and flooring throughout! This 3/2 located on one acre and offers 2 living areas, dining room, fireplace, island, oversized rooms, separate laundry room, split plan and open floor plan. Enjoy the privacy on the front porch deck plus more! Make your appointment today! Title is retired.
-
2026-04-14price $158,900 359-char remark
Show marketing remark (359 chars)
Country Living! New roof, new stove, new hot water heater, fresh paint and flooring throughout! This 3/2 located on one acre and offers 2 living areas, dining room, fireplace, island, oversized rooms, separate laundry room, split plan and open floor plan. Enjoy the privacy on the front porch deck plus more! Make your appointment today! Title is retired.
-
2026-03-31$159,000 Active 359-char remark
Show marketing remark (359 chars)
Country Living! New roof, new stove, new hot water heater, fresh paint and flooring throughout! This 3/2 located on one acre and offers 2 living areas, dining room, fireplace, island, oversized rooms, separate laundry room, split plan and open floor plan. Enjoy the privacy on the front porch deck plus more! Make your appointment today! Title is retired.
-
2026-03-06historical
-
2026-03-02price $139,300
-
2026-03-02price $139,300
-
2026-02-20price $139,400
-
2026-02-20price $139,400
-
2026-02-16price $139,500
-
2026-02-16price $139,500
-
2026-01-30price $139,400
-
2026-01-30price $139,400
-
2026-01-23price $139,500
-
2026-01-23price $139,500
-
2026-01-17price $139,600
-
2026-01-17price $139,600
-
2026-01-12price $139,700
-
2026-01-12price $139,700
-
2026-01-03price $139,800
-
2026-01-03price $139,800
-
2025-12-02price $139,900
-
2025-11-29price $139,900
-
2025-11-25price $159,500
-
2025-11-21price $159,500
-
2025-11-14price $159,600
-
2025-11-14price $159,600
-
2025-11-10price $159,700
-
2025-11-03price $159,800
-
2025-11-02price $159,400
-
2025-10-14$159,700 New
-
2025-06-09soldstatus $34,106 Sold
-
2025-06-09soldstatus $34,106
-
2025-06-09soldstatus $34,106 Closed
-
2025-06-02status Under Contract
ⓘ Source: listings_history table (triggers on properties + properties_extension) + one-shot
backfill from property_details.listing_events for pre-trigger history.
Tax reassessment forecast GA · Resets to sale price
- Current annual tax
- $489 · $41/mo
- Projected year-2 tax
- $1,287 · $107/mo
- Expected delta
- +$798/yr (+$67/mo · 163.3%)
ⓘ Screening estimate from a state-policy table — verify with the county assessor before closing.
Climate risk First Street
- Flood 1/10 Low FEMA zone X (unshaded) · 0% chance over 30 yrs
- Wildfire 6/10 Major
- Heat 6/10 Major 7 d/yr ≥108°F today · 17 d/yr by 30 yrs out
- Wind 6/10 Major 68% chance of damaging wind over 30 yrs
- Air quality 4/10 Moderate 5 unhealthy d/yr today · 5 by 30 yrs out
Nearby sold comps map
Loading sold comps map…
Walkable amenities ~0.75 mi
Loading nearby amenities…
Taxation est. · year 1
- Rental income
- $16,299
- − Mortgage interest
- −$7,837
- − Property taxes
- −$489
- − Insurance
- −$700
- − Repairs & maintenance
- −$1,304
- − Management
- −$1,304
- − Depreciation
- −$4,070
- Taxable income
- $597
- Est. tax owed @ 24.0%
- −$143
- After-tax cash flow
- $2,741/yr
For passive investors: Depreciation is non-cash, so a rental often shows a tax loss while cash-flowing — sheltering income. Rental losses are passive: they offset passive income freely, and up to $25,000/yr can offset ordinary (W-2) income if you actively participate and your MAGI is under $100k (phasing out to $0 by $150k); unused losses carry forward. On sale, claimed depreciation is recaptured at up to 25%, and gains may owe capital-gains tax (a 1031 exchange can defer both). Figures are a year-1 estimate at your 24.0% rate — not tax advice; consult a CPA.
Schools (NCES district)
- District
- Twiggs County
- NCES district ID
- 1305220
- Math proficiency
- 5% ▼ -15.00%
- Reading proficiency
- 21% ▼ -6.00%
- Median HH income
- $30,760
- Composite
- 10.21/100
- National rank
- #9795
- State rank
- #164 of 174 in GA
Livability — Macon-Bibb County
No livability data for this city. (Only ~50 U.S. cities are tracked.)
Census & demographics
- County
- Bibb County · 164,332 people
- City population
- 143,186
- Metro
- Macon-Bibb County, GA
- Population (ZIP)
- 17,732
- Household income
- $44,809
- Rent vs Own
- Severe rent burden
- 391.0
Population outlook (Twiggs County) Hauer SSP2
- Today (2025)
- 7,018 people
- By 2030
- 6,369 · -9.2%
- By 2040
- 5,162 · -26.4%
- By 2050
- 4,168 · -40.6%
- By 2075
- 2,964 · -57.8%
- By 2100
- 2,624 · -62.6%
Race, ethnicity, and origin ACS 2023
- Neighborhood character
- Majority Black (57%)
- Race & ethnicity
- Black 57% White 38% Two or more races 4% Hispanic / Latino 2%
- Common ancestry
- Slovak 1% Italian 1%
- Foreign-born
- 1% · Canada
- Languages at home
- 98% English-only · Spanish 1%
Political lean MEDSL · Twiggs
- 2024 margin
- R (+14.7) · D 42.5% · R 57.2%
- 2008→2024 swing
- -21.6pp toward R · 2008: 7.0pp · 2024: -14.7pp
- All cycles
- 2024: R+14.7 2020: R+7.3 2016: R+1.6 2012: D+8.7 2008: D+7.0
Not yet ingested
- Civics
- —
Market trends
- HPI YoY
- ▲ 4.31%
- Current HPI
- 209.9166
- Rent YoY
- ▲ 10.85%
- Metro
- Macon-Bibb County, GA
- State GDP YoY
- ▲ 2.66%
- F500 in state
- 28
Industry mix (Fortune 500 HQ in GA)
| Industry | F500 HQs | Revenue |
|---|---|---|
| Paper / Packaging | 2 | $29B |
|
||
| Retail | 1 | $160B |
|
||
| Transportation / Logistics | 1 | $91B |
|
||
| Airlines | 1 | $62B |
|
||
| Consumer Goods | 1 | $47B |
|
||
| Utilities | 1 | $25B |
|
||
Price history
+792.3% since first listed48 events — show timeline
- 2026-05-01 Price Changed $149,900 CGMLS
- 2026-04-14 Price Changed $158,900 CGMLS
- 2026-03-31 Listed $159,000 CGMLS
- 2026-03-06 Listing Removed — GAMLS
- 2026-03-02 Price Changed $139,300 CGMLS
- 2026-03-02 Price Changed $139,300 GAMLS
- 2026-02-20 Price Changed $139,400 CGMLS
- 2026-02-20 Price Changed $139,400 GAMLS
- 2026-02-16 Price Changed $139,500 CGMLS
- 2026-02-16 Price Changed $139,500 GAMLS
- 2026-01-30 Price Changed $139,400 CGMLS
- 2026-01-30 Price Changed $139,400 GAMLS
- 2026-01-23 Price Changed $139,500 CGMLS
- 2026-01-23 Price Changed $139,500 GAMLS
- 2026-01-17 Price Changed $139,600 CGMLS
- 2026-01-17 Price Changed $139,600 GAMLS
- 2026-01-12 Price Changed $139,700 CGMLS
- 2026-01-12 Price Changed $139,700 GAMLS
- 2026-01-03 Price Changed $139,800 CGMLS
- 2026-01-03 Price Changed $139,800 GAMLS
- 2025-12-02 Price Changed $139,900 GAMLS
- 2025-11-29 Price Changed $139,900 CGMLS
- 2025-11-25 Price Changed $159,500 GAMLS
- 2025-11-21 Price Changed $159,500 CGMLS
- 2025-11-14 Price Changed $159,600 CGMLS
- 2025-11-14 Price Changed $159,600 GAMLS
- 2025-11-10 Price Changed $159,700 CGMLS
- 2025-11-03 Price Changed $159,800 CGMLS
- 2025-11-02 Price Changed $159,400 CGMLS
- 2025-10-14 Listed $159,700 GAMLS
- 2025-06-09 Sold (MLS) $34,106 FMLS
- 2025-06-09 Sold (MLS) $34,106 CGMLS
- 2025-06-09 Sold (MLS) $34,106 GAMLS
- 2025-06-02 Pending — GAMLS
- 2025-06-02 Pending — FMLS
- 2025-05-22 Listed $34,106 CGMLS
- 2025-05-14 Price Changed $34,000 GAMLS
- 2025-05-14 Price Changed $34,000 FMLS
- 2025-05-06 Price Changed $39,000 GAMLS
- 2025-05-06 Price Changed $39,000 FMLS
- 2025-03-17 Price Changed $49,000 FMLS
- 2025-03-17 Price Changed $49,000 GAMLS
- 2025-03-06 Listed $55,000 FMLS
- 2025-03-06 Listed $55,000 GAMLS
- 2022-01-12 Sold (Public Records) $80,000 Public Records
- 2021-12-03 Sold (MLS) $25,000 CGMLS
- 2021-11-16 Listed $25,000 CGMLS
- 2012-08-14 Sold (MLS) $16,800 GAMLS
Cash-flow waterfall
monthlySold comps — $/sqft
last 12 mo · ≤1 miLoading sold comps…