 🌊 Lakefront
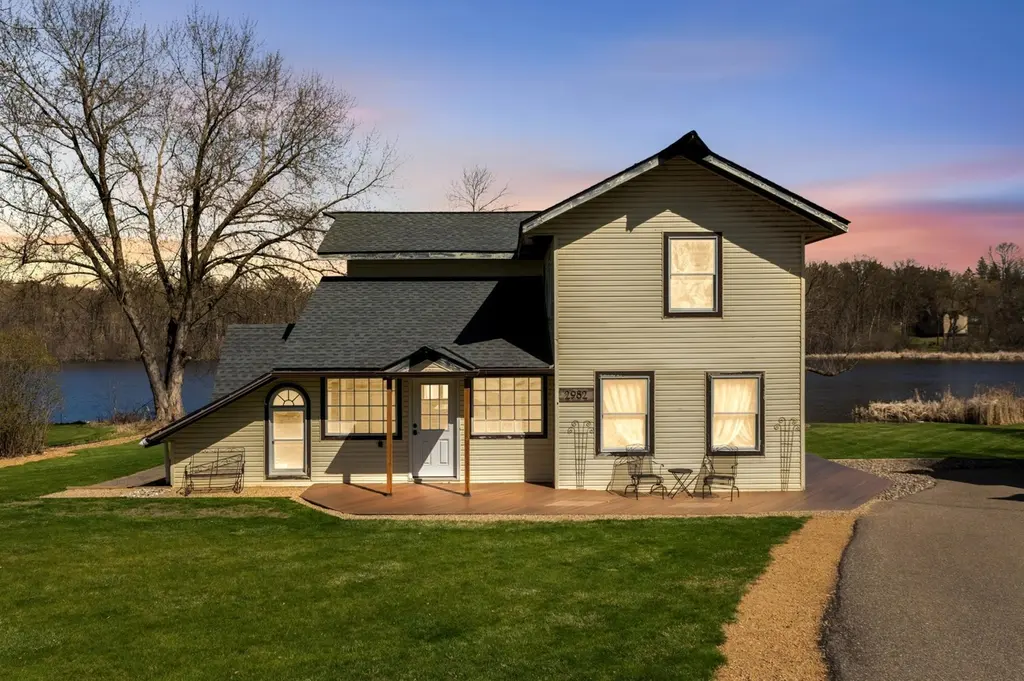
2982 Ardmore Ave · Medina, MN
Flood risk 4/10 · Minor
- FEMA flood zone
- X (shaded)
- Chance of flooding over 30 yrs
- 0.22%
- Est. flood insurance / yr
- $507 – $1,088
Fire risk 1/10 · Minimal
- Est. fire insurance / yr
- $888 – $1,650
Heat risk 2/10 · Minimal
- Hot days now (above 98°F)
- 7 days/yr
- Hot days in 30 yrs
- 14 days/yr
Wind risk 2/10 · Minimal
- Chance of severe wind over 30 yrs
- —
Air-quality risk 2/10 · Minimal
- Unhealthy air days now
- 1 days/yr
- Unhealthy air days in 30 yrs
- 1 days/yr
Risk factors via First Street. Map © Google.
Why this score? — see what drove the C- grade
The composite is a weighted blend of 9 inputs, each scored 0–100. Each bar is that input's sub-score; the figure is the points it added to the 100-point composite (weight × sub-score).
- ARV discount +15.0/15.0
- Cash flow +14.1/30.0
- Schools +6.3/10.0
- DSCR +4.3/10.0
- 1% rule +3.4/10.0
- Livability +3.0/5.0
- Rent growth +2.5/5.0
- Condition / age +2.5/5.0
- Appreciation +0.0/10.0
$475,000
🖨 Deal sheet (PDF) 📄 Offer letter ✓ Due diligence
Listing remarks MLS
Lake Front & Orono Schools!Full of character & charm on a lg. lot & dead end street! Totally remodeled,has lots of built-ins,stone walls & fireplace,beamed and vaulted ceilings,lg. windows over looking lake,master bedroom and hardwood flrs.,see suppl...
Key facts
- 0.41 acre lot
- 2 garage spots
- Built 1955
Property features AI
Finance
- Other: Lot approximately 0.41 acres; Lot dimensions: 70x20x30x154x120x127; Public maintained paved streets
Exterior
- Parking: Attached garage with garage door opener; 2 garage spaces; Additional garage(s), workshop and studio structures
- Utilities: City water connected; City sewer connected; Natural gas
- Home design: Residential property; Two levels; On waterfront (lakefront) with approximately 120 feet of shoreline; Road between home and waterfront: no
- Construction: Block and slab foundation; Roof age 8 years or less
- Exterior features: Composite decking; Deck; Patio; Rear porch; Wrap-around porch; Vinyl exterior; Dock; Light tree coverage
Interior
- Kitchen: Range; Microwave; Refrigerator; Kitchen center island; Walk-in pantry
- Bedrooms: 3 bedrooms (all on upper/main as noted: primary and two additional bedrooms on upper level; one bedroom listed generally)
- Bathrooms: Main level full bathroom; Upper level 3/4 bathroom
- Heating & cooling: Forced air heating; Central air conditioning
- Interior features: Ceiling fans; Vaulted ceiling; Skylight; Water softener (owned); Kitchen/dining room layout; Main floor laundry; Washer/Dryer hookup; Wood-burning fireplace in family room (one fireplace); Has basement (crawl space)
- Laundry & utility: Main level laundry; Dryer; Washer/Dryer hookup; Gas water heater
Neighborhood map
What this means for you Summary
Snapshot
- This is a 3-bed/2.0-bath single-family listed at $475k.
Deal economics
- At list price, monthly cash flow is $72 ($861/yr) — positive.
- The deal already cash-flows at list — no discount required.
- To meet the 1% rule (rent ≥ 1% of price), the offer needs to be $400k (15.9% below list).
- Recommended offer: $400k (15.9% below list) — sets the bar for 1% rule.
- Cap rate 6.5% vs local median 1.0% in Medina — top-decile yield for the area; either an underpriced asset or a hidden risk that comps aren't pricing in. Stress-test before assuming the spread holds.
Location & tenants
- Location reads 60/100 on livability (#756 in MN) — a middle-class / working-renter tenant base. Strengths: crime A+, employment A+, housing A+; Watch: amenities F, commute F, cost of living F.
- Orono Public School District (rural): math 65% / reading 73% proficiency, ranked #9 of 301 in MN (top 3%) — acceptable for families but not a draw, mixed tenant base, ~2y average lease; only 5% free/reduced lunch — higher-income household profile.
- Zoned schools: Orono Intermediate Elementary (math 73% / reading 75%, grade A, #39 of 857 statewide, top 5%, 637 students, 8% FRL); Orono Middle (math 59% / reading 70%, grade A-, #14 of 258 statewide, top 6%, 700 students, 12% FRL); Orono Senior High (math 57% / reading 78%, grade B, #18 of 471 statewide, top 4%, 947 students, 12% FRL).
- Market conditions: 61 active listings in the ZIP; 1 comparable units currently listed for rent nearby; 4,651 units permitted in Hennepin County in 2024 (2,443 in 5+ unit buildings).
Forward outlook
- Local home prices are declining (-3.0%/yr); year-one equity from $3k of loan paydown is wiped out by about $14k of value loss. Plan a longer hold.
- Hennepin County population projected at +30% by 2050 — long-run rental-demand tailwind backs the buy-and-hold thesis.
Negotiation context
- Only 13 days on market — expect competitive offers; lowballing is unlikely to land.
- 5 sale attempts since 27y ago with the ask held roughly flat each time — persistent listings suggest the price (not the market) is what's stuck; bring a comps-based counter.
- Current owner paid $250k; list at $475k implies a 90% gain — meaningful room to come down on a strong offer.
Risks & watch-outs
- Watch-outs: built in 1955 — expect roof / HVAC / electrical / plumbing capex.
Questions for the listing agent
- Built in 1955 — when were the roof, HVAC, electrical panel, plumbing, and water heater last replaced?
- Is there a deadline driving the sale (1031 exchange, divorce, estate, relocation)? That informs how much negotiation room exists.
- This sits on a lake — are riparian / water-frontage rights deeded with the parcel? Any dock permits, shoreline easements, or HOA water-use restrictions?
- What's the documented flood / surge / shoreline-erosion history here (FEMA AND non-FEMA — e.g., storm surge, creek backup, septic-field saturation)?
- Any water-quality or seasonal algae-bloom issues that affect tenant satisfaction or short-term-rental demand?
- What's the average days-on-market for RENTAL listings here right now (not sales)? A rising rental-DOM trend means longer vacancies and softer asking-rent achievability than the comps imply.
- What's the recent tenant-quality profile in this submarket — average credit score on applications, eviction rate, late-payment / NSF rate, and stable-employment percentage? A property-management company in the area should have these aggregated.
- How much new for-sale + rental construction is in the pipeline within 1–3 miles? Heavy new supply typically softens prices + rents 12–24 months out; constrained supply supports both.
Investment metrics
- 1% rule
- 0.84% ✗
- Cap rate
- 6.47%
- Cash-on-cash
- 0.65%
- DSCR
- 1.03
- GRM
- 9.9
CMA / ARV
- ARV (median comp)
- $579,087
- List price
- $475,000
- Delta
- -17.97%
- Verdict
- UNDERPRICED
- Comps
- 2 within 2.0 mi
Show comp detail 1 sale within ~0.75 mi
| Address | Dist | Beds/Ba | Sqft | Sold | Price | $/sf | Match |
|---|---|---|---|---|---|---|---|
| 4801 Becker Rd | 0.98mi | 3/2.5 | 2,065 (+2%) | 17mo | $840,000 | $407 | 45 |
Match score weights: distance 35% · size 25% · config 20% · recency 20%. Top-matched comps best support the ARV.
Projected returns pro-forma
-3.0% appreciation · 3.0% rent growth · sell at horizon
- IRR
- -15.3%
- Equity multiple
- 0.46×
- Total profit
- $-72,460
- Equity at exit
- $70,824
- IRR
- -6.8%
- Equity multiple
- 0.57×
- Total profit
- $-57,459
- Equity at exit
- $41,069
Cash invested: $133,000 (down + closing). Projections, not guarantees.
Landlord ↔ Tenant lean methodology
- Overall (STATE)
- 46 Balanced
- State Minnesota
- 46 Balanced · D+2
- County
- — inherits STATE
- City
- — inherits STATE
ZIP-level market 55359
- Active inventory
- 61
- Price-to-rent
- 9.9×
Monthly cashflow live
- Estimated rent
- $3,995 medium interval (Pro) →
- Mortgage (P&I)
- −$2,491
- Tax from tax record
- −$395 /mo · $4,745/yr
- Insurance
- −$198
- HOA
- −$0
- Vacancy / Maint / Mgmt
- −$839
- Net cashflow
- $72
Break-even live
Sensitivity live
| Price | -10% $341 | -5% $206 | +0% $72 | +5% $-63 | +10% $-197 |
|---|---|---|---|---|---|
| Rent | -10% $-244 | -5% $-86 | +0% $72 | +5% $230 | +10% $387 |
| Rate | -1.0pp $311 | -0.5pp $193 | base $72 | +0.5pp $-51 | +1.0pp $-177 |
UW: 25.0% down · 7.5% · 30yr · 1.5% tax · 5.0% vac · 8.0% maint · 8.0% mgmt
Financing live
Cash to close
- Down payment
- $118,750
- Closing costs
- $14,250
- Reserves months
- —
- Total cash needed
- —
Loan-product check · same deal, 3 products live
Conventional
25% down · 7.5% · 30yr
- Down + closing
- —
- Monthly P&I
- —
- Monthly cashflow
- —
- DSCR
- —
- Eligible?
- —
Personal DTI + credit; lowest rate.
DSCR
20% down · 8.5% · 30yr
- Down + closing
- —
- Monthly P&I
- —
- Monthly cashflow
- —
- DSCR
- —
- Eligible?
- —
No personal income docs; deal must DSCR.
Hard money
10% down · 12.0% · 12mo
- Down + closing
- —
- Monthly P&I
- —
- Monthly cashflow
- —
- DSCR
- —
- Eligible?
- —
Short-term bridge; refi at stabilization.
Rent comps 1 comps
| Address | Beds | Baths | Sqft | Rent | $/sqft | DOM | Units | Dist |
|---|---|---|---|---|---|---|---|---|
| 2930 Lindgren Ln Maple Plain, MN | 4.0 | 2.0 | 2250 | $3,995 | $1.78 | 4d | 1 | 0.92mi |
Listing history 16 events
-
2026-05-14status Pending 778-char remark
-
2026-05-08historical Contingent - Inspection 778-char remark
-
2026-05-04status Active 778-char remark
-
2026-04-28historical Contingent - Inspection 778-char remark
-
2026-04-27status Active 778-char remark
-
2026-04-27historical Contingent - Inspection 778-char remark
-
2026-04-26$475,000 Active 778-char remark
-
2026-04-23historical $475,000 778-char remark
-
2010-07-13soldstatus $250,000
-
2010-07-08soldstatus $250,000 269-char remark
Show marketing remark (269 chars)
Lake Front & Orono Schools!Full of character & charm on a lg. lot & dead end street! Totally remodeled,has lots of built-ins,stone walls & fireplace,beamed and vaulted ceilings,lg. windows over looking lake,master bedroom and hardwood flrs.,see suppl...
-
2010-05-11historical 269-char remark
Show marketing remark (269 chars)
Lake Front & Orono Schools!Full of character & charm on a lg. lot & dead end street! Totally remodeled,has lots of built-ins,stone walls & fireplace,beamed and vaulted ceilings,lg. windows over looking lake,master bedroom and hardwood flrs.,see suppl...
-
2010-03-23$250,000 269-char remark
Show marketing remark (269 chars)
Lake Front & Orono Schools!Full of character & charm on a lg. lot & dead end street! Totally remodeled,has lots of built-ins,stone walls & fireplace,beamed and vaulted ceilings,lg. windows over looking lake,master bedroom and hardwood flrs.,see suppl...
-
1999-08-18soldstatus $89,900
-
1999-08-18soldstatus $89,900
-
1999-07-08historical
-
1999-06-18$89,900
ⓘ Source: listings_history table (triggers on properties + properties_extension) + one-shot
backfill from property_details.listing_events for pre-trigger history.
Tax reassessment forecast MN · Partial reset (capped growth)
- Current annual tax
- $4,745 · $395/mo
- Projected year-2 tax
- $5,032 · $419/mo
- Expected delta
- +$288/yr (+$24/mo · 6.1%)
ⓘ Screening estimate from a state-policy table — verify with the county assessor before closing.
Climate risk First Street
- Flood 4/10 Moderate FEMA zone X (shaded) · 22% chance over 30 yrs
- Wildfire 1/10 Low
- Heat 2/10 Low 7 d/yr ≥98°F today · 14 d/yr by 30 yrs out
- Wind 2/10 Low
- Air quality 2/10 Low 1 unhealthy d/yr today · 1 by 30 yrs out
Nearby sold comps map
Loading sold comps map…
Walkable amenities ~0.75 mi
Loading nearby amenities…
Taxation est. · year 1
- Rental income
- $47,940
- − Mortgage interest
- −$26,607
- − Property taxes
- −$4,745
- − Insurance
- −$2,375
- − Repairs & maintenance
- −$3,835
- − Management
- −$3,835
- − Depreciation
- −$13,818
- Taxable loss
- −$7,276
- Est. tax savings @ 24.0%
- +$1,746
- After-tax cash flow
- $2,608/yr
For passive investors: Depreciation is non-cash, so a rental often shows a tax loss while cash-flowing — sheltering income. Rental losses are passive: they offset passive income freely, and up to $25,000/yr can offset ordinary (W-2) income if you actively participate and your MAGI is under $100k (phasing out to $0 by $150k); unused losses carry forward. On sale, claimed depreciation is recaptured at up to 25%, and gains may owe capital-gains tax (a 1031 exchange can defer both). Figures are a year-1 estimate at your 24.0% rate — not tax advice; consult a CPA.
Schools (NCES district)
- District
- Orono Public School District
- NCES district ID
- 2725080
- Math proficiency
- 65% ▼ -11.00%
- Reading proficiency
- 73% ▼ -6.00%
- Median HH income
- $93,850
- Composite
- 62.7/100
- National rank
- #673
- State rank
- #9 of 301 in MN
Livability — Medina
- Score
- 60/100
- State rank
- #756
- US rank
- #18606
Category grades
Schools grade is shown separately in the Schools card above.
Census & demographics
- Census place
- Medina, MN
- Population (ZIP)
- 7,068
Population outlook (Hennepin County) Hauer SSP2
- Today (2025)
- 1,405,227 people
- By 2030
- 1,492,650 · +6.2%
- By 2040
- 1,660,157 · +18.1%
- By 2050
- 1,823,498 · +29.8%
- By 2075
- 2,221,283 · +58.1%
- By 2100
- 2,509,976 · +78.6%
Race, ethnicity, and origin ACS 2023
- Neighborhood character
- Predominantly White (91%)
- Race & ethnicity
- White 91% Two or more races 5% Hispanic / Latino 2% Black 1% Asian 1%
- Common ancestry
- Portuguese 11% Romanian 5% Lithuanian 5%
- Foreign-born
- 2% · Canada, South Korea, Vietnam
- Languages at home
- 96% English-only · Spanish 2%
Political lean MEDSL · Hennepin
- 2024 margin
- Solid D (+42.6) · D 70.2% · R 27.5% · Other 2.3%
- 2008→2024 swing
- +14.0pp toward D · 2008: 28.6pp · 2024: 42.6pp
- All cycles
- 2024: D+42.6 2020: D+43.2 2016: D+35.3 2012: D+27.1 2008: D+28.6
Not yet ingested
- Civics
- —
Market trends
- HPI YoY
- ▼ -159.80%
- Current HPI
- 261.8218
- Rent YoY
- —
- Metro
- —
- State GDP YoY
- ▲ 2.41%
- F500 in state
- 34
Industry mix (Fortune 500 HQ in MN)
| Industry | F500 HQs | Revenue |
|---|---|---|
| Healthcare | 2 | $407B |
|
||
| Retail | 2 | $150B |
|
||
| Consumer Goods | 2 | $32B |
|
||
| Industrial Machinery | 2 | $6B |
|
||
| Agriculture | 1 | $40B |
|
||
| Healthcare / Medical Devices | 1 | $32B |
|
||
Price history
+428.4% since first listed16 events — show timeline
- 2026-05-14 Pending — NORTHSTARMLS as Distributed by MLS Grid
- 2026-05-08 Contingent — NORTHSTARMLS as Distributed by MLS Grid
- 2026-05-04 Relisted — NORTHSTARMLS as Distributed by MLS Grid
- 2026-04-28 Contingent — NORTHSTARMLS as Distributed by MLS Grid
- 2026-04-27 Relisted — NORTHSTARMLS as Distributed by MLS Grid
- 2026-04-27 Contingent — NORTHSTARMLS as Distributed by MLS Grid
- 2026-04-26 Listed $475,000 NORTHSTARMLS as Distributed by MLS Grid
- 2026-04-23 Coming Soon $475,000 NORTHSTARMLS as Distributed by MLS Grid
- 2010-07-13 Sold (Public Records) $250,000 Public Records
- 2010-07-08 Sold (MLS) $250,000 NORTHSTARMLS as Distributed by MLS Grid
- 2010-05-11 Listing Removed — NORTHSTARMLS as Distributed by MLS Grid
- 2010-03-23 Listed $250,000 NORTHSTARMLS as Distributed by MLS Grid
- 1999-08-18 Sold (Public Records) $89,900 Public Records
- 1999-08-18 Sold (MLS) $89,900 NORTHSTARMLS as Distributed by MLS Grid
- 1999-07-08 Listing Removed — NORTHSTARMLS as Distributed by MLS Grid
- 1999-06-18 Listed $89,900 NORTHSTARMLS as Distributed by MLS Grid
Property tax history
+5.2%/yrLatest (2025): $4,745 · +17.4% YoY. Source: county tax records.
Cash-flow waterfall
monthlySold comps — $/sqft
last 12 mo · ≤1 miLoading sold comps…