 Fourplex
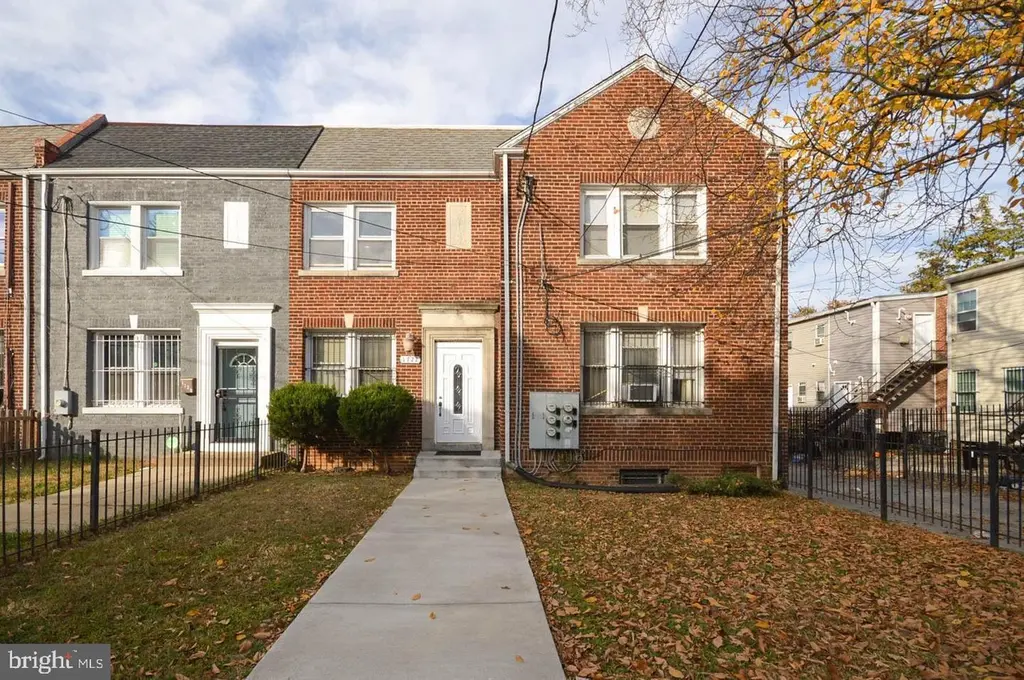
1722 T St SE · Washington, DC
Flood risk 4/10 · Minor
- FEMA flood zone
- X (unshaded)
- Chance of flooding over 30 yrs
- 0.2%
- Est. flood insurance / yr
- $473 – $860
Fire risk 1/10 · Minimal
- Est. fire insurance / yr
- $631 – $1,173
Heat risk 8/10 · Major
- Hot days now (above 104°F)
- 7 days/yr
- Hot days in 30 yrs
- 15 days/yr
Wind risk 4/10 · Minor
- Chance of severe wind over 30 yrs
- 20.0%
Air-quality risk 4/10 · Minor
- Unhealthy air days now
- 4 days/yr
- Unhealthy air days in 30 yrs
- 5 days/yr
Risk factors via First Street. Map © Google.
Why this score? — see what drove the C+ grade
The composite is a weighted blend of 9 inputs, each scored 0–100. Each bar is that input's sub-score; the figure is the points it added to the 100-point composite (weight × sub-score).
- Cash flow +25.3/30.0
- ARV discount +9.2/15.0
- DSCR +8.3/10.0
- 1% rule +6.3/10.0
- Livability +3.7/5.0
- Schools +3.6/10.0
- Rent growth +3.5/5.0
- Condition / age +2.5/5.0
- Appreciation +0.0/10.0
$650,000
🖨 Deal sheet 📄 Offer letter ✓ Due diligence
Multi-family units
County records classify this as Multi-Family (2-4 Unit). Listing-text estimate: 4 units. confirmed
Listing remarks
Charming and fully updated 4-unit apartment building just minutes from downtown Anacostia! This well-maintained property offers a mix of 2-bedroom and 1-bedroom + den units—perfect for tenants or live-in owners. Each unit is self-contained with individual utilities. Recent upgrades include roof, modern kitchens and bathrooms, recessed lighting, updated plumbing, and electrical systems. One unit is currently vacant and move-in ready. Enjoy the convenience of off-street parking and easy access to the Metro, shopping, and local eateries. A reliable on-site caretaker occupies one unit at a reduced rate, providing built-in property oversight.
Key facts
- Modern kitchens
- Updated roof
- Recessed lighting
Tags
Property features AI
Finance
- Financial info: Total of 4 units; Finished above-grade area per assessor; Unfinished below-grade area per assessor
Exterior
- Parking: Concrete driveway; Off-street parking
- Utilities: Public water; Public sewer; Electric available; Natural gas available; Cable TV available
- Home design: Semi-detached building; Fee simple ownership; Very good condition
- Construction: Brick construction; Slab foundation; Built (year per assessor)
- Exterior features: Above-grade and below-grade structures; No tidal water
Interior
- Kitchen: Gas oven/range; Refrigerator
- Bedrooms: Four-unit property with two one-bedroom units and two two-bedroom units
- Flooring: Hardwood
- Heating & cooling: Hot water heating (natural gas); Ceiling fans
- Interior features: Partial basement; Hardwood flooring; Double-pane windows; Exhaust fan
- Laundry & utility: Natural gas water heater
Neighborhood map
What this means for you Summary
Snapshot
- This is a 2×2bd/1ba + 2×1bd/1ba units multifamily listed at $650k.
Deal economics
- At list price, monthly cash flow is $1k ($18k/yr) — positive. Per door: $370/mo.
- The deal already cash-flows at list — no discount required.
- Meets the 1% rule at list price ($7k rent vs $650k).
- Recommended offer: $630k (3.0% below list) — sets the bar for market timing.
- Cap rate 9.0% vs local median 2.5% in Washington — top-decile yield for the area; either an underpriced asset or a hidden risk that comps aren't pricing in. Stress-test before assuming the spread holds.
Location & tenants
- Location reads 73/100 on livability (#1 in DC) — a middle-class / working-renter tenant base. Strengths: amenities A+, commute A+, employment A+; Watch: crime F, cost of living F.
- District Of Columbia Public Schools (urban): math 33% / reading 40% proficiency, ranked #8 of 32 in DC (top 25%) — families likely to look elsewhere, expect single-tenant / working-renter base with shorter leases; 65% free/reduced lunch — lower-income household profile, screen leases tightly.
- Market conditions: Rents rising (+3.9%/yr); 296 active listings in the ZIP; 7 comparable units currently listed for rent nearby; rentals at typical pace (median 24d on market — plan ~3-4 weeks tenant-placement turnaround); 1,737 units permitted in District of Columbia in 2024 (1,506 in 5+ unit buildings).
- At $7,329/mo this rent would consume 163% of the median local household income ($54k/yr) (locally 5148% of renters already pay >50% of income on rent) — very limited rent-growth headroom before tenants either downsize or default.
Forward outlook
- Local home prices are declining (-3.0%/yr); year-one equity from $4k of loan paydown is wiped out by about $20k of value loss. Plan a longer hold.
- District of Columbia County population projected at +50% by 2050 — long-run rental-demand tailwind backs the buy-and-hold thesis.
- At projected returns (-3.0% appreciation + 3.9% rent growth), your $182k cash investment doubles in ~10 years — after that, you're playing with house money.
Negotiation context
- It's been on market 37 days — a 3% lower offer ($630k) is reasonable based on typical stale-listing flexibility.
- 12 sale attempts since 32y ago with the ask held roughly flat each time — persistent listings suggest the price (not the market) is what's stuck; bring a comps-based counter.
- Current owner paid $371k; list at $650k implies a 75% gain — meaningful room to come down on a strong offer.
Risks & watch-outs
- Watch-outs: built in 1938 — expect roof / HVAC / electrical / plumbing capex.
- Climate carrying-cost: extreme-heat days projected 7→15/yr by 2055 (HVAC capex compounding) — expect insurance premiums to compound above CPI over the hold.
Questions for the listing agent
- It's been on market 37 days. Have you received any prior offers? Is the seller open to a 3% concession, seller financing, or rate buy-down credit?
- Can we see the unit-by-unit rent roll, current vacancy, and any below-market leases? What's the average tenancy length?
- What capital expenditures (roof, boiler, parking lot, exteriors) have been made in the last 5 years, and what's planned in the next 2?
- Built in 1938 — when were the roof, HVAC, electrical panel, plumbing, and water heater last replaced?
- Is there a deadline driving the sale (1031 exchange, divorce, estate, relocation)? That informs how much negotiation room exists.
- Crime grade is F in this area — have there been break-ins, vandalism, or insurance claims at this property in the last 3 years? What carrier currently insures it and at what premium?
- What's the average days-on-market for RENTAL listings here right now (not sales)? A rising rental-DOM trend means longer vacancies and softer asking-rent achievability than the comps imply.
- What's the recent tenant-quality profile in this submarket — average credit score on applications, eviction rate, late-payment / NSF rate, and stable-employment percentage? A property-management company in the area should have these aggregated.
- How much new apartment / multifamily construction is in the pipeline within 1–3 miles? Heavy new supply (>2% of stock underway) typically softens rents 12–24 months out; light construction supports rent growth.
Investment metrics
- 1% rule
- 1.13% ✓
- Cap rate
- 9.02%
- Cash-on-cash
- 9.75%
- DSCR
- 1.43
- GRM
- 7.4
CMA / ARV
- ARV (on-the-fly)
- $675,024
- Comps found
- 2
Show comp detail 2 sales within ~0.75 mi
| Address | Dist | Beds/Ba | Sqft | Sold | Price | $/sf | Match |
|---|---|---|---|---|---|---|---|
| 1722 T St SE | 0.00mi | 6/4.0 | 3,444 (0%) | 0mo | $590,000 | $171 | 100 |
| 2505 Burns SE | 0.69mi | 5/— (-1) | 3,471 (+1%) | 14mo | $680,000 | $196 | 50 |
Match score weights: distance 35% · size 25% · config 20% · recency 20%. Top-matched comps best support the ARV.
Projected returns pro-forma
-3.0% appreciation · 3.86% rent growth · sell at horizon
- IRR
- -0.7%
- Equity multiple
- 0.97×
- Total profit
- $-4,778
- Equity at exit
- $96,917
- IRR
- 9.8%
- Equity multiple
- 1.79×
- Total profit
- $143,787
- Equity at exit
- $56,200
Cash invested: $182,000 (down + closing). Projections, not guarantees.
Landlord ↔ Tenant lean methodology
- Overall (CITY)
- 0 Strongly Tenant-Friendly
- State District of Columbia
- 12 Strongly Tenant-Friendly · D+43
- County
- — inherits STATE
- City Washington
- 0 Strongly Tenant-Friendly · D+43
ZIP-level market 20020
- Rents YoY
- 3.9%
- Active inventory
- 296
- Price-to-rent
- 27.9×
Monthly cashflow live
- Estimated rent
- $7,329 high interval (Pro) →
- Mortgage (P&I)
- −$3,409
- Tax from tax record
- −$632 /mo · $7,585/yr
- Insurance
- −$271
- HOA
- −$0
- Vacancy / Maint / Mgmt
- −$1,539
- Net cashflow
- $1,478
Break-even live
4-unit breakdown (identical units grouped — click to expand)
| Units | Beds | Baths | Est. rent |
|---|---|---|---|
| 2× units | 2 | 1 | $3,878 |
| #1 | 2 | 1 | $1,939 |
| #2 | 2 | 1 | $1,939 |
| 2× units | 1 | 1 | $3,452 |
| #3 | 1 | 1 | $1,726 |
| #4 | 1 | 1 | $1,726 |
| Total (4 units) | $7,329 | ||
UW: 25.0% down · 7.5% · 30yr · 1.5% tax · 5.0% vac · 8.0% maint · 8.0% mgmt
Financing live
Cash to close
- Down payment
- $162,500
- Closing costs
- $19,500
- Reserves months
- —
- Total cash needed
- —
Loan-product check · same deal, 3 products live
Conventional
25% down · 7.5% · 30yr
- Down + closing
- —
- Monthly P&I
- —
- Monthly cashflow
- —
- DSCR
- —
- Eligible?
- —
Personal DTI + credit; lowest rate.
DSCR
20% down · 8.5% · 30yr
- Down + closing
- —
- Monthly P&I
- —
- Monthly cashflow
- —
- DSCR
- —
- Eligible?
- —
No personal income docs; deal must DSCR.
Hard money
10% down · 12.0% · 12mo
- Down + closing
- —
- Monthly P&I
- —
- Monthly cashflow
- —
- DSCR
- —
- Eligible?
- —
Short-term bridge; refi at stabilization.
Rent comps 7 comps
| Address | Beds | Baths | Sqft | Rent | $/sqft | DOM | Units | Dist |
|---|---|---|---|---|---|---|---|---|
| 1726 Gainesville St SE Unit 1726 20020 Washington, DC | 6.0 | 3.5 | 2400 | $7,000 | $2.92 | 24d | 1 | 0.87mi |
| 3012 Alabama Ave SE Washington, DC | 6.0 | 2.0 | 2361 | $6,800 | $2.88 | 24d | 1 | 0.98mi |
| 2211 32nd Pl SE Washington, DC | 7.0 | 3.0 | 2569 | $8,300 | $3.23 | 24d | 1 | 1.11mi |
| 2530 Elvans Rd SE Unit B Washington, DC | 5.0 | 3.5 | 2760 | $7,500 | $2.72 | 7d | 1 | 1.11mi |
| 2530 Elvans Rd SE Washington, DC | 7.0 | 3.5 | 2760 | $8,500 | $3.08 | 3d | 1 | 1.11mi |
| 3422 Pennsylvania Ave SE Washington, DC | 5.0 | 2.5 | 2520 | $5,500 | $2.18 | 20d | 1 | 1.36mi |
| 3505 N St SE Washington, DC | 6.0 | 3.0 | 2668 | $7,150 | $2.68 | 24d | 1 | 1.42mi |
Listing history 37 events
-
2026-05-16status Pending
-
2026-04-09$650,000 Active
-
2025-10-01historical
-
2025-08-05status Active
-
2025-06-21status Pending
-
2025-06-21price $688,000
-
2025-06-11$650,000 Active
-
2025-03-24historical
-
2024-12-01$801,000 Active
-
2024-11-15historical
-
2009-12-31soldstatus $371,000 Sold
-
2009-12-31soldstatus $371,000
-
2009-12-30status Contract
-
2009-12-03historical
-
2009-09-29price $359,000
-
2009-09-15price $389,000
-
2009-08-25$399,000 Active
-
2009-08-25$359,000
-
2009-07-18historical
-
2009-07-18historical
-
2009-07-01price
-
2009-06-18historical
-
2009-06-18historical
-
2009-04-18
-
2009-04-17$399,000
-
2009-02-09price
-
2009-01-26price
-
2009-01-26
-
2009-01-26$479,000
-
2008-04-10soldstatus $250,000
-
2008-03-27historical
-
2008-03-20$289,900
-
1995-02-10soldstatus $115,000
-
1995-02-08soldstatus $115,000
-
1994-12-14historical
-
1994-08-22$115,000
-
1985-05-08soldstatus $78,400
ⓘ Source: listings_history table (triggers on properties + properties_extension) + one-shot
backfill from property_details.listing_events for pre-trigger history.
Tax reassessment forecast DC · Partial reset (capped growth)
- Current annual tax
- $7,585 · $632/mo
- Projected year-2 tax
- $7,585 · $632/mo
- Expected delta
- $0/yr ($0/mo · 0.0%)
ⓘ Screening estimate from a state-policy table — verify with the county assessor before closing.
Climate risk First Street
- Flood 4/10 Moderate FEMA zone X (unshaded) · 20% chance over 30 yrs
- Wildfire 1/10 Low
- Heat 8/10 Severe 7 d/yr ≥104°F today · 15 d/yr by 30 yrs out
- Wind 4/10 Moderate 20% chance of damaging wind over 30 yrs
- Air quality 4/10 Moderate 4 unhealthy d/yr today · 5 by 30 yrs out
Nearby sold comps map
Loading sold comps map…
Walkable amenities ~0.75 mi
Loading nearby amenities…
Taxation est. · year 1
- Rental income
- $87,948
- − Mortgage interest
- −$36,410
- − Property taxes
- −$7,585
- − Insurance
- −$3,250
- − Repairs & maintenance
- −$7,036
- − Management
- −$7,036
- − Depreciation
- −$18,909
- Taxable income
- $7,722
- Est. tax owed @ 24.0%
- −$1,853
- After-tax cash flow
- $15,887/yr
For passive investors: Depreciation is non-cash, so a rental often shows a tax loss while cash-flowing — sheltering income. Rental losses are passive: they offset passive income freely, and up to $25,000/yr can offset ordinary (W-2) income if you actively participate and your MAGI is under $100k (phasing out to $0 by $150k); unused losses carry forward. On sale, claimed depreciation is recaptured at up to 25%, and gains may owe capital-gains tax (a 1031 exchange can defer both). Figures are a year-1 estimate at your 24.0% rate — not tax advice; consult a CPA.
Schools (NCES district)
- District
- District Of Columbia Public Schools
- NCES district ID
- 1100030
- Math proficiency
- 33% ▲ 3.00%
- Reading proficiency
- 40% ▲ 5.00%
- Median HH income
- $67,671
- Composite
- 35.84/100
- National rank
- #9606
- State rank
- #8 of 32 in DC
Livability — Washington
- Score
- 73/100
- State rank
- #1
- US rank
- #5327
Category grades
Schools grade is shown separately in the Schools card above.
Census & demographics
- Census place
- Washington, DC
- County
- District of Columbia · 671,873 people
- City population
- 671,873
- Metro
- Washington-Arlington-Alexandria, DC-VA-MD-WV
- Population (ZIP)
- 53,005
- Household income
- $54,032
- Rent vs Own
- Severe rent burden
- 5148.0
Population outlook (District of Columbia County) Hauer SSP2
- Today (2025)
- 821,926 people
- By 2030
- 899,517 · +9.4%
- By 2040
- 1,061,162 · +29.1%
- By 2050
- 1,231,493 · +49.8%
- By 2075
- 1,603,312 · +95.1%
- By 2100
- 1,847,141 · +124.7%
Race, ethnicity, and origin ACS 2023
- Neighborhood character
- Predominantly Black (90%)
- Race & ethnicity
- Black 90% Two or more races 3% Hispanic / Latino 3% White 3%
- Common ancestry
- Lithuanian 1%
- Foreign-born
- 3% · Canada
- Languages at home
- 95% English-only · Spanish 2% French/Haitian/Cajun 1%
Political lean MEDSL · District of Columbia
- 2024 margin
- Solid D (+86.1) · D 91.2% · R 5.1% · Other 3.8%
- 2008→2024 swing
- +0.1pp no change · 2008: 85.9pp · 2024: 86.1pp
- All cycles
- 2024: D+86.1 2020: D+86.8 2016: D+88.7 2012: D+84.2 2008: D+85.9
Not yet ingested
- Civics
- —
Market trends
- HPI YoY
- ▼ -415.44%
- Current HPI
- 306.5068
- Rent YoY
- ▲ 3.86%
- Metro
- Washington-Arlington-Alexandria, DC-VA-MD-WV
- State GDP YoY
- ▲ 1.33%
- F500 in state
- 6
Industry mix (Fortune 500 HQ in DC)
| Industry | F500 HQs | Revenue |
|---|---|---|
| Financial Services | 1 | $153B |
|
||
| Life Sciences / Industrials | 1 | $25B |
|
||
| Industrial Machinery | 1 | $8B |
|
||
Price history
+729.1% since first listed37 events — show timeline
- 2026-05-16 Pending — BRIGHT MLS
- 2026-04-09 Listed $650,000 BRIGHT MLS
- 2025-10-01 Listing Removed — BRIGHT MLS
- 2025-08-05 Relisted — BRIGHT MLS
- 2025-06-21 Pending — BRIGHT MLS
- 2025-06-21 Price Changed $688,000 BRIGHT MLS
- 2025-06-11 Listed $650,000 BRIGHT MLS
- 2025-03-24 Listing Removed — BRIGHT MLS
- 2024-12-01 Listed $801,000 BRIGHT MLS
- 2024-11-15 Coming Soon — BRIGHT MLS
- 2009-12-31 Sold (MLS) $371,000 BRIGHT MLS
- 2009-12-31 Sold (MLS) $371,000 MRIS
- 2009-12-30 Pending — MRIS
- 2009-12-03 Listing Removed — BRIGHT MLS
- 2009-09-29 Price Changed $359,000 MRIS
- 2009-09-15 Price Changed $389,000 MRIS
- 2009-08-25 Listed $399,000 MRIS
- 2009-08-25 Listed $359,000 BRIGHT MLS
- 2009-07-18 Delisted — MRIS
- 2009-07-18 Listing Removed — BRIGHT MLS
- 2009-07-01 Price Changed — MRIS
- 2009-06-18 Delisted — MRIS
- 2009-06-18 Listing Removed — BRIGHT MLS
- 2009-04-18 Listed — MRIS
- 2009-04-17 Listed $399,000 BRIGHT MLS
- 2009-02-09 Price Changed — MRIS
- 2009-01-26 Price Changed — MRIS
- 2009-01-26 Listed — MRIS
- 2009-01-26 Listed $479,000 BRIGHT MLS
- 2008-04-10 Sold (MLS) $250,000 MRIS
- 2008-03-27 Delisted — MRIS
- 2008-03-20 Listed $289,900 MRIS
- 1995-02-10 Sold (Public Records) $115,000 Public Records
- 1995-02-08 Sold (MLS) $115,000 MRIS
- 1994-12-14 Delisted — MRIS
- 1994-08-22 Listed $115,000 MRIS
- 1985-05-08 Sold (Public Records) $78,400 Public Records
Property tax history
+6.0%/yrLatest (2025): $7,585 · +1.4% YoY. Source: county tax records.
Cash-flow waterfall
monthlySold comps — $/sqft
last 12 mo · ≤1 miLoading sold comps…