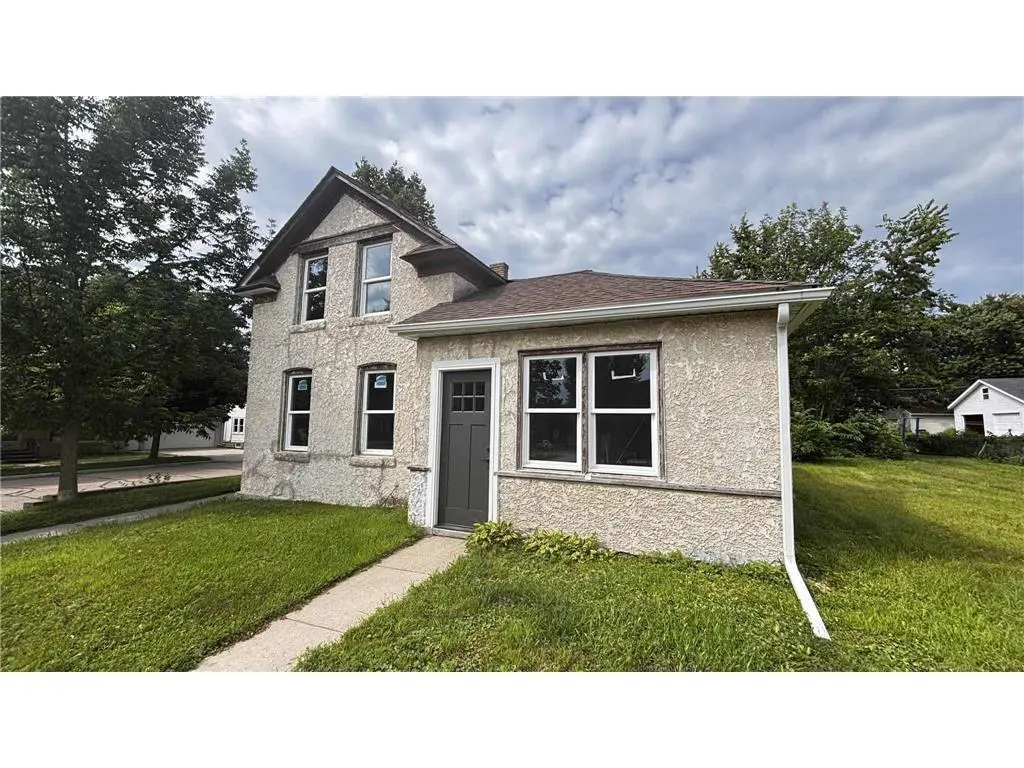
101 N Cedar St · Chaska, MN
Flood risk 1/10 · Minimal
- FEMA flood zone
- X (shaded)
- Chance of flooding over 30 yrs
- 0.0%
- Est. flood insurance / yr
- $507 – $1,088
Fire risk 1/10 · Minimal
- Est. fire insurance / yr
- $888 – $1,650
Heat risk 2/10 · Minimal
- Hot days now (above 100°F)
- 7 days/yr
- Hot days in 30 yrs
- 14 days/yr
Wind risk 2/10 · Minimal
- Chance of severe wind over 30 yrs
- —
Air-quality risk 2/10 · Minimal
- Unhealthy air days now
- 1 days/yr
- Unhealthy air days in 30 yrs
- 2 days/yr
Risk factors via First Street. Map © Google.
Why this score? — see what drove the C+ grade
The composite is a weighted blend of 9 inputs, each scored 0–100. Each bar is that input's sub-score; the figure is the points it added to the 100-point composite (weight × sub-score).
- Cash flow +21.8/30.0
- ARV discount +15.0/15.0
- DSCR +7.0/10.0
- 1% rule +5.5/10.0
- Schools +5.2/10.0
- Livability +4.0/5.0
- Rent growth +3.2/5.0
- Condition / age +2.5/5.0
- Appreciation +0.0/10.0
$147,900
🖨 Deal sheet (PDF) 📄 Offer letter ✓ Due diligence
Listing remarks MLS
Fabulous opportunity for a rehab or teardown & rebuild! Great location within a short walk of coffee shops, shopping, dining, and downtown Chaska!
Key facts
- Built 1886
- Listed 45 days
Property features AI
Finance
- Financial info: Annual taxes listed for 2026
- HOA & community: $35 other annual assessment
Exterior
- Parking: On-street parking only
- Utilities: City water (in street); City sewer (in street); Natural gas
- Home design: Residential property; One and one-half levels; Main living area approximately 1,014 square feet
- Construction: Foundation described as other
- Exterior features: Stucco exterior; Lot approximately 4,792 square feet
Interior
- Bedrooms: 2 bedrooms
- Bathrooms: 1 full bathroom
- Heating & cooling: Forced air heating; No cooling
- Interior features: Basement with unspecified/other features; Forced air heating; No central cooling
Neighborhood map
What this means for you Summary
Snapshot
- This is a 2-bed/1.0-bath single-family listed at $148k.
Deal economics
- At list price, monthly cash flow is $229 ($3k/yr) — positive.
- The deal already cash-flows at list — no discount required.
- Meets the 1% rule at list price ($2k rent vs $148k).
- Recommended offer: $143k (3.0% below list) — sets the bar for market timing.
- Cap rate 8.2% vs local median 2.5% in Chaska — top-decile yield for the area; either an underpriced asset or a hidden risk that comps aren't pricing in. Stress-test before assuming the spread holds.
Location & tenants
- Location reads 80/100 on livability (#75 in MN, #1,802 nationally) — a professional / high-income tenant draw. Strengths: crime A+, commute A+, employment A+; Watch: cost of living C-, amenities F, health & safety F.
- Eastern Carver County Public School (suburban): math 52% / reading 61% proficiency, ranked #41 of 301 in MN (top 14%) — acceptable for families but not a draw, mixed tenant base, ~2y average lease; only 14% free/reduced lunch — higher-income household profile.
- Zoned schools: Clover Ridge Elementary (math 56% / reading 59%, grade C+, #261 of 857 statewide, top 31%, 657 students, 27% FRL); Chaska Middle School West (math 41% / reading 59%, grade C, #77 of 258 statewide, top 31%, 599 students, 20% FRL); Chaska High School (math 52% / reading 59%, grade C, #80 of 471 statewide, top 17%, 1,584 students, 26% FRL).
- Market conditions: Rents rising (+3.0%/yr); 298 active listings in the ZIP; 6 comparable units currently listed for rent nearby; rentals leasing fast (median 0d on market — plan ~1-2 weeks tenant-placement turnaround); high-income renter base; 682 units permitted in Carver County in 2024 (6 in 5+ unit buildings).
- This rent is only 17% of the median local income ($112k/yr) — well below the 30% rent-burden line; pricing power to push rent on renewal without tenant pushback.
Forward outlook
- Local home prices are declining (-3.0%/yr); year-one equity from $1k of loan paydown is wiped out by about $4k of value loss. Plan a longer hold.
- Carver County population projected at +29% by 2050 — long-run rental-demand tailwind backs the buy-and-hold thesis.
Negotiation context
- It's been on market 45 days — a 3% lower offer ($143k) is reasonable based on typical stale-listing flexibility.
- 4 sale attempts since 29y ago; this cycle's ask has dropped $17k (10%) from the opening price — seller is motivated, your offer sets the floor, not the list.
- Current owner paid $117k; 26% above their basis — modest negotiation headroom, anchor on the comps not their cost.
Risks & watch-outs
- Watch-outs: built in 1886 — expect roof / HVAC / electrical / plumbing capex.
Questions for the listing agent
- It's been on market 45 days. Have you received any prior offers? Is the seller open to a 3% concession, seller financing, or rate buy-down credit?
- Built in 1886 — when were the roof, HVAC, electrical panel, plumbing, and water heater last replaced?
- Is there a deadline driving the sale (1031 exchange, divorce, estate, relocation)? That informs how much negotiation room exists.
- Schools are A-rated — typically a magnet for longer-tenancy family renters. What's the average tenant stay here, and is there a school-zone premium baked into asking?
- What's the average days-on-market for RENTAL listings here right now (not sales)? A rising rental-DOM trend means longer vacancies and softer asking-rent achievability than the comps imply.
- What's the recent tenant-quality profile in this submarket — average credit score on applications, eviction rate, late-payment / NSF rate, and stable-employment percentage? A property-management company in the area should have these aggregated.
- How much new for-sale + rental construction is in the pipeline within 1–3 miles? Heavy new supply typically softens prices + rents 12–24 months out; constrained supply supports both.
Investment metrics
- 1% rule
- 1.05% ✓
- Cap rate
- 8.15%
- Cash-on-cash
- 6.64%
- DSCR
- 1.30
- GRM
- 7.9
CMA / ARV
- ARV (on-the-fly)
- $271,800
- Comps found
- 1
Show comp detail 1 sale within ~0.75 mi
| Address | Dist | Beds/Ba | Sqft | Sold | Price | $/sf | Match |
|---|---|---|---|---|---|---|---|
| 115 N Pine St | 0.07mi | 3/1.0 (+1) | 1,004 (+11%) | 12mo | $301,000 | $300 | 64 |
Match score weights: distance 35% · size 25% · config 20% · recency 20%. Top-matched comps best support the ARV.
Projected returns pro-forma
-3.0% appreciation · 2.98% rent growth · sell at horizon
- IRR
- -6.1%
- Equity multiple
- 0.77×
- Total profit
- $-9,382
- Equity at exit
- $22,052
- IRR
- 3.5%
- Equity multiple
- 1.25×
- Total profit
- $10,550
- Equity at exit
- $12,788
Cash invested: $41,412 (down + closing). Projections, not guarantees.
Landlord ↔ Tenant lean methodology
- Overall (STATE)
- 46 Balanced
- State Minnesota
- 46 Balanced · D+2
- County
- — inherits STATE
- City
- — inherits STATE
ZIP-level market 55318
- Rents YoY
- 3.0%
- Active inventory
- 298
- Price-to-rent
- 7.9×
Monthly cashflow live
- Estimated rent
- $1,557 high interval (Pro) →
- Mortgage (P&I)
- −$776
- Tax from tax record
- −$163 /mo · $1,958/yr
- Insurance
- −$62
- HOA
- −$0
- Vacancy / Maint / Mgmt
- −$327
- Net cashflow
- $229
Break-even live
Sensitivity live
| Price | -10% $313 | -5% $271 | +0% $229 | +5% $187 | +10% $146 |
|---|---|---|---|---|---|
| Rent | -10% $106 | -5% $168 | +0% $229 | +5% $291 | +10% $352 |
| Rate | -1.0pp $304 | -0.5pp $267 | base $229 | +0.5pp $191 | +1.0pp $152 |
UW: 25.0% down · 7.5% · 30yr · 1.5% tax · 5.0% vac · 8.0% maint · 8.0% mgmt
Financing live
Cash to close
- Down payment
- $36,975
- Closing costs
- $4,437
- Reserves months
- —
- Total cash needed
- —
Loan-product check · same deal, 3 products live
Conventional
25% down · 7.5% · 30yr
- Down + closing
- —
- Monthly P&I
- —
- Monthly cashflow
- —
- DSCR
- —
- Eligible?
- —
Personal DTI + credit; lowest rate.
DSCR
20% down · 8.5% · 30yr
- Down + closing
- —
- Monthly P&I
- —
- Monthly cashflow
- —
- DSCR
- —
- Eligible?
- —
No personal income docs; deal must DSCR.
Hard money
10% down · 12.0% · 12mo
- Down + closing
- —
- Monthly P&I
- —
- Monthly cashflow
- —
- DSCR
- —
- Eligible?
- —
Short-term bridge; refi at stabilization.
Rent comps 6 comps
| Address | Beds | Baths | Sqft | Rent | $/sqft | DOM | Units | Dist |
|---|---|---|---|---|---|---|---|---|
| 412 N Cedar St Chaska, MN | 1.0 | 1.0 | 525 | $995 | $1.90 | 3d | 1 | 0.23mi |
| 1045 Yellow Brick Rd Chaska, MN | 1.0–2.0 | 1.0–2.0 | 964 | $1,745 | $1.81 | 0d | 6 | 0.82mi |
| 135 Crosstown Blvd Ste A Chaska, MN | 1.0 | 1.0 | 640 | $1,165 | $1.82 | 0d | 2 | 1.00mi |
| 340 Crosstown Blvd Chaska, MN | 2.0–3.0 | 1.0 | 926 | $1,622 | $1.75 | 0d | 6 | 1.09mi |
| 1200 Crosstown Blvd Chaska, MN | 2.0 | 1.0 | 830 | $1,620 | $1.95 | 0d | 2 | 1.12mi |
| 325 Engler Blvd Chaska, MN | 1.0–3.0 | 1.0–2.0 | 1093 | $1,962 | $1.79 | 0d | 17 | 1.47mi |
Listing history 30 events
-
2026-06-21days on market $147,900 Active 45 DOM
-
2026-06-18days on market $147,900 Active 42 DOM
-
2026-06-17pricedays on market $147,900 Active 41 DOM
-
2026-06-16days on market $154,900 Active 40 DOM
-
2026-06-15days on market $154,900 Active 39 DOM
-
2026-06-13days on market $154,900 Active 37 DOM
-
2026-06-13days on market $154,900 Active 36 DOM
-
2026-06-09days on market $154,900 Active 33 DOM
-
2026-06-08days on market $154,900 Active 32 DOM
-
2026-06-07days on market $154,900 Active 31 DOM
-
2026-06-04days on market $154,900 Active 28 DOM
-
2026-06-03days on market $154,900 Active 27 DOM
-
2026-06-02days on market $154,900 Active 26 DOM
-
2026-06-01days on market $154,900 Active 25 DOM
-
2026-05-31days on market $154,900 Active 24 DOM
-
2026-05-23price $154,900
-
2026-05-07$164,900 Active
-
2026-01-15status Pending
-
2026-01-15historical
-
2025-10-13price $165,000
-
2025-09-25price $175,000
-
2025-08-26$185,000 Active
-
2022-03-18soldstatus $117,000 Sold 150-char remark
Show marketing remark (150 chars)
Fabulous opportunity for a rehab or teardown & rebuild! Great location within a short walk of coffee shops, shopping, dining, and downtown Chaska!
-
2022-03-18soldstatus $117,000
Show marketing remark (150 chars)
Fabulous opportunity for a rehab or teardown & rebuild! Great location within a short walk of coffee shops, shopping, dining, and downtown Chaska!
-
2022-03-02status Pending 150-char remark
Show marketing remark (150 chars)
Fabulous opportunity for a rehab or teardown & rebuild! Great location within a short walk of coffee shops, shopping, dining, and downtown Chaska!
-
2022-02-25$119,900 Active 150-char remark
Show marketing remark (150 chars)
Fabulous opportunity for a rehab or teardown & rebuild! Great location within a short walk of coffee shops, shopping, dining, and downtown Chaska!
-
2022-02-23historical $119,900 150-char remark
Show marketing remark (150 chars)
Fabulous opportunity for a rehab or teardown & rebuild! Great location within a short walk of coffee shops, shopping, dining, and downtown Chaska!
-
1997-05-30soldstatus $63,900
-
1997-05-09historical
-
1997-03-10$65,900
ⓘ Source: listings_history table (triggers on properties + properties_extension) + one-shot
backfill from property_details.listing_events for pre-trigger history.
Tax reassessment forecast MN · Partial reset (capped growth)
- Current annual tax
- $1,958 · $163/mo
- Projected year-2 tax
- $1,958 · $163/mo
- Expected delta
- $0/yr ($0/mo · 0.0%)
ⓘ Screening estimate from a state-policy table — verify with the county assessor before closing.
Climate risk First Street
- Flood 1/10 Low FEMA zone X (shaded) · 0% chance over 30 yrs
- Wildfire 1/10 Low
- Heat 2/10 Low 7 d/yr ≥100°F today · 14 d/yr by 30 yrs out
- Wind 2/10 Low
- Air quality 2/10 Low 1 unhealthy d/yr today · 2 by 30 yrs out
Nearby sold comps map
Loading sold comps map…
Walkable amenities ~0.75 mi
Loading nearby amenities…
Taxation est. · year 1
- Rental income
- $18,679
- − Mortgage interest
- −$8,285
- − Property taxes
- −$1,958
- − Insurance
- −$740
- − Repairs & maintenance
- −$1,494
- − Management
- −$1,494
- − Depreciation
- −$4,303
- Taxable income
- $406
- Est. tax owed @ 24.0%
- −$97
- After-tax cash flow
- $2,654/yr
For passive investors: Depreciation is non-cash, so a rental often shows a tax loss while cash-flowing — sheltering income. Rental losses are passive: they offset passive income freely, and up to $25,000/yr can offset ordinary (W-2) income if you actively participate and your MAGI is under $100k (phasing out to $0 by $150k); unused losses carry forward. On sale, claimed depreciation is recaptured at up to 25%, and gains may owe capital-gains tax (a 1031 exchange can defer both). Figures are a year-1 estimate at your 24.0% rate — not tax advice; consult a CPA.
Schools (NCES district)
- District
- Eastern Carver County Public School
- NCES district ID
- 2708190
- Math proficiency
- 52% ▼ -9.00%
- Reading proficiency
- 61% ▼ -6.00%
- Median HH income
- $87,010
- Composite
- 51.68/100
- National rank
- #1694
- State rank
- #41 of 301 in MN
Livability — Chaska
- Score
- 80/100
- State rank
- #75
- US rank
- #1802
Category grades
Schools grade is shown separately in the Schools card above.
Census & demographics
- Census place
- Chaska, MN
- County
- Carver County · 77,775 people
- City population
- 30,369
- Metro
- Minneapolis-St. Paul-Bloomington, MN-WI
- Population (ZIP)
- 30,369
- Household income
- $112,243
- Rent vs Own
- Severe rent burden
- 454.0
Population outlook (Carver County) Hauer SSP2
- Today (2025)
- 115,077 people
- By 2030
- 122,880 · +6.8%
- By 2040
- 137,210 · +19.2%
- By 2050
- 148,524 · +29.1%
- By 2075
- 174,624 · +51.7%
- By 2100
- 185,806 · +61.5%
Race, ethnicity, and origin ACS 2023
- Neighborhood character
- Predominantly White (82%)
- Race & ethnicity
- White 82% Hispanic / Latino 9% Two or more races 8% Asian 4% Black 2%
- Hispanic origin (detail)
- Mexican 4%
- Common ancestry
- Portuguese 12% Lithuanian 4% Italian 3%
- Foreign-born
- 7% · Canada, Vietnam, South Korea
- Languages at home
- 89% English-only · Spanish 6% Other Asian/Pacific 1% Vietnamese 1%
Political lean MEDSL · Carver
- 2024 margin
- Lean R (+5.4) · D 46.3% · R 51.7% · Other 2.0%
- 2008→2024 swing
- +9.7pp toward D · 2008: -15.1pp · 2024: -5.4pp
- All cycles
- 2024: R+5.4 2020: R+4.9 2016: R+13.7 2012: R+19.7 2008: R+15.1
Not yet ingested
- Civics
- —
Market trends
- HPI YoY
- ▼ -167.82%
- Current HPI
- 209.4969
- Rent YoY
- ▲ 2.98%
- Metro
- Minneapolis-St. Paul-Bloomington, MN-WI
- State GDP YoY
- ▲ 2.41%
- F500 in state
- 34
Industry mix (Fortune 500 HQ in MN)
| Industry | F500 HQs | Revenue |
|---|---|---|
| Healthcare | 2 | $407B |
|
||
| Retail | 2 | $150B |
|
||
| Consumer Goods | 2 | $32B |
|
||
| Industrial Machinery | 2 | $6B |
|
||
| Agriculture | 1 | $40B |
|
||
| Healthcare / Medical Devices | 1 | $32B |
|
||
Price history
+135.1% since first listed15 events — show timeline
- 2026-05-23 Price Changed $154,900 NORTHSTARMLS as Distributed by MLS Grid
- 2026-05-07 Listed $164,900 NORTHSTARMLS as Distributed by MLS Grid
- 2026-01-15 Pending — NORTHSTARMLS as Distributed by MLS Grid
- 2026-01-15 Listing Removed — NORTHSTARMLS as Distributed by MLS Grid
- 2025-10-13 Price Changed $165,000 NORTHSTARMLS as Distributed by MLS Grid
- 2025-09-25 Price Changed $175,000 NORTHSTARMLS as Distributed by MLS Grid
- 2025-08-26 Listed $185,000 NORTHSTARMLS as Distributed by MLS Grid
- 2022-03-18 Sold (Public Records) $117,000 Public Records
- 2022-03-18 Sold (MLS) $117,000 NORTHSTARMLS as Distributed by MLS Grid
- 2022-03-02 Pending — NORTHSTARMLS as Distributed by MLS Grid
- 2022-02-25 Listed $119,900 NORTHSTARMLS as Distributed by MLS Grid
- 2022-02-23 Coming Soon $119,900 NORTHSTARMLS as Distributed by MLS Grid
- 1997-05-30 Sold (MLS) $63,900 NORTHSTARMLS as Distributed by MLS Grid
- 1997-05-09 Listing Removed — NORTHSTARMLS as Distributed by MLS Grid
- 1997-03-10 Listed $65,900 NORTHSTARMLS as Distributed by MLS Grid
Property tax history
+1.4%/yrLatest (2025): $1,958 · +3.4% YoY. Source: county tax records.
Cash-flow waterfall
monthlySold comps — $/sqft
last 12 mo · ≤1 miLoading sold comps…