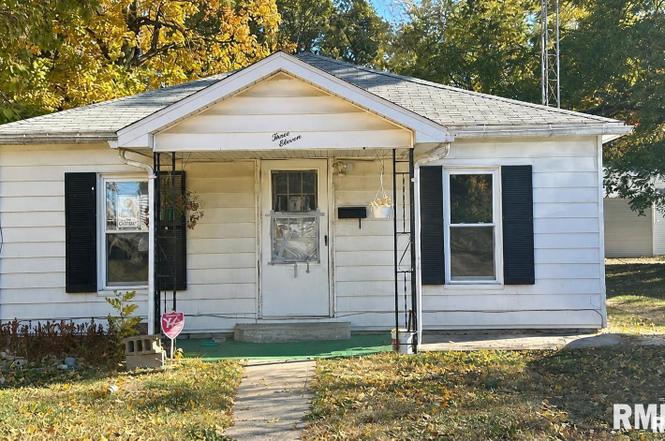
311 N Franklin St · Rushville, IL
Flood risk 1/10 · Minimal
- FEMA flood zone
- X (unshaded)
- Chance of flooding over 30 yrs
- 0.0%
- Est. flood insurance / yr
- $473 – $860
Fire risk 1/10 · Minimal
- Est. fire insurance / yr
- $804 – $1,492
Heat risk 3/10 · Minor
- Hot days now (above 106°F)
- 7 days/yr
- Hot days in 30 yrs
- 18 days/yr
Wind risk 2/10 · Minimal
- Chance of severe wind over 30 yrs
- 1.0%
Air-quality risk 2/10 · Minimal
- Unhealthy air days now
- 1 days/yr
- Unhealthy air days in 30 yrs
- 1 days/yr
Risk factors via First Street. Map © Google.
Why this score? — see what drove the B- grade
The composite is a weighted blend of 9 inputs, each scored 0–100. Each bar is that input's sub-score; the figure is the points it added to the 100-point composite (weight × sub-score).
- Cash flow +30.0/30.0
- 1% rule +10.0/10.0
- DSCR +10.0/10.0
- ARV discount +7.5/15.0
- Livability +3.2/5.0
- Rent growth +2.5/5.0
- Condition / age +2.5/5.0
- Schools +1.3/10.0
- Appreciation +0.0/10.0
$50,000
🖨 Deal sheet 📄 Offer letter ✓ Due diligence
Listing remarks
Charming 2-bedroom, 1-bath home with fresh updates including new flooring and paint throughout in 2024. Updated windows offer great natural light, and the home includes a stove and refrigerator to convey. The occupant is in the process of moving out, providing a perfect opportunity for either an owner-occupant or investor. This property has a strong rental history, previously earning $700 per month. A storage shed in the backyard adds extra convenience. The home next door is also available—buy both and create a fantastic package deal! Live in one and rent the other for additional income.
Key facts
- Updated paint
- Updated flooring
- 6,000 sq ft lot
Tags
Property features AI
Exterior
- Parking: No garage spaces
- Utilities: Public water; Public sewer
- Home design: Single-family residence; Single-story living with additional/upper/lower levels noted; Shingle roof
- Construction: Building area approximately 919 (living area/building area); Not new construction; Year built not provided
- Exterior features: Level lot; Lot dimensions approximately 60 x 100
Interior
- Kitchen: Kitchen on main level
- Bedrooms: 2 bedrooms (both on the main level); Bedroom 1: main level, vinyl flooring, egress window, approx. 9 x 18 ft; Bedroom 2: main level, vinyl flooring, egress window, approx. 9 x 13 ft
- Flooring: Vinyl flooring in main living areas and bedrooms
- Bathrooms: 1 full bathroom
- Heating & cooling: Central air; Gas water heating
- Interior features: No basement; No fireplaces
- Laundry & utility: Gas water heater
Neighborhood map
What this means for you Summary
Snapshot
- This is a 2-bed/1.0-bath other listed at $50k.
Deal economics
- At list price, monthly cash flow is $331 ($4k/yr) — positive.
- The deal already cash-flows at list — no discount required.
- Meets the 1% rule at list price ($874 rent vs $50k).
- Recommended offer: $44k (12.0% below list) — sets the bar for market timing.
Location & tenants
- Location reads 65/100 on livability (#627 in IL) — a middle-class / working-renter tenant base. Strengths: crime A+, cost of living A+, housing A+; Watch: schools D, amenities F, commute F.
- Schuyler-Industry CUSD 5 (town): math 13% / reading 15% proficiency, ranked #522 of 620 in IL (top 84%) — low school quality limits family demand, transient renter base, plan for 1-2y turnover.
- Market conditions: 16 active listings in the ZIP.
Forward outlook
- Local home prices are declining (-3.0%/yr); year-one equity from $346 of loan paydown is wiped out by about $2k of value loss. Plan a longer hold.
- Schuyler County population projected at -28% by 2050 — secular population decline; favor cash flow + early exit over multi-decade hold.
- At projected returns (-3.0% appreciation + 3.0% rent growth), your $14k cash investment doubles in ~5 years — after that, you're playing with house money.
Negotiation context
- It's been on market 202 days — a 12% lower offer ($44k) is reasonable based on typical stale-listing flexibility.
- Current owner paid $29k; list at $50k implies a 72% gain — meaningful room to come down on a strong offer.
Questions for the listing agent
- It's been on market 202 days. Have you received any prior offers? Is the seller open to a 12% concession, seller financing, or rate buy-down credit?
- Why hasn't it sold? Are there any deal-killer items the seller is aware of (foundation, flood, title, zoning, code violations)?
- Is there a deadline driving the sale (1031 exchange, divorce, estate, relocation)? That informs how much negotiation room exists.
- Schools are D-rated, which usually means shorter tenancies and higher turnover. Who's the typical renter profile here, and what's been the actual vacancy rate?
- What's the average days-on-market for RENTAL listings here right now (not sales)? A rising rental-DOM trend means longer vacancies and softer asking-rent achievability than the comps imply.
- What's the recent tenant-quality profile in this submarket — average credit score on applications, eviction rate, late-payment / NSF rate, and stable-employment percentage? A property-management company in the area should have these aggregated.
- How much new for-sale + rental construction is in the pipeline within 1–3 miles? Heavy new supply typically softens prices + rents 12–24 months out; constrained supply supports both.
Investment metrics
- 1% rule
- 1.75% ✓
- Cap rate
- 14.23%
- Cash-on-cash
- 28.36%
- DSCR
- 2.26
- GRM
- 4.8
CMA / ARV
No comps found within radius.
Projected returns pro-forma
-3.0% appreciation · 3.0% rent growth · sell at horizon
- IRR
- 22.6%
- Equity multiple
- 1.93×
- Total profit
- $12,992
- Equity at exit
- $7,455
- IRR
- 30.6%
- Equity multiple
- 3.75×
- Total profit
- $38,535
- Equity at exit
- $4,323
Cash invested: $14,000 (down + closing). Projections, not guarantees.
Landlord ↔ Tenant lean methodology
- Overall (STATE)
- 43 Moderately Tenant-Leaning
- State Illinois
- 43 Moderately Tenant-Leaning · D+7
- County
- — inherits STATE
- City
- — inherits STATE
ZIP-level market 62681
- Home prices YoY
- -17.0%
- Active inventory
- 16
- Price-to-rent
- 4.8×
Monthly cashflow live
- Estimated rent
- $874 medium interval (Pro) →
- Mortgage (P&I)
- −$262
- Tax from tax record
- −$76 /mo · $914/yr
- Insurance
- −$21
- HOA
- −$0
- Vacancy / Maint / Mgmt
- −$183
- Net cashflow
- $331
Break-even live
UW: 25.0% down · 7.5% · 30yr · 1.5% tax · 5.0% vac · 8.0% maint · 8.0% mgmt
Financing live
Cash to close
- Down payment
- $12,500
- Closing costs
- $1,500
- Reserves months
- —
- Total cash needed
- —
Loan-product check · same deal, 3 products live
Conventional
25% down · 7.5% · 30yr
- Down + closing
- —
- Monthly P&I
- —
- Monthly cashflow
- —
- DSCR
- —
- Eligible?
- —
Personal DTI + credit; lowest rate.
DSCR
20% down · 8.5% · 30yr
- Down + closing
- —
- Monthly P&I
- —
- Monthly cashflow
- —
- DSCR
- —
- Eligible?
- —
No personal income docs; deal must DSCR.
Hard money
10% down · 12.0% · 12mo
- Down + closing
- —
- Monthly P&I
- —
- Monthly cashflow
- —
- DSCR
- —
- Eligible?
- —
Short-term bridge; refi at stabilization.
Listing history 7 events
-
2026-04-23historical Under Contract
-
2026-04-21status Active
-
2026-04-21price $50,000
-
2026-04-15historical Under Contract
-
2026-03-03price $59,800
-
2025-12-03price $67,500
-
2024-03-12soldstatus $29,000
ⓘ Source: listings_history table (triggers on properties + properties_extension) + one-shot
backfill from property_details.listing_events for pre-trigger history.
Tax reassessment forecast IL · Partial reset (capped growth)
- Current annual tax
- $914 · $76/mo
- Projected year-2 tax
- $1,025 · $85/mo
- Expected delta
- +$110/yr (+$9/mo · 12.1%)
ⓘ Screening estimate from a state-policy table — verify with the county assessor before closing.
Climate risk First Street
- Flood 1/10 Low FEMA zone X (unshaded) · 0% chance over 30 yrs
- Wildfire 1/10 Low
- Heat 3/10 Moderate 7 d/yr ≥106°F today · 18 d/yr by 30 yrs out
- Wind 2/10 Low 100% chance of damaging wind over 30 yrs
- Air quality 2/10 Low 1 unhealthy d/yr today · 1 by 30 yrs out
Nearby sold comps map
Loading sold comps map…
Walkable amenities ~0.75 mi
Loading nearby amenities…
Taxation est. · year 1
- Rental income
- $10,482
- − Mortgage interest
- −$2,801
- − Property taxes
- −$914
- − Insurance
- −$250
- − Repairs & maintenance
- −$839
- − Management
- −$839
- − Depreciation
- −$1,455
- Taxable income
- $3,385
- Est. tax owed @ 24.0%
- −$813
- After-tax cash flow
- $3,158/yr
For passive investors: Depreciation is non-cash, so a rental often shows a tax loss while cash-flowing — sheltering income. Rental losses are passive: they offset passive income freely, and up to $25,000/yr can offset ordinary (W-2) income if you actively participate and your MAGI is under $100k (phasing out to $0 by $150k); unused losses carry forward. On sale, claimed depreciation is recaptured at up to 25%, and gains may owe capital-gains tax (a 1031 exchange can defer both). Figures are a year-1 estimate at your 24.0% rate — not tax advice; consult a CPA.
Schools (NCES district)
- District
- Schuyler-Industry CUSD 5
- NCES district ID
- 1700332
- Math proficiency
- 13% ▼ -8.00%
- Reading proficiency
- 15% ▼ -10.00%
- Median HH income
- $46,367
- Composite
- 12.59/100
- National rank
- #9616
- State rank
- #522 of 620 in IL
Livability — Rushville
- Score
- 65/100
- State rank
- #627
- US rank
- #12830
Category grades
Schools grade is shown separately in the Schools card above.
Census & demographics
- Census place
- Rushville, IL
- Population (ZIP)
- 5,649
Population outlook (Schuyler County) Hauer SSP2
- Today (2025)
- 6,298 people
- By 2030
- 5,913 · -6.1%
- By 2040
- 5,186 · -17.7%
- By 2050
- 4,527 · -28.1%
- By 2075
- 3,365 · -46.6%
- By 2100
- 2,553 · -59.5%
Race, ethnicity, and origin ACS 2023
- Neighborhood character
- Predominantly White (90%)
- Race & ethnicity
- White 90% Black 5% Hispanic / Latino 3% Two or more races 2%
- Common ancestry
- Lithuanian 2% Slovak 2% Iranian 2%
- Foreign-born
- 2% · Canada
- Languages at home
- 96% English-only · Spanish 2% French/Haitian/Cajun 1%
Political lean MEDSL · Schuyler
- 2024 margin
- Solid R (+46.8) · D 25.6% · R 72.4% · Other 2.0%
- 2008→2024 swing
- -48.6pp toward R · 2008: 1.8pp · 2024: -46.8pp
- All cycles
- 2024: R+46.8 2020: R+43.5 2016: R+38.2 2012: R+8.7 2008: D+1.8
Not yet ingested
- Civics
- —
Market trends
- HPI YoY
- ▼ -30.32%
- Current HPI
- 148.2595
- Rent YoY
- —
- Metro
- —
- State GDP YoY
- ▲ 1.59%
- F500 in state
- 60
Industry mix (Fortune 500 HQ in IL)
| Industry | F500 HQs | Revenue |
|---|---|---|
| Insurance | 4 | $201B |
|
||
| Consumer Goods | 4 | $87B |
|
||
| Industrial Machinery | 3 | $64B |
|
||
| Healthcare | 2 | $55B |
|
||
| Retail / Pharmacy | 1 | $148B |
|
||
| Agriculture / Food | 1 | $86B |
|
||
Price history
+72.4% since first listed7 events — show timeline
- 2026-04-23 Contingent — RMLSA as Distributed by MLS Grid
- 2026-04-21 Relisted — RMLSA as Distributed by MLS Grid
- 2026-04-21 Price Changed $50,000 RMLSA as Distributed by MLS Grid
- 2026-04-15 Contingent — RMLSA as Distributed by MLS Grid
- 2026-03-03 Price Changed $59,800 RMLSA as Distributed by MLS Grid
- 2025-12-03 Price Changed $67,500 RMLSA as Distributed by MLS Grid
- 2024-03-12 Sold (Public Records) $29,000 Public Records
Property tax history
-1.4%/yrLatest (2024): $914 · +1.5% YoY. Source: county tax records.
Cash-flow waterfall
monthlySold comps — $/sqft
last 12 mo · ≤1 miLoading sold comps…