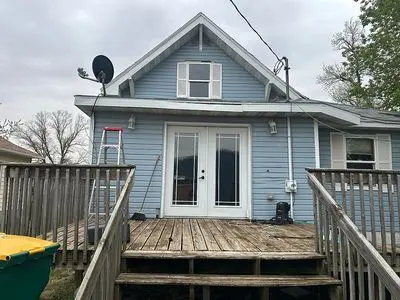
440 Aurora Ave · Lowry, MN
Flood risk 1/10 · Minimal
- FEMA flood zone
- —
- Chance of flooding over 30 yrs
- 0.0%
- Est. flood insurance / yr
- —
Fire risk 1/10 · Minimal
- Est. fire insurance / yr
- $888 – $1,650
Heat risk 2/10 · Minimal
- Hot days now (above 98°F)
- 7 days/yr
- Hot days in 30 yrs
- 13 days/yr
Wind risk 2/10 · Minimal
- Chance of severe wind over 30 yrs
- —
Air-quality risk 2/10 · Minimal
- Unhealthy air days now
- 2 days/yr
- Unhealthy air days in 30 yrs
- 2 days/yr
Risk factors via First Street. Map © Google.
Why this score? — see what drove the D grade
The composite is a weighted blend of 9 inputs, each scored 0–100. Each bar is that input's sub-score; the figure is the points it added to the 100-point composite (weight × sub-score).
- Cash flow +10.8/30.0
- ARV discount +7.5/15.0
- Appreciation +6.7/10.0
- Schools +4.5/10.0
- Livability +3.4/5.0
- DSCR +3.1/10.0
- 1% rule +2.8/10.0
- Rent growth +2.5/5.0
- Condition / age +2.5/5.0
$129,995
🖨 Deal sheet (PDF) 📄 Offer letter ✓ Due diligence
Listing remarks MLS
Welcome Home! You'll love this open floor plan. Potential for more square footage in the basement. Take a look, this one won't last long!
Key facts
- Charming home
- Deck entrance
- Spacious layout
Tags
Neighborhood map
What this means for you Summary
Snapshot
- This is a 3-bed/1.0-bath single-family listed at $130k.
Deal economics
- At list price, monthly cash flow is $-59 ($-703/yr) — negative.
- To cash-flow at today's rent, offer at most $120k (8.0% below list).
- To meet the 1% rule (rent ≥ 1% of price), the offer needs to be $101k (22.3% below list).
- Recommended offer: $101k (22.3% below list) — sets the bar for 1% rule.
Location & tenants
- Location reads 68/100 on livability (#411 in MN) — a middle-class / working-renter tenant base. Strengths: cost of living A+, housing A+, employment A; Watch: crime C-, health & safety D+, amenities F.
- Minnewaska School District (rural): math 55% / reading 51% proficiency, ranked #87 of 301 in MN (top 29%) — acceptable for families but not a draw, mixed tenant base, ~2y average lease.
- Zoned schools: Minnewaska Area Elementary (math 72% / reading 57%, grade B, #130 of 857 statewide, top 18%, 351 students, 38% FRL); Minnewaska Area Intermediate School (math 64% / reading 62%, grade B+, #17 of 258 statewide, top 6%, 292 students, 32% FRL); Minnewaska Secondary (math 37% / reading 42%, grade F, #246 of 471 statewide, top 59%, 399 students, 30% FRL).
- Market conditions: 5 active listings in the ZIP; 41 units permitted in Pope County in 2024 (0 in 5+ unit buildings).
Forward outlook
- In year one you build about $5k of equity ($899 loan paydown + $4k appreciation (3.4% local appreciation)).
- Pope County population projected to shrink 10% by 2050 — rents likely to lag national; underwrite the cash flow, not the appreciation.
- At projected returns (3.4% appreciation + 3.0% rent growth), your $36k cash investment doubles in ~7 years — after that, you're playing with house money.
- By year 7, paydown + projected appreciation supports a ~$34k cash-out refi (75% LTV) — recoverable capital for the next deal without selling this one.
Negotiation context
- It's been on market 36 days — a 3% lower offer ($126k) is reasonable based on typical stale-listing flexibility.
- 5 sale attempts since 19y ago with the ask held roughly flat each time — persistent listings suggest the price (not the market) is what's stuck; bring a comps-based counter.
- Current owner paid $98k; 33% above their basis — modest negotiation headroom, anchor on the comps not their cost.
Risks & watch-outs
- Watch-outs: built in 1915 — expect roof / HVAC / electrical / plumbing capex.
Questions for the listing agent
- What do current leases actually rent for vs. the listed asking? Can we see a recent rent roll and the last 12 months of T-12 income?
- It's been on market 36 days. Have you received any prior offers? Is the seller open to a 22% concession, seller financing, or rate buy-down credit?
- Built in 1915 — when were the roof, HVAC, electrical panel, plumbing, and water heater last replaced?
- Is there a deadline driving the sale (1031 exchange, divorce, estate, relocation)? That informs how much negotiation room exists.
- Schools are D-rated, which usually means shorter tenancies and higher turnover. Who's the typical renter profile here, and what's been the actual vacancy rate?
- The area grade is low — what's the realistic commute time and amenity access for the typical tenant pool here? Any planned neighborhood developments (good or bad) we should know about?
- What's the average days-on-market for RENTAL listings here right now (not sales)? A rising rental-DOM trend means longer vacancies and softer asking-rent achievability than the comps imply.
- What's the recent tenant-quality profile in this submarket — average credit score on applications, eviction rate, late-payment / NSF rate, and stable-employment percentage? A property-management company in the area should have these aggregated.
- How much new for-sale + rental construction is in the pipeline within 1–3 miles? Heavy new supply typically softens prices + rents 12–24 months out; constrained supply supports both.
Investment metrics
- 1% rule
- 0.78% ✗
- Cap rate
- 5.75%
- Cash-on-cash
- -1.93%
- DSCR
- 0.91
- GRM
- 10.7
CMA / ARV
No comps found within radius.
Projected returns pro-forma
3.41% appreciation · 3.0% rent growth · sell at horizon
- IRR
- 6.9%
- Equity multiple
- 1.40×
- Total profit
- $14,730
- Equity at exit
- $61,442
- IRR
- 9.5%
- Equity multiple
- 2.49×
- Total profit
- $54,247
- Equity at exit
- $97,083
Cash invested: $36,399 (down + closing). Projections, not guarantees.
Landlord ↔ Tenant lean methodology
- Overall (STATE)
- 46 Balanced
- State Minnesota
- 46 Balanced · D+2
- County
- — inherits STATE
- City
- — inherits STATE
ZIP-level market 56349
- Home prices YoY
- 2.1%
- Active inventory
- 5
- Price-to-rent
- 10.7×
Monthly cashflow live
- Estimated rent
- $1,010 medium interval (Pro) →
- Mortgage (P&I)
- −$682
- Tax from tax record
- −$121 /mo · $1,448/yr
- Insurance
- −$54
- HOA
- −$0
- Vacancy / Maint / Mgmt
- −$212
- Net cashflow
- $-59
Break-even live
Sensitivity live
| Price | -10% $15 | -5% $-22 | +0% $-59 | +5% $-95 | +10% $-132 |
|---|---|---|---|---|---|
| Rent | -10% $-138 | -5% $-98 | +0% $-59 | +5% $-19 | +10% $21 |
| Rate | -1.0pp $7 | -0.5pp $-26 | base $-59 | +0.5pp $-92 | +1.0pp $-127 |
UW: 25.0% down · 7.5% · 30yr · 1.5% tax · 5.0% vac · 8.0% maint · 8.0% mgmt
Financing live
Cash to close
- Down payment
- $32,499
- Closing costs
- $3,900
- Reserves months
- —
- Total cash needed
- —
Loan-product check · same deal, 3 products live
Conventional
25% down · 7.5% · 30yr
- Down + closing
- —
- Monthly P&I
- —
- Monthly cashflow
- —
- DSCR
- —
- Eligible?
- —
Personal DTI + credit; lowest rate.
DSCR
20% down · 8.5% · 30yr
- Down + closing
- —
- Monthly P&I
- —
- Monthly cashflow
- —
- DSCR
- —
- Eligible?
- —
No personal income docs; deal must DSCR.
Hard money
10% down · 12.0% · 12mo
- Down + closing
- —
- Monthly P&I
- —
- Monthly cashflow
- —
- DSCR
- —
- Eligible?
- —
Short-term bridge; refi at stabilization.
Listing history 34 events
-
2026-06-22days on market $129,995 Active 36 DOM
-
2026-06-21days on market $129,995 Active 35 DOM
-
2026-06-19days on market $129,995 Active 33 DOM
-
2026-06-18days on market $129,995 Active 32 DOM
-
2026-06-17days on market $129,995 Active 31 DOM
-
2026-06-17price $129,995 Active 30 DOM
-
2026-06-16days on market $135,995 Active 30 DOM
-
2026-06-15days on market $135,995 Active 29 DOM
-
2026-06-14days on market $135,995 Active 27 DOM
-
2026-06-12days on market $135,995 Active 26 DOM
-
2026-06-09days on market $135,995 Active 23 DOM
-
2026-06-08days on market $135,995 Active 22 DOM
-
2026-06-07days on market $135,995 Active 21 DOM
-
2026-06-07days on market $135,995 Active 20 DOM
-
2026-06-03days on market $135,995 Active 17 DOM
-
2026-06-02days on market $135,995 Active 16 DOM
-
2026-06-01days on market $135,995 Active 15 DOM
-
2026-05-31days on market $135,995 Active 14 DOM
-
2026-05-30days on market $135,995 Active 13 DOM
-
2026-05-18$135,995 Active
-
2020-12-16soldstatus $98,000 Sold 137-char remark
Show marketing remark (137 chars)
Welcome Home! You'll love this open floor plan. Potential for more square footage in the basement. Take a look, this one won't last long!
-
2020-12-16soldstatus $98,000
Show marketing remark (137 chars)
Welcome Home! You'll love this open floor plan. Potential for more square footage in the basement. Take a look, this one won't last long!
-
2020-10-21status Pending 137-char remark
Show marketing remark (137 chars)
Welcome Home! You'll love this open floor plan. Potential for more square footage in the basement. Take a look, this one won't last long!
-
2020-10-16historical Contingent - Inspection 137-char remark
Show marketing remark (137 chars)
Welcome Home! You'll love this open floor plan. Potential for more square footage in the basement. Take a look, this one won't last long!
-
2020-10-10price $95,900 137-char remark
Show marketing remark (137 chars)
Welcome Home! You'll love this open floor plan. Potential for more square footage in the basement. Take a look, this one won't last long!
-
2020-10-06status Active 137-char remark
Show marketing remark (137 chars)
Welcome Home! You'll love this open floor plan. Potential for more square footage in the basement. Take a look, this one won't last long!
-
2020-10-01historical Contingent - Inspection 137-char remark
Show marketing remark (137 chars)
Welcome Home! You'll love this open floor plan. Potential for more square footage in the basement. Take a look, this one won't last long!
-
2020-09-29$94,900 Active 137-char remark
Show marketing remark (137 chars)
Welcome Home! You'll love this open floor plan. Potential for more square footage in the basement. Take a look, this one won't last long!
-
2017-06-27soldstatus $89,900
-
2017-06-26soldstatus $89,900 384-char remark
Show marketing remark (384 chars)
You'll love this Beautifully remodeled home with an open floor plan, which is great for entertaining! This home includes newly replaced windows, roof, shutters, furnace, electrical throughout, plus so much more. The partially finished basement leaves potential to add square footage and equity. You will also find plenty of storage in the 24 x 26 garage. This is a must see home!!
-
2017-04-22$89,900 384-char remark
Show marketing remark (384 chars)
You'll love this Beautifully remodeled home with an open floor plan, which is great for entertaining! This home includes newly replaced windows, roof, shutters, furnace, electrical throughout, plus so much more. The partially finished basement leaves potential to add square footage and equity. You will also find plenty of storage in the 24 x 26 garage. This is a must see home!!
-
2007-09-21soldstatus $17,000
-
2007-08-30$24,500
-
2005-03-07soldstatus $58,000
ⓘ Source: listings_history table (triggers on properties + properties_extension) + one-shot
backfill from property_details.listing_events for pre-trigger history.
Tax reassessment forecast MN · Partial reset (capped growth)
- Current annual tax
- $1,448 · $121/mo
- Projected year-2 tax
- $1,452 · $121/mo
- Expected delta
- +$4/yr ($0/mo · 0.3%)
ⓘ Screening estimate from a state-policy table — verify with the county assessor before closing.
Climate risk First Street
- Flood 1/10 Low 0% chance over 30 yrs
- Wildfire 1/10 Low
- Heat 2/10 Low 7 d/yr ≥98°F today · 13 d/yr by 30 yrs out
- Wind 2/10 Low
- Air quality 2/10 Low 2 unhealthy d/yr today · 2 by 30 yrs out
Nearby sold comps map
Loading sold comps map…
Walkable amenities ~0.75 mi
Loading nearby amenities…
Taxation est. · year 1
- Rental income
- $12,121
- − Mortgage interest
- −$7,282
- − Property taxes
- −$1,448
- − Insurance
- −$650
- − Repairs & maintenance
- −$970
- − Management
- −$970
- − Depreciation
- −$3,782
- Taxable loss
- −$2,980
- Est. tax savings @ 24.0%
- +$715
- After-tax cash flow
- $12/yr
For passive investors: Depreciation is non-cash, so a rental often shows a tax loss while cash-flowing — sheltering income. Rental losses are passive: they offset passive income freely, and up to $25,000/yr can offset ordinary (W-2) income if you actively participate and your MAGI is under $100k (phasing out to $0 by $150k); unused losses carry forward. On sale, claimed depreciation is recaptured at up to 25%, and gains may owe capital-gains tax (a 1031 exchange can defer both). Figures are a year-1 estimate at your 24.0% rate — not tax advice; consult a CPA.
Schools (NCES district)
- District
- Minnewaska School District
- NCES district ID
- 2700019
- Math proficiency
- 55% ▼ -6.00%
- Reading proficiency
- 51% ▼ -10.00%
- Median HH income
- $51,589
- Composite
- 45.45/100
- National rank
- #2617
- State rank
- #87 of 301 in MN
Livability — Lowry
- Score
- 68/100
- State rank
- #411
- US rank
- #9622
Category grades
Schools grade is shown separately in the Schools card above.
Census & demographics
- Census place
- Lowry, MN
- Population (ZIP)
- 804
Population outlook (Pope County) Hauer SSP2
- Today (2025)
- 10,898 people
- By 2030
- 10,765 · -1.2%
- By 2040
- 10,369 · -4.9%
- By 2050
- 9,818 · -9.9%
- By 2075
- 8,532 · -21.7%
- By 2100
- 6,700 · -38.5%
Race, ethnicity, and origin ACS 2023
- Neighborhood character
- Predominantly White (97%)
- Race & ethnicity
- White 97% Two or more races 3%
- Common ancestry
- Portuguese 26% Romanian 2% Italian 2%
- Foreign-born
- 0%
Political lean MEDSL · Pope
- 2024 margin
- Solid R (+31.7) · D 33.4% · R 65.0% · Other 1.6%
- 2008→2024 swing
- -35.5pp toward R · 2008: 3.8pp · 2024: -31.7pp
- All cycles
- 2024: R+31.7 2020: R+27.6 2016: R+26.8 2012: R+2.6 2008: D+3.8
Not yet ingested
- Civics
- —
Market trends
- HPI YoY
- ▲ 3.41%
- Current HPI
- 162.234
- Rent YoY
- —
- Metro
- —
- State GDP YoY
- ▲ 2.41%
- F500 in state
- 34
Industry mix (Fortune 500 HQ in MN)
| Industry | F500 HQs | Revenue |
|---|---|---|
| Healthcare | 2 | $407B |
|
||
| Retail | 2 | $150B |
|
||
| Consumer Goods | 2 | $32B |
|
||
| Industrial Machinery | 2 | $6B |
|
||
| Agriculture | 1 | $40B |
|
||
| Healthcare / Medical Devices | 1 | $32B |
|
||
Price history
+134.5% since first listed15 events — show timeline
- 2026-05-18 Listed $135,995 FSBO.com
- 2020-12-16 Sold (Public Records) $98,000 Public Records
- 2020-12-16 Sold (MLS) $98,000 NORTHSTARMLS as Distributed by MLS Grid
- 2020-10-21 Pending — NORTHSTARMLS as Distributed by MLS Grid
- 2020-10-16 Contingent — NORTHSTARMLS as Distributed by MLS Grid
- 2020-10-10 Price Changed $95,900 NORTHSTARMLS as Distributed by MLS Grid
- 2020-10-06 Relisted — NORTHSTARMLS as Distributed by MLS Grid
- 2020-10-01 Contingent — NORTHSTARMLS as Distributed by MLS Grid
- 2020-09-29 Listed $94,900 NORTHSTARMLS as Distributed by MLS Grid
- 2017-06-27 Sold (Public Records) $89,900 Public Records
- 2017-06-26 Sold (MLS) $89,900 NORTHSTARMLS as Distributed by MLS Grid
- 2017-04-22 Listed $89,900 NORTHSTARMLS as Distributed by MLS Grid
- 2007-09-21 Sold (MLS) $17,000 NORTHSTARMLS as Distributed by MLS Grid
- 2007-08-30 Listed $24,500 NORTHSTARMLS as Distributed by MLS Grid
- 2005-03-07 Sold (Public Records) $58,000 Public Records
Property tax history
+7.4%/yrLatest (2026): $1,448 · +5.8% YoY. Source: county tax records.
Cash-flow waterfall
monthlySold comps — $/sqft
last 12 mo · ≤1 miLoading sold comps…