2991 Johnson Chapel Rd · Baxter, TN
Flood risk 1/10 · Minimal
- FEMA flood zone
- X (unshaded)
- Chance of flooding over 30 yrs
- 0.0%
- Est. flood insurance / yr
- $507 – $1,088
Fire risk 2/10 · Minimal
- Est. fire insurance / yr
- $949 – $1,763
Heat risk 5/10 · Moderate
- Hot days now (above 103°F)
- 7 days/yr
- Hot days in 30 yrs
- 21 days/yr
Wind risk 3/10 · Minor
- Chance of severe wind over 30 yrs
- 7.0%
Air-quality risk 2/10 · Minimal
- Unhealthy air days now
- 1 days/yr
- Unhealthy air days in 30 yrs
- 1 days/yr
Risk factors via First Street. Map © Google.
Why this score? — see what drove the D grade
The composite is a weighted blend of 9 inputs, each scored 0–100. Each bar is that input's sub-score; the figure is the points it added to the 100-point composite (weight × sub-score).
- Cash flow +15.0/30.0
- ARV discount +7.5/15.0
- Appreciation +4.8/10.0
- DSCR +4.6/10.0
- Livability +3.3/5.0
- 1% rule +2.8/10.0
- Rent growth +2.5/5.0
- Condition / age +2.5/5.0
- Schools +1.7/10.0
$129,900
🖨 Deal sheet 📄 Offer letter ✓ Due diligence
Listing remarks
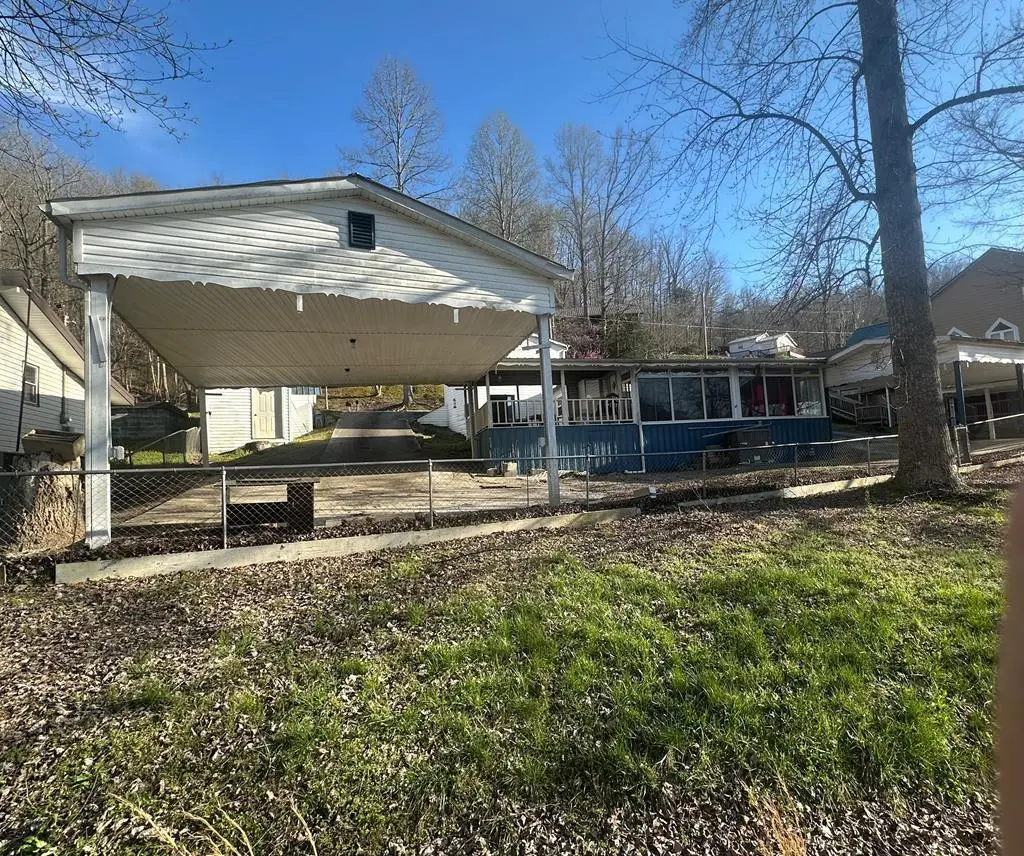
Fantastic opportunity! Come make this lake property your next investment. This single wide mobile home has had an addition built on with all windows in order to see Center Hill Lake. There is so much potential here and with some TLC this could be a dream come true. Property is being sold AS-IS.
Key facts
- Lake property
- Addition built on
- 0.33 acre lot
Tags
Property features AI
Exterior
- Parking: 4 total parking spaces; 4 covered parking spaces; Carport and detached carport
- Utilities: Natural gas available; Septic tank
- Home design: Manufactured home; Residential property
- Construction: Metal roof
- Exterior features: Lakefront property with views; Covered porch
Interior
- Bathrooms: 1 full bathroom
- Interior features: Electric water heater; Central heating and central air
Neighborhood map
What this means for you Summary
Snapshot
- This is a 1-bed/1.0-bath manufactured listed at $130k.
Deal economics
- At list price, monthly cash flow is $40 ($474/yr) — positive.
- The deal already cash-flows at list — no discount required.
- To meet the 1% rule (rent ≥ 1% of price), the offer needs to be $101k (22.3% below list).
- Recommended offer: $101k (22.3% below list) — sets the bar for 1% rule.
- Cap rate 6.7% vs local median 1.8% in Baxter — top-decile yield for the area; either an underpriced asset or a hidden risk that comps aren't pricing in. Stress-test before assuming the spread holds.
Location & tenants
- Location reads 66/100 on livability (#131 in TN) — a middle-class / working-renter tenant base. Strengths: cost of living A+, housing A+, crime B+; Watch: health & safety C-, employment D, schools F.
- Dekalb County (rural): math 17% / reading 23% proficiency, ranked #115 of 139 in TN (top 83%) — low school quality limits family demand, transient renter base, plan for 1-2y turnover.
- Market conditions: 354 active listings in the ZIP; 143 units permitted in DeKalb County in 2024 (0 in 5+ unit buildings).
Forward outlook
- In year one you build about $278 of equity ($898 loan paydown + $-620 appreciation (-0.5% local appreciation)).
- DeKalb County population projected at +7% by 2050 — modest demand growth; plan on rents tracking national, not racing it.
Negotiation context
- It's been on market 43 days — a 3% lower offer ($126k) is reasonable based on typical stale-listing flexibility.
Risks & watch-outs
- Climate carrying-cost: extreme-heat days projected 7→21/yr by 2055 (HVAC capex compounding) — expect insurance premiums to compound above CPI over the hold.
Questions for the listing agent
- It's been on market 43 days. Have you received any prior offers? Is the seller open to a 22% concession, seller financing, or rate buy-down credit?
- Built in 1975 — when were the roof, HVAC, electrical panel, plumbing, and water heater last replaced?
- Is there a deadline driving the sale (1031 exchange, divorce, estate, relocation)? That informs how much negotiation room exists.
- Schools are F-rated, which usually means shorter tenancies and higher turnover. Who's the typical renter profile here, and what's been the actual vacancy rate?
- The area grade is low — what's the realistic commute time and amenity access for the typical tenant pool here? Any planned neighborhood developments (good or bad) we should know about?
- What's the average days-on-market for RENTAL listings here right now (not sales)? A rising rental-DOM trend means longer vacancies and softer asking-rent achievability than the comps imply.
- What's the recent tenant-quality profile in this submarket — average credit score on applications, eviction rate, late-payment / NSF rate, and stable-employment percentage? A property-management company in the area should have these aggregated.
- How much new for-sale + rental construction is in the pipeline within 1–3 miles? Heavy new supply typically softens prices + rents 12–24 months out; constrained supply supports both.
Investment metrics
- 1% rule
- 0.78% ✗
- Cap rate
- 6.66%
- Cash-on-cash
- 1.30%
- DSCR
- 1.06
- GRM
- 10.7
CMA / ARV
No comps found within radius.
Projected returns pro-forma
-0.48% appreciation · 3.0% rent growth · sell at horizon
- IRR
- -2.6%
- Equity multiple
- 0.88×
- Total profit
- $-4,241
- Equity at exit
- $34,647
- IRR
- 3.6%
- Equity multiple
- 1.36×
- Total profit
- $13,109
- Equity at exit
- $39,269
Cash invested: $36,372 (down + closing). Projections, not guarantees.
Landlord ↔ Tenant lean methodology
- Overall (STATE)
- 87 Strongly Landlord-Friendly
- State Tennessee
- 87 Strongly Landlord-Friendly · R+13
- County
- — inherits STATE
- City
- — inherits STATE
ZIP-level market 38583
- Home prices YoY
- -0.1%
- Active inventory
- 354
- Price-to-rent
- 10.7×
Monthly cashflow live
- Estimated rent
- $1,009 medium interval (Pro) →
- Mortgage (P&I)
- −$681
- Tax from tax record
- −$22 /mo · $265/yr
- Insurance
- −$54
- HOA
- −$0
- Vacancy / Maint / Mgmt
- −$212
- Net cashflow
- $40
Break-even live
UW: 25.0% down · 7.5% · 30yr · 1.5% tax · 5.0% vac · 8.0% maint · 8.0% mgmt
Financing live
Cash to close
- Down payment
- $32,475
- Closing costs
- $3,897
- Reserves months
- —
- Total cash needed
- —
Loan-product check · same deal, 3 products live
Conventional
25% down · 7.5% · 30yr
- Down + closing
- —
- Monthly P&I
- —
- Monthly cashflow
- —
- DSCR
- —
- Eligible?
- —
Personal DTI + credit; lowest rate.
DSCR
20% down · 8.5% · 30yr
- Down + closing
- —
- Monthly P&I
- —
- Monthly cashflow
- —
- DSCR
- —
- Eligible?
- —
No personal income docs; deal must DSCR.
Hard money
10% down · 12.0% · 12mo
- Down + closing
- —
- Monthly P&I
- —
- Monthly cashflow
- —
- DSCR
- —
- Eligible?
- —
Short-term bridge; refi at stabilization.
Listing history 18 events
-
2026-06-19days on market $129,900 Active 43 DOM
-
2026-06-18days on market $129,900 Active 42 DOM
-
2026-06-17days on market $129,900 Active 41 DOM
-
2026-06-16days on market $129,900 Active 40 DOM
-
2026-06-15days on market $129,900 Active 39 DOM
-
2026-06-14days on market $129,900 Active 37 DOM
-
2026-06-12days on market $129,900 Active 36 DOM
-
2026-06-09days on market $129,900 Active 33 DOM
-
2026-06-08days on market $129,900 Active 32 DOM
-
2026-06-07days on market $129,900 Active 31 DOM
-
2026-06-05days on market $129,900 Active 28 DOM
-
2026-06-03days on market $129,900 Active 27 DOM
-
2026-06-02days on market $129,900 Active 26 DOM
-
2026-06-01days on market $129,900 Active 25 DOM
-
2026-05-31days on market $129,900 Active 24 DOM
-
2026-05-30days on market $129,900 Active 23 DOM
-
2026-05-08$129,900 Active 295-char remark
-
2006-07-26soldstatus $150,000
ⓘ Source: listings_history table (triggers on properties + properties_extension) + one-shot
backfill from property_details.listing_events for pre-trigger history.
Tax reassessment forecast TN · Resets to sale price
- Current annual tax
- $265 · $22/mo
- Projected year-2 tax
- $922 · $77/mo
- Expected delta
- +$657/yr (+$55/mo · 248.0%)
ⓘ Screening estimate from a state-policy table — verify with the county assessor before closing.
Climate risk First Street
- Flood 1/10 Low FEMA zone X (unshaded) · 0% chance over 30 yrs
- Wildfire 2/10 Low
- Heat 5/10 Major 7 d/yr ≥103°F today · 21 d/yr by 30 yrs out
- Wind 3/10 Moderate 7% chance of damaging wind over 30 yrs
- Air quality 2/10 Low 1 unhealthy d/yr today · 1 by 30 yrs out
Nearby sold comps map
Loading sold comps map…
Walkable amenities ~0.75 mi
Loading nearby amenities…
Taxation est. · year 1
- Rental income
- $12,105
- − Mortgage interest
- −$7,276
- − Property taxes
- −$265
- − Insurance
- −$650
- − Repairs & maintenance
- −$968
- − Management
- −$968
- − Depreciation
- −$3,779
- Taxable loss
- −$1,801
- Est. tax savings @ 24.0%
- +$432
- After-tax cash flow
- $907/yr
For passive investors: Depreciation is non-cash, so a rental often shows a tax loss while cash-flowing — sheltering income. Rental losses are passive: they offset passive income freely, and up to $25,000/yr can offset ordinary (W-2) income if you actively participate and your MAGI is under $100k (phasing out to $0 by $150k); unused losses carry forward. On sale, claimed depreciation is recaptured at up to 25%, and gains may owe capital-gains tax (a 1031 exchange can defer both). Figures are a year-1 estimate at your 24.0% rate — not tax advice; consult a CPA.
Schools (NCES district)
- District
- Dekalb County
- NCES district ID
- 4700990
- Math proficiency
- 17% ▼ -16.00%
- Reading proficiency
- 23% ▼ -7.00%
- Median HH income
- $37,832
- Composite
- 16.73/100
- National rank
- #9165
- State rank
- #115 of 139 in TN
Livability — Baxter
- Score
- 66/100
- State rank
- #131
- US rank
- #12008
Category grades
Schools grade is shown separately in the Schools card above.
Census & demographics
- Population (ZIP)
- 25,739
Population outlook (DeKalb County) Hauer SSP2
- Today (2025)
- 20,289 people
- By 2030
- 20,738 · +2.2%
- By 2040
- 21,411 · +5.5%
- By 2050
- 21,751 · +7.2%
- By 2075
- 22,170 · +9.3%
- By 2100
- 21,381 · +5.4%
Race, ethnicity, and origin ACS 2023
- Neighborhood character
- Predominantly White (93%)
- Race & ethnicity
- White 93% Two or more races 4% Hispanic / Latino 3% Black 1%
- Common ancestry
- Slovak 3% Lithuanian 2% Serbian 2%
- Foreign-born
- 1% · Canada
- Languages at home
- 98% English-only · Spanish 2%
Political lean MEDSL · DeKalb
- 2024 margin
- Solid R (+62.7) · D 18.2% · R 80.9%
- 2008→2024 swing
- -45.0pp toward R · 2008: -17.7pp · 2024: -62.7pp
- All cycles
- 2024: R+62.7 2020: R+57.8 2016: R+51.9 2012: R+30.7 2008: R+17.7
Not yet ingested
- Civics
- —
Market trends
- HPI YoY
- ▼ -0.48%
- Current HPI
- 357.041
- Rent YoY
- —
- Metro
- —
- State GDP YoY
- ▲ 2.78%
- F500 in state
- 22
Industry mix (Fortune 500 HQ in TN)
| Industry | F500 HQs | Revenue |
|---|---|---|
| Healthcare | 3 | $91B |
|
||
| Retail | 3 | $72B |
|
||
| Transportation / Logistics | 1 | $88B |
|
||
| Paper / Packaging | 1 | $19B |
|
||
| Insurance | 1 | $13B |
|
||
| Energy | 1 | $12B |
|
||
Price history
-13.4% since first listed2 events — show timeline
- 2026-05-08 Listed $129,900 UCMLS
- 2006-07-26 Sold (Public Records) $150,000 Public Records
Property tax history
+6.8%/yrLatest (2025): $265 · +0.0% YoY. Source: county tax records.
Cash-flow waterfall
monthlySold comps — $/sqft
last 12 mo · ≤1 miLoading sold comps…