 Duplex
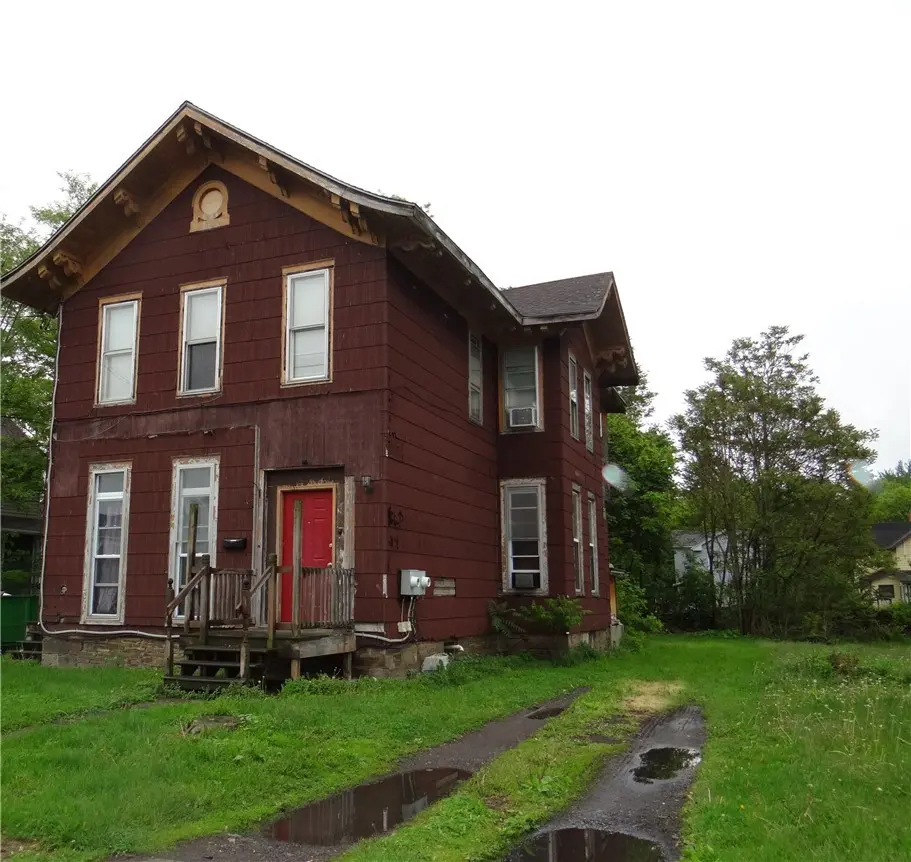
372 Diven Ave · Elmira, NY
Flood risk 5/10 · Moderate
- FEMA flood zone
- X (shaded)
- Chance of flooding over 30 yrs
- 0.26%
- Est. flood insurance / yr
- $473 – $860
Fire risk 3/10 · Minor
- Est. fire insurance / yr
- $691 – $1,283
Heat risk 3/10 · Minor
- Hot days now (above 94°F)
- 7 days/yr
- Hot days in 30 yrs
- 15 days/yr
Wind risk 1/10 · Minimal
- Chance of severe wind over 30 yrs
- 0.0%
Air-quality risk 1/10 · Minimal
- Unhealthy air days now
- 0 days/yr
- Unhealthy air days in 30 yrs
- 0 days/yr
Risk factors via First Street. Map © Google.
Why this score? — see what drove the A- grade
The composite is a weighted blend of 9 inputs, each scored 0–100. Each bar is that input's sub-score; the figure is the points it added to the 100-point composite (weight × sub-score).
- Cash flow +30.0/30.0
- ARV discount +10.5/15.0
- 1% rule +10.0/10.0
- DSCR +10.0/10.0
- Appreciation +10.0/10.0
- Livability +3.1/5.0
- Rent growth +2.5/5.0
- Condition / age +2.5/5.0
- Schools +2.4/10.0
$89,900
🖨 Deal sheet 📄 Offer letter ✓ Due diligence
Multi-family units
County records classify this as Multi-Family (2-4 Unit). Listing-text estimate: 2 units. confirmed
Listing remarks MLS
The exterior doesn't tell the whole story of this beautifully maintained 2-unit that through the years has been totally gutted from the foundation up & out. Electric & Plumbing were replaced. Double Sheetrock ceilings. Fully insulated walls. All new windows (30 plus windows), roof approximately 17 years old, new hot water heaters in2024/25. Separate utilities. Long-term tenants in downstairs apartment which has 2 large bedrooms, huge eat-in kitchen, living room, dining room, and laundry room. Upper apartment also has huge kitchen, 3 bedrooms plus bonus room, and laundry hookups. Lower apartment rent is below market value due to longevity of tenants. 48 hours notice to show. Both units are tenant occupied. Owner uncertain of exterior siding but does not believe it is asbestos (clapboard underneath).
Key facts
- Separate utilities
- Huge eat-in kitchen
- Laundry room
Tags
Neighborhood map
What this means for you Summary
Snapshot
- This is a 1×2bd/1.0ba + 1×3bd/1.0ba units multifamily listed at $90k.
Deal economics
- At list price, monthly cash flow is $1k ($18k/yr) — positive. Per door: $737/mo.
- The deal already cash-flows at list — no discount required.
- Meets the 1% rule at list price ($3k rent vs $90k).
- Recommended offer: $79k (12.0% below list) — sets the bar for market timing.
- Cap rate 26.0% vs local median 10.1% in Elmira — top-decile yield for the area; either an underpriced asset or a hidden risk that comps aren't pricing in. Stress-test before assuming the spread holds.
Location & tenants
- Location reads 62/100 on livability (#832 in NY) — a middle-class / working-renter tenant base. Strengths: cost of living A+, housing A+, health & safety A+; Watch: schools F, crime F, amenities F.
- Elmira City School District (urban): math 23% / reading 35% proficiency, ranked #580 of 590 in NY (top 98%) — low school quality limits family demand, transient renter base, plan for 1-2y turnover.
- Market conditions: 78 active listings in the ZIP; 91 units permitted in Chemung County in 2024 (63 in 5+ unit buildings).
Forward outlook
- In year one you build about $10k of equity ($622 loan paydown + $9k appreciation (10.0% local appreciation)).
- Chemung County population projected at -17% by 2050 — secular population decline; favor cash flow + early exit over multi-decade hold.
- At projected returns (10.0% appreciation + 3.0% rent growth), your $25k cash investment doubles in ~1 year — after that, you're playing with house money.
- By year 4, paydown + projected appreciation supports a ~$34k cash-out refi (75% LTV) — recoverable capital for the next deal without selling this one.
Negotiation context
- It's been on market 179 days — a 12% lower offer ($79k) is reasonable based on typical stale-listing flexibility.
- 6 sale attempts since 24y ago with the ask held roughly flat each time — persistent listings suggest the price (not the market) is what's stuck; bring a comps-based counter.
- Current owner paid $8k; list at $90k implies a 958% gain — meaningful room to come down on a strong offer.
Risks & watch-outs
- Watch-outs: built in 1875 — expect roof / HVAC / electrical / plumbing capex.
- Climate carrying-cost: moderate flood risk — expect insurance premiums to compound above CPI over the hold.
Questions for the listing agent
- It's been on market 179 days. Have you received any prior offers? Is the seller open to a 12% concession, seller financing, or rate buy-down credit?
- Can we see the unit-by-unit rent roll, current vacancy, and any below-market leases? What's the average tenancy length?
- What capital expenditures (roof, boiler, parking lot, exteriors) have been made in the last 5 years, and what's planned in the next 2?
- Built in 1875 — when were the roof, HVAC, electrical panel, plumbing, and water heater last replaced?
- Why hasn't it sold? Are there any deal-killer items the seller is aware of (foundation, flood, title, zoning, code violations)?
- Is there a deadline driving the sale (1031 exchange, divorce, estate, relocation)? That informs how much negotiation room exists.
- Schools are F-rated, which usually means shorter tenancies and higher turnover. Who's the typical renter profile here, and what's been the actual vacancy rate?
- Crime grade is F in this area — have there been break-ins, vandalism, or insurance claims at this property in the last 3 years? What carrier currently insures it and at what premium?
- What's the average days-on-market for RENTAL listings here right now (not sales)? A rising rental-DOM trend means longer vacancies and softer asking-rent achievability than the comps imply.
- What's the recent tenant-quality profile in this submarket — average credit score on applications, eviction rate, late-payment / NSF rate, and stable-employment percentage? A property-management company in the area should have these aggregated.
- How much new apartment / multifamily construction is in the pipeline within 1–3 miles? Heavy new supply (>2% of stock underway) typically softens rents 12–24 months out; light construction supports rent growth.
Investment metrics
- 1% rule
- 2.99% ✓
- Cap rate
- 25.98%
- Cash-on-cash
- 70.32%
- DSCR
- 4.13
- GRM
- 2.8
CMA / ARV
- ARV (median comp)
- $96,247
- List price
- $89,900
- Delta
- -6.59%
- Verdict
- FAIR
- Comps
- 20 within 1.0 mi
Show comp detail 8 sales within ~0.75 mi
| Address | Dist | Beds/Ba | Sqft | Sold | Price | $/sf | Match |
|---|---|---|---|---|---|---|---|
| 303-305 Norton St | 0.25mi | 6/2.0 (+1) | 2,580 (-0%) | 10mo | $48,500 | $19 | 75 |
| 375 E Thurston St | 0.11mi | 6/2.0 (+1) | 2,648 (+2%) | 18mo | $85,000 | $32 | 71 |
| 1213 Hall St | 0.22mi | 4/3.0 (-1) | 2,592 (+0%) | 19mo | $37,500 | $14 | 64 |
| 1127 Lake St | 0.32mi | 6/2.0 (+1) | 2,736 (+6%) | 7mo | $45,000 | $16 | 64 |
| 1207 Grand Central Ave | 0.28mi | 6/2.0 (+1) | 2,502 (-3%) | 18mo | $89,900 | $36 | 61 |
| 1171-1173 Magee St | 0.51mi | 5/2.0 | 2,364 (-8%) | 11mo | $45,000 | $19 | 53 |
| 312-314 Hathorn Street St | 0.69mi | 6/2.0 (+1) | 2,462 (-5%) | 7mo | $44,000 | $18 | 49 |
| 718-720 E Washington Ave | 0.72mi | 6/2.0 (+1) | 2,428 (-6%) | 12mo | $80,000 | $33 | 41 |
Match score weights: distance 35% · size 25% · config 20% · recency 20%. Top-matched comps best support the ARV.
Projected returns pro-forma
10.0% appreciation · 3.0% rent growth · sell at horizon
- IRR
- 81.3%
- Equity multiple
- 6.68×
- Total profit
- $142,961
- Equity at exit
- $80,989
- IRR
- 75.6%
- Equity multiple
- 14.79×
- Total profit
- $347,232
- Equity at exit
- $174,656
Cash invested: $25,172 (down + closing). Projections, not guarantees.
Landlord ↔ Tenant lean methodology
- Overall (STATE)
- 15 Strongly Tenant-Friendly
- State New York
- 15 Strongly Tenant-Friendly · D+10
- County
- — inherits STATE
- City
- — inherits STATE
ZIP-level market 14901
- Home prices YoY
- 15.9%
- Active inventory
- 78
- Price-to-rent
- 5.6×
Monthly cashflow live
- Estimated rent
- $2,686 high interval (Pro) →
- Mortgage (P&I)
- −$471
- Tax from tax record
- −$138 /mo · $1,657/yr
- Insurance
- −$37
- HOA
- −$0
- Vacancy / Maint / Mgmt
- −$564
- Net cashflow
- $1,475
Break-even live
2-unit breakdown (identical units grouped — click to expand)
| Units | Beds | Baths | Est. rent |
|---|---|---|---|
| 1× unit | 2 | 1 | $1,343 |
| 1× unit | 3 | 1 | $1,343 |
| Total (2 units) | $2,686 | ||
UW: 25.0% down · 7.5% · 30yr · 1.5% tax · 5.0% vac · 8.0% maint · 8.0% mgmt
Financing live
Cash to close
- Down payment
- $22,475
- Closing costs
- $2,697
- Reserves months
- —
- Total cash needed
- —
Loan-product check · same deal, 3 products live
Conventional
25% down · 7.5% · 30yr
- Down + closing
- —
- Monthly P&I
- —
- Monthly cashflow
- —
- DSCR
- —
- Eligible?
- —
Personal DTI + credit; lowest rate.
DSCR
20% down · 8.5% · 30yr
- Down + closing
- —
- Monthly P&I
- —
- Monthly cashflow
- —
- DSCR
- —
- Eligible?
- —
No personal income docs; deal must DSCR.
Hard money
10% down · 12.0% · 12mo
- Down + closing
- —
- Monthly P&I
- —
- Monthly cashflow
- —
- DSCR
- —
- Eligible?
- —
Short-term bridge; refi at stabilization.
Listing history 28 events
-
2026-06-19days on market $89,900 Active 179 DOM
-
2026-06-18days on market $89,900 Active 178 DOM
-
2026-06-17days on market $89,900 Active 177 DOM
-
2026-06-16days on market $89,900 Active 176 DOM
-
2026-06-15days on market $89,900 Active 175 DOM
-
2026-06-14days on market $89,900 Active 173 DOM
-
2026-06-12days on market $89,900 Active 172 DOM
-
2026-06-09days on market $89,900 Active 169 DOM
-
2026-06-08days on market $89,900 Active 168 DOM
-
2026-06-07days on market $89,900 Active 167 DOM
-
2026-06-05days on market $89,900 Active 164 DOM
-
2026-06-03days on market $89,900 Active 163 DOM
-
2026-06-02days on market $89,900 Active 162 DOM
-
2026-06-01days on market $89,900 Active 161 DOM
-
2026-05-31days on market $89,900 Active 160 DOM
-
2026-05-30days on market $89,900 Active 159 DOM
-
2025-12-22$89,900 Active 821-char remark
Show marketing remark (821 chars)
The exterior doesn't tell the whole story of this beautifully maintained 2-unit that through the years has been totally gutted from the foundation up & out. Electric & Plumbing were replaced. Double Sheetrock ceilings. Fully insulated walls. All new windows (30 plus windows), roof approximately 17 years old, new hot water heaters in2024/25. Separate utilities. Long-term tenants in downstairs apartment which has 2 large bedrooms, huge eat-in kitchen, living room, dining room, and laundry room. Upper apartment also has huge kitchen, 3 bedrooms plus bonus room, and laundry hookups. Lower apartment rent is below market value due to longevity of tenants. 48 hours notice to show. Both units are tenant occupied. Owner uncertain of exterior siding but does not believe it is asbestos (clapboard underneath).
-
2025-11-21historical
-
2025-08-22historical Active Under Contract
-
2025-05-22$89,900 Active
-
2023-06-08historical
-
2023-02-13$74,500
-
2023-01-23historical
-
2022-07-25$74,500
-
2005-03-02historical
-
2004-12-02$19,000
-
2004-11-23soldstatus $8,500
-
2002-01-30$16,000
ⓘ Source: listings_history table (triggers on properties + properties_extension) + one-shot
backfill from property_details.listing_events for pre-trigger history.
Tax reassessment forecast NY · Partial reset (capped growth)
- Current annual tax
- $1,657 · $138/mo
- Projected year-2 tax
- $1,657 · $138/mo
- Expected delta
- $0/yr ($0/mo · -0.0%)
ⓘ Screening estimate from a state-policy table — verify with the county assessor before closing.
Climate risk First Street
- Flood 5/10 Major FEMA zone X (shaded) · 26% chance over 30 yrs
- Wildfire 3/10 Moderate
- Heat 3/10 Moderate 7 d/yr ≥94°F today · 15 d/yr by 30 yrs out
- Wind 1/10 Low 0% chance of damaging wind over 30 yrs
- Air quality 1/10 Low 0 unhealthy d/yr today · 0 by 30 yrs out
Nearby sold comps map
Loading sold comps map…
Walkable amenities ~0.75 mi
Loading nearby amenities…
Taxation est. · year 1
- Rental income
- $32,232
- − Mortgage interest
- −$5,036
- − Property taxes
- −$1,657
- − Insurance
- −$450
- − Repairs & maintenance
- −$2,579
- − Management
- −$2,579
- − Depreciation
- −$2,615
- Taxable income
- $17,318
- Est. tax owed @ 24.0%
- −$4,156
- After-tax cash flow
- $13,544/yr
For passive investors: Depreciation is non-cash, so a rental often shows a tax loss while cash-flowing — sheltering income. Rental losses are passive: they offset passive income freely, and up to $25,000/yr can offset ordinary (W-2) income if you actively participate and your MAGI is under $100k (phasing out to $0 by $150k); unused losses carry forward. On sale, claimed depreciation is recaptured at up to 25%, and gains may owe capital-gains tax (a 1031 exchange can defer both). Figures are a year-1 estimate at your 24.0% rate — not tax advice; consult a CPA.
Schools (NCES district)
- District
- Elmira City School District
- NCES district ID
- 3610560
- Math proficiency
- 23% ▼ -7.00%
- Reading proficiency
- 35% ▲ 7.00%
- Median HH income
- $40,180
- Composite
- 24.39/100
- National rank
- #7688
- State rank
- #580 of 590 in NY
Livability — Elmira
- Score
- 62/100
- State rank
- #832
- US rank
- #16139
Category grades
Schools grade is shown separately in the Schools card above.
Census & demographics
- Census place
- Elmira, NY
- City population
- 14,276
- Population (ZIP)
- 14,430
Population outlook (Chemung County) Hauer SSP2
- Today (2025)
- 82,931 people
- By 2030
- 80,356 · -3.1%
- By 2040
- 74,745 · -9.9%
- By 2050
- 69,012 · -16.8%
- By 2075
- 55,689 · -32.8%
- By 2100
- 41,428 · -50.0%
Race, ethnicity, and origin ACS 2023
- Neighborhood character
- Predominantly White (70%)
- Race & ethnicity
- White 70% Black 15% Two or more races 7% Hispanic / Latino 7% Asian 1%
- Hispanic origin (detail)
- Mexican 1% Puerto Rican 3%
- Common ancestry
- Romanian 4% Slovak 3% Iranian 2%
- Foreign-born
- 4% · Canada, China
- Languages at home
- 93% English-only · Spanish 3% Russian/Polish/Slavic 1% Chinese 1%
Political lean MEDSL · Chemung
- 2024 margin
- R (+16.8) · D 41.6% · R 58.4%
- 2008→2024 swing
- -15.6pp toward R · 2008: -1.2pp · 2024: -16.8pp
- All cycles
- 2024: R+16.8 2020: R+13.4 2016: R+20.0 2012: R+2.9 2008: R+1.2
Not yet ingested
- Civics
- —
Market trends
- HPI YoY
- ▲ 32.34%
- Current HPI
- 236.2674
- Rent YoY
- —
- Metro
- —
- State GDP YoY
- ▲ 2.60%
- F500 in state
- 92
Industry mix (Fortune 500 HQ in NY)
| Industry | F500 HQs | Revenue |
|---|---|---|
| Financial Services | 10 | $950B |
|
||
| Consumer Goods | 9 | $162B |
|
||
| Insurance | 4 | $225B |
|
||
| Telecommunications | 2 | $144B |
|
||
| Pharmaceuticals | 2 | $112B |
|
||
| Media / Entertainment | 2 | $69B |
|
||
Price history
+461.9% since first listed12 events — show timeline
- 2025-12-22 Listed $89,900 UNYREIS
- 2025-11-21 Listing Removed — UNYREIS
- 2025-08-22 Contingent — UNYREIS
- 2025-05-22 Listed $89,900 UNYREIS
- 2023-06-08 Listing Removed — UNYREIS
- 2023-02-13 Listed $74,500 UNYREIS
- 2023-01-23 Listing Removed — UNYREIS
- 2022-07-25 Listed $74,500 UNYREIS
- 2005-03-02 Listing Removed — UNYREIS
- 2004-12-02 Listed $19,000 UNYREIS
- 2004-11-23 Sold (MLS) $8,500 UNYREIS
- 2002-01-30 Listed $16,000 UNYREIS
Property tax history
+5.0%/yrLatest (2025): $1,657 · -37.2% YoY. Source: county tax records.
Cash-flow waterfall
monthlySold comps — $/sqft
last 12 mo · ≤1 miLoading sold comps…