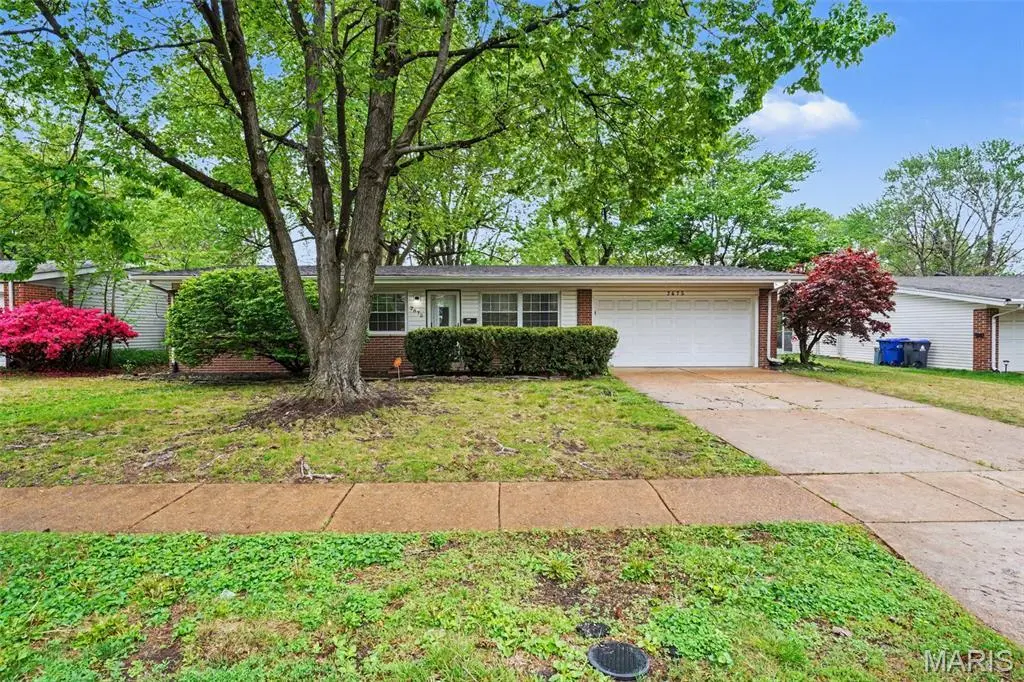
2675 Narraganset Dr · Florissant, MO
Flood risk 1/10 · Minimal
- FEMA flood zone
- X (unshaded)
- Chance of flooding over 30 yrs
- 0.0%
- Est. flood insurance / yr
- $473 – $860
Fire risk 1/10 · Minimal
- Est. fire insurance / yr
- $1,054 – $1,958
Heat risk 5/10 · Moderate
- Hot days now (above 106°F)
- 7 days/yr
- Hot days in 30 yrs
- 21 days/yr
Wind risk 2/10 · Minimal
- Chance of severe wind over 30 yrs
- 1.0%
Air-quality risk 3/10 · Minor
- Unhealthy air days now
- 3 days/yr
- Unhealthy air days in 30 yrs
- 5 days/yr
Risk factors via First Street. Map © Google.
Why this score? — see what drove the D grade
The composite is a weighted blend of 9 inputs, each scored 0–100. Each bar is that input's sub-score; the figure is the points it added to the 100-point composite (weight × sub-score).
- Cash flow +11.4/30.0
- Appreciation +10.0/10.0
- Rent growth +4.4/5.0
- ARV discount +4.1/15.0
- Livability +3.7/5.0
- DSCR +3.3/10.0
- 1% rule +2.9/10.0
- Condition / age +2.5/5.0
- Schools +1.2/10.0
$219,900
🖨 Deal sheet (PDF) 📄 Offer letter ✓ Due diligence
Listing remarks MLS
This home is gorgeous inside and out - a MUST SEE! The property boasts of 3 bedrooms with newly installed carpet and 2.5 beautifully renovated bathrooms, a remodeled kitchen, complete with custom cabinets and granite countertops. There is a large family room right off the kitchen that leads to a very inviting screened in sun porch. The partially finished lower level has a lot to offer including a full bathroom, a bonus room, and a wet bar. The large fenced yard is level and has a freshly painted deck that is great for entertaining.
Key facts
- Tall ceilings
- Major transit routes
- Cozy fireplace
Tags
Property features AI
Exterior
- Parking: Attached garage with garage door opener; Off-street parking; 2-car garage
- Utilities: Public water; Public sewer; Electricity available
- Home design: Single-family residence; One story; House structure
- Construction: Brick and vinyl siding exterior; Composition shingle roof
- Exterior features: Patio; Porch; Level lot; Road frontage on a city street
Interior
- Kitchen: Dishwasher; Microwave; Range; Refrigerator; Water heater
- Bedrooms: Three bedrooms, all on the main level (sizes: 12x14, 10x10, 10x10)
- Flooring: Carpet; Laminate; Vinyl
- Bathrooms: Two full bathrooms and one half bathroom
- Heating & cooling: Forced air heating (natural gas); Central air conditioning (electric)
- Interior features: Ceiling fans; Crown molding; Dry bar; Stone countertops; Insulated windows
- Laundry & utility: Basement with partially finished areas and a bathroom (includes sleeping area)
Neighborhood map
What this means for you Summary
Snapshot
- This is a 3-bed/2.5-bath single-family listed at $220k.
Deal economics
- At list price, monthly cash flow is $-78 ($-932/yr) — negative.
- To cash-flow at today's rent, offer at most $206k (6.2% below list).
- To meet the 1% rule (rent ≥ 1% of price), the offer needs to be $173k (21.3% below list).
- Recommended offer: $173k (21.3% below list) — sets the bar for 1% rule.
Location & tenants
- Location reads 73/100 on livability (#82 in MO) — a middle-class / working-renter tenant base. Strengths: cost of living A+, housing A+, health & safety B+; Watch: crime C-, amenities D+, commute F.
- Ferguson-Florissant R-II (suburban): math 7% / reading 20% proficiency, ranked #311 of 324 in MO (top 96%) — low school quality limits family demand, transient renter base, plan for 1-2y turnover; 70% free/reduced lunch — lower-income household profile, screen leases tightly.
- Zoned schools: Parker Road Elementary (354 students, 99% FRL); Cross Keys Middle (math 5% / reading 10%, grade F, #379 of 391 statewide, top 97%, 625 students, 100% FRL); Mccluer North High (math 5% / reading 28%, grade F, #487 of 521 statewide, top 93%, 1,136 students, 100% FRL) — zoned schools average 99% FRL vs 70% district-wide (30 pts higher); higher-poverty schools than district average — tighter screening recommended.
- Market conditions: Rents rising fast (+7.5%/yr); 221 active listings in the ZIP; 30 comparable units currently listed for rent nearby; rentals at typical pace (median 26d on market — plan ~3-4 weeks tenant-placement turnaround); 40% of comp listings sitting > 30 days — soft ceiling on asking rent; 920 units permitted in St. Louis County in 2024 (250 in 5+ unit buildings).
- This rent runs 31% of the median local income ($67k/yr) — at the standard rent-burdened threshold; future hikes will face affordability resistance.
Forward outlook
- In year one you build about $24k of equity ($2k loan paydown + $22k appreciation (10.0% local appreciation)).
- At projected returns (10.0% appreciation + 7.5% rent growth), your $62k cash investment doubles in ~3 years — after that, you're playing with house money.
- By year 2, paydown + projected appreciation supports a ~$38k cash-out refi (75% LTV) — recoverable capital for the next deal without selling this one.
Negotiation context
- It's been on market 62 days — a 6% lower offer ($207k) is reasonable based on typical stale-listing flexibility.
- 2 sale attempts since 5y ago; this cycle's ask has dropped $15k (6%) from the opening price — seller is motivated, your offer sets the floor, not the list.
Risks & watch-outs
- Watch-outs: built in 1957 — expect roof / HVAC / electrical / plumbing capex.
- Climate carrying-cost: extreme-heat days projected 7→21/yr by 2055 (HVAC capex compounding) — expect insurance premiums to compound above CPI over the hold.
Questions for the listing agent
- What do current leases actually rent for vs. the listed asking? Can we see a recent rent roll and the last 12 months of T-12 income?
- It's been on market 62 days. Have you received any prior offers? Is the seller open to a 21% concession, seller financing, or rate buy-down credit?
- Built in 1957 — when were the roof, HVAC, electrical panel, plumbing, and water heater last replaced?
- Why hasn't it sold? Are there any deal-killer items the seller is aware of (foundation, flood, title, zoning, code violations)?
- Is there a deadline driving the sale (1031 exchange, divorce, estate, relocation)? That informs how much negotiation room exists.
- Schools are D-rated, which usually means shorter tenancies and higher turnover. Who's the typical renter profile here, and what's been the actual vacancy rate?
- The area grade is low — what's the realistic commute time and amenity access for the typical tenant pool here? Any planned neighborhood developments (good or bad) we should know about?
- What's the average days-on-market for RENTAL listings here right now (not sales)? A rising rental-DOM trend means longer vacancies and softer asking-rent achievability than the comps imply.
- What's the recent tenant-quality profile in this submarket — average credit score on applications, eviction rate, late-payment / NSF rate, and stable-employment percentage? A property-management company in the area should have these aggregated.
- How much new for-sale + rental construction is in the pipeline within 1–3 miles? Heavy new supply typically softens prices + rents 12–24 months out; constrained supply supports both.
Investment metrics
- 1% rule
- 0.79% ✗
- Cap rate
- 5.87%
- Cash-on-cash
- -1.51%
- DSCR
- 0.93
- GRM
- 10.6
CMA / ARV
- ARV (median comp)
- $204,489
- List price
- $219,900
- Delta
- 7.54%
- Verdict
- FAIR
- Comps
- 20 within 1.0 mi
Show comp detail 12 sales within ~0.75 mi
| Address | Dist | Beds/Ba | Sqft | Sold | Price | $/sf | Match |
|---|---|---|---|---|---|---|---|
| 1345 Hialeah Pl | 0.25mi | 4/2.5 (+1) | 1,344 (+2%) | 1mo | $215,000 | $160 | 80 |
| 1680 Horseshoe Dr | 0.30mi | 3/2.0 | 1,364 (+3%) | 1mo | $191,000 | $140 | 77 |
| 1385 Spring Valley Dr | 0.43mi | 3/2.0 | 1,376 (+4%) | 1mo | $214,900 | $156 | 70 |
| 2340 Johnstown Dr | 0.55mi | 3/2.0 | 1,344 (+2%) | 2mo | $119,000 | $89 | 68 |
| 3345 Steed Dr | 0.67mi | 3/2.5 | 1,314 (-0%) | 1mo | $259,900 | $198 | 67 |
| 1475 Nashua Dr | 0.30mi | 3/1.5 | 1,160 (-12%) | 1mo | $169,900 | $146 | 61 |
| 1320 Pepperhill Dr | 0.61mi | 3/2.0 | 1,247 (-6%) | 1mo | $200,000 | $160 | 60 |
| 1280 Old York Dr | 0.59mi | 4/2.5 (+1) | 1,386 (+5%) | 1mo | $235,000 | $170 | 58 |
| 1585 Pepperhill Dr | 0.53mi | 3/2.0 | 1,204 (-9%) | 2mo | $225,000 | $187 | 57 |
| 1980 Parker Rd | 0.53mi | 3/1.5 | 1,196 (-9%) | 1mo | $182,157 | $152 | 55 |
| 3255 Classic Dr | 0.67mi | 3/2.0 | 1,416 (+7%) | 0mo | $250,000 | $177 | 55 |
| 1370 Willowbrook | 0.54mi | 3/2.0 | 1,460 (+11%) | 1mo | $225,000 | $154 | 54 |
Match score weights: distance 35% · size 25% · config 20% · recency 20%. Top-matched comps best support the ARV.
Projected returns pro-forma
10.0% appreciation · 7.51% rent growth · sell at horizon
- IRR
- 24.6%
- Equity multiple
- 3.00×
- Total profit
- $123,012
- Equity at exit
- $198,103
- IRR
- 22.9%
- Equity multiple
- 7.27×
- Total profit
- $386,069
- Equity at exit
- $427,217
Cash invested: $61,572 (down + closing). Projections, not guarantees.
Landlord ↔ Tenant lean methodology
- Overall (STATE)
- 81 Strongly Landlord-Friendly
- State Missouri
- 81 Strongly Landlord-Friendly · R+10
- County
- — inherits STATE
- City
- — inherits STATE
ZIP-level market 63033
- Home prices YoY
- 2.5%
- Rents YoY
- 7.5%
- Active inventory
- 221
- Price-to-rent
- 10.6×
Monthly cashflow live
- Estimated rent
- $1,732 high interval (Pro) →
- Mortgage (P&I)
- −$1,153
- Tax from tax record
- −$201 /mo · $2,411/yr
- Insurance
- −$92
- HOA
- −$0
- Vacancy / Maint / Mgmt
- −$364
- Net cashflow
- $-78
Break-even live
Sensitivity live
| Price | -10% $47 | -5% $-15 | +0% $-78 | +5% $-140 | +10% $-202 |
|---|---|---|---|---|---|
| Rent | -10% $-214 | -5% $-146 | +0% $-78 | +5% $-9 | +10% $59 |
| Rate | -1.0pp $33 | -0.5pp $-22 | base $-78 | +0.5pp $-135 | +1.0pp $-193 |
UW: 25.0% down · 7.5% · 30yr · 1.5% tax · 5.0% vac · 8.0% maint · 8.0% mgmt
Financing live
Cash to close
- Down payment
- $54,975
- Closing costs
- $6,597
- Reserves months
- —
- Total cash needed
- —
Loan-product check · same deal, 3 products live
Conventional
25% down · 7.5% · 30yr
- Down + closing
- —
- Monthly P&I
- —
- Monthly cashflow
- —
- DSCR
- —
- Eligible?
- —
Personal DTI + credit; lowest rate.
DSCR
20% down · 8.5% · 30yr
- Down + closing
- —
- Monthly P&I
- —
- Monthly cashflow
- —
- DSCR
- —
- Eligible?
- —
No personal income docs; deal must DSCR.
Hard money
10% down · 12.0% · 12mo
- Down + closing
- —
- Monthly P&I
- —
- Monthly cashflow
- —
- DSCR
- —
- Eligible?
- —
Short-term bridge; refi at stabilization.
Rent comps 30 comps
| Address | Beds | Baths | Sqft | Rent | $/sqft | DOM | Units | Dist |
|---|---|---|---|---|---|---|---|---|
| 1600 Horseshoe Dr Florissant, MO | 3.0 | 2.0 | 1314 | $1,550 | $1.18 | 45d | 1 | 0.20mi |
| 1785 Trotter Way Florissant, MO | 3.0 | 2.0 | 1297 | $1,806 | $1.39 | 9d | 1 | 0.33mi |
| 945 Paddock Dr Florissant, MO | 4.0 | 2.0 | 1875 | $1,850 | $0.99 | 6d | 1 | 0.47mi |
| 2990 Santiago Dr Florissant, MO | 2.0 | 2.0 | 984 | $1,200 | $1.22 | 45d | 1 | 0.49mi |
| 560 Jamaica Pl Florissant, MO | 3.0 | 2.0 | 1350 | $1,653 | $1.22 | 45d | 1 | 0.72mi |
| 3 Cantabrian Ct Florissant, MO | 3.0 | 2.0 | 1436 | $1,881 | $1.31 | 16d | 1 | 0.76mi |
| 410 Ridge Dr Florissant, MO | 3.0 | 2.0 | 1226 | $1,650 | $1.35 | 19d | 1 | 0.89mi |
| 1725 Saint Catherine St Florissant, MO | 3.0 | 1.0 | 1107 | $1,700 | $1.54 | 0d | 1 | 0.92mi |
| 20 Saint Benedict Ln Florissant, MO | 3.0 | 1.5 | 1092 | $1,525 | $1.40 | 22d | 1 | 0.94mi |
| 1710 Kay Dr Florissant, MO | 3.0 | 1.0 | 960 | $1,500 | $1.56 | 3d | 1 | 0.98mi |
| 9 Saint Celeste Dr Florissant, MO | 3.0 | 1.0 | 992 | $1,450 | $1.46 | 45d | 1 | 1.02mi |
| 2075 Cordoba Dr Florissant, MO | 3.0 | 2.0 | 1523 | $1,850 | $1.21 | 16d | 1 | 1.04mi |
| 3 Champlain Ct Florissant, MO | 3.0 | 1.0 | 1100 | $1,600 | $1.45 | 45d | 1 | 1.06mi |
| 765 Bobbins Ln Florissant, MO | 3.0 | 1.0 | 1107 | $1,450 | $1.31 | 45d | 1 | 1.06mi |
| 1280 Saint Catherine St Florissant, MO | 3.0 | 1.0 | 1274 | $1,600 | $1.26 | 16d | 1 | 1.09mi |
| 1740 Deborah Dr Florissant, MO | 3.0 | 2.5 | 1650 | $1,750 | $1.06 | 19d | 1 | 1.10mi |
| 3144 Sunswept Pk Ct Florissant, MO | 1.0–3.0 | 1.0–2.0 | 818 | $1,225 | $1.50 | 0d | 12 | 1.10mi |
| 100 Taney Dr Florissant, MO | 3.0 | 1.0 | 1148 | $1,495 | $1.30 | 23d | 1 | 1.12mi |
| 790 Pebble Ln Florissant, MO | 3.0 | 2.0 | 1242 | $1,795 | $1.45 | 25d | 1 | 1.13mi |
| 805 Robinwood Dr Florissant, MO | 3.0 | 1.5 | 1729 | $1,571 | $0.91 | 22d | 1 | 1.15mi |
| 1545 Washington St Florissant, MO | 3.0 | 1.5 | 1337 | $1,960 | $1.47 | 0d | 1 | 1.16mi |
| 297 Saint Eugene Ln Florissant, MO | 2.0 | 1.0 | 1100 | $1,100 | $1.00 | 45d | 1 | 1.17mi |
| 1600 Washington St Florissant, MO | 3.0 | 1.5 | 1095 | $1,250 | $1.14 | 22d | 1 | 1.21mi |
| 1670 Arundel Dr Florissant, MO | 3.0 | 2.0 | 1012 | $1,450 | $1.43 | 25d | 1 | 1.26mi |
| 330 Moule Dr Florissant, MO | 3.0 | 1.0 | 1014 | $1,575 | $1.55 | 45d | 1 | 1.27mi |
| 13 Cricket Ct Florissant, MO | 4.0 | 3.0 | 1560 | $2,550 | $1.63 | 45d | 1 | 1.39mi |
| 3930 Belcroft Dr Florissant, MO | 3.0 | 3.0 | 1408 | $1,935 | $1.37 | 45d | 1 | 1.41mi |
| 1095 Ozment Dr Florissant, MO | 3.0 | 2.0 | 984 | $1,461 | $1.48 | 25d | 1 | 1.42mi |
| 1050 Ozment Dr Florissant, MO | 3.0 | 2.0 | 984 | $1,525 | $1.55 | 45d | 1 | 1.44mi |
| 470 Hundley Dr Florissant, MO | 3.0 | 2.0 | 962 | $1,595 | $1.66 | 45d | 1 | 1.50mi |
Listing history 24 events
-
2026-06-21days on market $219,900 Active 62 DOM
-
2026-06-18days on market $219,900 Active 59 DOM
-
2026-06-17days on market $219,900 Active 58 DOM
-
2026-06-16days on market $219,900 Active 57 DOM
-
2026-06-15days on market $219,900 Active 56 DOM
-
2026-06-13days on market $219,900 Active 54 DOM
-
2026-06-13pricedays on market $219,900 Active 53 DOM
-
2026-06-09days on market $224,900 Active 50 DOM
-
2026-06-08days on market $224,900 Active 49 DOM
-
2026-06-07days on market $224,900 Active 48 DOM
-
2026-06-05days on market $224,900 Active 45 DOM
-
2026-06-03days on market $224,900 Active 44 DOM
-
2026-06-02days on market $224,900 Active 43 DOM
-
2026-06-01days on market $224,900 Active 42 DOM
-
2026-05-31days on market $224,900 Active 41 DOM
-
2026-05-15price $224,900 659-char remark
-
2026-04-20$234,900 Active 659-char remark
-
2021-11-01soldstatus $192,900
-
2021-10-27status Pending 537-char remark
Show marketing remark (537 chars)
This home is gorgeous inside and out - a MUST SEE! The property boasts of 3 bedrooms with newly installed carpet and 2.5 beautifully renovated bathrooms, a remodeled kitchen, complete with custom cabinets and granite countertops. There is a large family room right off the kitchen that leads to a very inviting screened in sun porch. The partially finished lower level has a lot to offer including a full bathroom, a bonus room, and a wet bar. The large fenced yard is level and has a freshly painted deck that is great for entertaining.
-
2021-10-21soldstatus Closed 537-char remark
Show marketing remark (537 chars)
This home is gorgeous inside and out - a MUST SEE! The property boasts of 3 bedrooms with newly installed carpet and 2.5 beautifully renovated bathrooms, a remodeled kitchen, complete with custom cabinets and granite countertops. There is a large family room right off the kitchen that leads to a very inviting screened in sun porch. The partially finished lower level has a lot to offer including a full bathroom, a bonus room, and a wet bar. The large fenced yard is level and has a freshly painted deck that is great for entertaining.
-
2021-09-27historical Active Under Contract 537-char remark
Show marketing remark (537 chars)
This home is gorgeous inside and out - a MUST SEE! The property boasts of 3 bedrooms with newly installed carpet and 2.5 beautifully renovated bathrooms, a remodeled kitchen, complete with custom cabinets and granite countertops. There is a large family room right off the kitchen that leads to a very inviting screened in sun porch. The partially finished lower level has a lot to offer including a full bathroom, a bonus room, and a wet bar. The large fenced yard is level and has a freshly painted deck that is great for entertaining.
-
2021-09-24$179,900 Active 537-char remark
Show marketing remark (537 chars)
This home is gorgeous inside and out - a MUST SEE! The property boasts of 3 bedrooms with newly installed carpet and 2.5 beautifully renovated bathrooms, a remodeled kitchen, complete with custom cabinets and granite countertops. There is a large family room right off the kitchen that leads to a very inviting screened in sun porch. The partially finished lower level has a lot to offer including a full bathroom, a bonus room, and a wet bar. The large fenced yard is level and has a freshly painted deck that is great for entertaining.
-
2021-09-22historical $179,900 537-char remark
Show marketing remark (537 chars)
This home is gorgeous inside and out - a MUST SEE! The property boasts of 3 bedrooms with newly installed carpet and 2.5 beautifully renovated bathrooms, a remodeled kitchen, complete with custom cabinets and granite countertops. There is a large family room right off the kitchen that leads to a very inviting screened in sun porch. The partially finished lower level has a lot to offer including a full bathroom, a bonus room, and a wet bar. The large fenced yard is level and has a freshly painted deck that is great for entertaining.
-
1996-03-15soldstatus $89,000
ⓘ Source: listings_history table (triggers on properties + properties_extension) + one-shot
backfill from property_details.listing_events for pre-trigger history.
Tax reassessment forecast MO · Resets to sale price
- Current annual tax
- $2,411 · $201/mo
- Projected year-2 tax
- $2,411 · $201/mo
- Expected delta
- $0/yr ($0/mo · 0.0%)
ⓘ Screening estimate from a state-policy table — verify with the county assessor before closing.
Climate risk First Street
- Flood 1/10 Low FEMA zone X (unshaded) · 0% chance over 30 yrs
- Wildfire 1/10 Low
- Heat 5/10 Major 7 d/yr ≥106°F today · 21 d/yr by 30 yrs out
- Wind 2/10 Low 100% chance of damaging wind over 30 yrs
- Air quality 3/10 Moderate 3 unhealthy d/yr today · 5 by 30 yrs out
Nearby sold comps map
Loading sold comps map…
Walkable amenities ~0.75 mi
Loading nearby amenities…
Taxation est. · year 1
- Rental income
- $20,780
- − Mortgage interest
- −$12,318
- − Property taxes
- −$2,411
- − Insurance
- −$1,100
- − Repairs & maintenance
- −$1,662
- − Management
- −$1,662
- − Depreciation
- −$6,397
- Taxable loss
- −$4,770
- Est. tax savings @ 24.0%
- +$1,145
- After-tax cash flow
- $213/yr
For passive investors: Depreciation is non-cash, so a rental often shows a tax loss while cash-flowing — sheltering income. Rental losses are passive: they offset passive income freely, and up to $25,000/yr can offset ordinary (W-2) income if you actively participate and your MAGI is under $100k (phasing out to $0 by $150k); unused losses carry forward. On sale, claimed depreciation is recaptured at up to 25%, and gains may owe capital-gains tax (a 1031 exchange can defer both). Figures are a year-1 estimate at your 24.0% rate — not tax advice; consult a CPA.
Schools (NCES district)
- District
- Ferguson-Florissant R-II
- NCES district ID
- 2912010
- Math proficiency
- 7% ▼ -9.00%
- Reading proficiency
- 20% ▼ -6.00%
- Median HH income
- $44,610
- Composite
- 11.96/100
- National rank
- #9666
- State rank
- #311 of 324 in MO
Livability — Florissant
- Score
- 73/100
- State rank
- #82
- US rank
- #5406
Category grades
Schools grade is shown separately in the Schools card above.
Census & demographics
- Census place
- Florissant, MO
- County
- Saint Louis County · 888,823 people
- City population
- 69,104
- Metro
- St. Louis, MO-IL
- Population (ZIP)
- 43,056
- Household income
- $66,776
- Rent vs Own
- Severe rent burden
- 1429.0
Population outlook (St. Louis County) Hauer SSP2
- Today (2025)
- 1,025,227 people
- By 2030
- 1,028,023 · +0.3%
- By 2040
- 1,020,940 · -0.4%
- By 2050
- 1,007,280 · -1.8%
- By 2075
- 987,277 · -3.7%
- By 2100
- 921,984 · -10.1%
Race, ethnicity, and origin ACS 2023
- Neighborhood character
- Predominantly Black (71%)
- Race & ethnicity
- Black 71% White 23% Two or more races 4% Hispanic / Latino 1%
- Common ancestry
- Romanian 1% Lithuanian 1% Italian 1%
- Foreign-born
- 3% · Canada, Vietnam
- Languages at home
- 95% English-only · Spanish 1% French/Haitian/Cajun 1%
Political lean MEDSL · St. Louis
- 2024 margin
- Strong D (+23.4) · D 60.8% · R 37.4% · Other 1.7%
- 2008→2024 swing
- +3.5pp toward D · 2008: 19.9pp · 2024: 23.4pp
- All cycles
- 2024: D+23.4 2020: D+24.0 2016: D+16.2 2012: D+13.7 2008: D+19.9
Not yet ingested
- Civics
- —
Market trends
- HPI YoY
- ▲ 13.78%
- Current HPI
- 570.6
- Rent YoY
- ▲ 7.51%
- Metro
- St. Louis, MO-IL
- State GDP YoY
- ▲ 1.84%
- F500 in state
- 20
Industry mix (Fortune 500 HQ in MO)
| Industry | F500 HQs | Revenue |
|---|---|---|
| Healthcare | 1 | $163B |
|
||
| Insurance | 1 | $21B |
|
||
| Industrial Technology | 1 | $17B |
|
||
| Retail | 1 | $16B |
|
||
| Industrial Distribution | 1 | $10B |
|
||
| Utilities | 1 | $9B |
|
||
Price history
+147.1% since first listed10 events — show timeline
- 2026-06-12 Price Changed $219,900 MARIS as Distributed by MLS Grid
- 2026-05-15 Price Changed $224,900 MARIS as Distributed by MLS Grid
- 2026-04-20 Listed $234,900 MARIS as Distributed by MLS Grid
- 2021-11-01 Sold (Public Records) $192,900 Public Records
- 2021-10-27 Pending — MARIS as Distributed by MLS Grid
- 2021-10-21 Sold (MLS) — MARIS as Distributed by MLS Grid
- 2021-09-27 Contingent — MARIS as Distributed by MLS Grid
- 2021-09-24 Listed $179,900 MARIS as Distributed by MLS Grid
- 2021-09-22 Coming Soon $179,900 MARIS as Distributed by MLS Grid
- 1996-03-15 Sold (Public Records) $89,000 Public Records
Property tax history
+3.5%/yrLatest (2022): $2,411 · +1.7% YoY. Source: county tax records.
Cash-flow waterfall
monthlySold comps — $/sqft
last 12 mo · ≤1 miLoading sold comps…