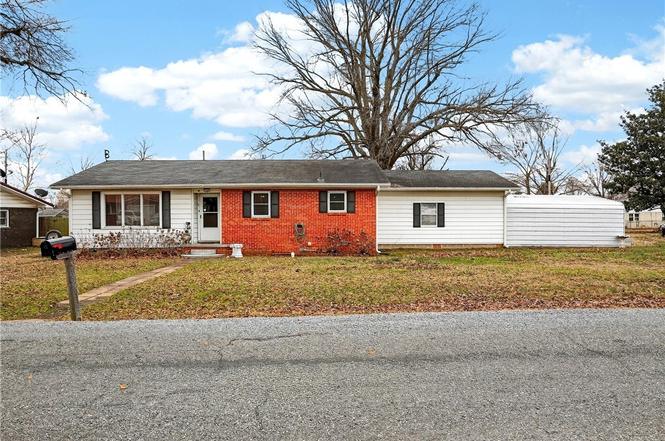
506 Mimosa Dr · Stigler, OK
Flood risk 1/10 · Minimal
- FEMA flood zone
- X (unshaded)
- Chance of flooding over 30 yrs
- 0.0%
- Est. flood insurance / yr
- $507 – $1,088
Fire risk 5/10 · Moderate
- Est. fire insurance / yr
- $2,463 – $4,575
Heat risk 6/10 · Moderate
- Hot days now (above 111°F)
- 7 days/yr
- Hot days in 30 yrs
- 19 days/yr
Wind risk 3/10 · Minor
- Chance of severe wind over 30 yrs
- 7.0%
Air-quality risk 2/10 · Minimal
- Unhealthy air days now
- 1 days/yr
- Unhealthy air days in 30 yrs
- 1 days/yr
Risk factors via First Street. Map © Google.
Why this score? — see what drove the B- grade
The composite is a weighted blend of 9 inputs, each scored 0–100. Each bar is that input's sub-score; the figure is the points it added to the 100-point composite (weight × sub-score).
- Cash flow +23.9/30.0
- ARV discount +15.0/15.0
- DSCR +7.7/10.0
- Appreciation +6.9/10.0
- 1% rule +5.1/10.0
- Livability +3.2/5.0
- Rent growth +2.5/5.0
- Condition / age +2.5/5.0
- Schools +1.9/10.0
$99,000
🖨 Deal sheet (PDF) 📄 Offer letter ✓ Due diligence
Listing remarks
Charming traditional home 2-bedroom, 1 bath tub/shower combo bathroom, (the 3rd bedroom was made into an office, a convenient carport, and a functional layout ideal for comfortable living. Major updates include an HVAC system and water heater, both approximately 5 years old. Situated in an established neighborhood with easy access to local amenities, this property offers a great opportunity for homeowners or investors alike. Schedule your showing today!
Key facts
- Water heater
- Carport
- Local amenities
Tags
Property features AI
Exterior
- Parking: Attached carport; 2 covered parking spaces; Concrete parking surface
- Utilities: Public water; Sewer available; Electricity available; Natural gas available
- Home design: Single family residence; One story; House
- Construction: Brick and vinyl siding exterior; Asphalt shingle roof
- Exterior features: Wood privacy fencing in back yard; Cleared lot; Corner lot; City lot; Public maintained road
Interior
- Kitchen: Oven; Refrigerator
- Bedrooms: Total rooms listed as 1
- Flooring: Carpet; Laminate
- Bathrooms: One full bathroom
- Heating & cooling: Central heating (natural gas); Central air; Ceiling fan(s)
- Interior features: Ceiling fan(s); Blinds
- Laundry & utility: Washer hookup; Electric dryer hookup; Gas water heater
Neighborhood map
What this means for you Summary
Snapshot
- This is a 3-bed/1.0-bath single-family listed at $99k.
Deal economics
- At list price, monthly cash flow is $191 ($2k/yr) — positive.
- The deal already cash-flows at list — no discount required.
- Meets the 1% rule at list price ($996 rent vs $99k).
- Recommended offer: $90k (9.0% below list) — sets the bar for market timing.
- Cap rate 8.6% vs local median 3.7% in Stigler — top-decile yield for the area; either an underpriced asset or a hidden risk that comps aren't pricing in. Stress-test before assuming the spread holds.
Location & tenants
- Location reads 65/100 on livability (#159 in OK) — a middle-class / working-renter tenant base. Strengths: cost of living A+, housing A-; Watch: health & safety C-, amenities F, commute F.
- Stigler (town): math 20% / reading 25% proficiency, ranked #151 of 270 in OK (top 56%) — low school quality limits family demand, transient renter base, plan for 1-2y turnover.
- Zoned schools: Stigler Es (math 37% / reading 32%, grade F, #168 of 845 statewide, top 24%, 448 students, 0% FRL); Stigler Ms (math 14% / reading 18%, grade F, #213 of 345 statewide, top 62%, 354 students, 0% FRL); Stigler Hs (math 12% / reading 37%, grade F, #150 of 447 statewide, top 48%, 385 students, 0% FRL) — zoned schools average 0% FRL vs 60% district-wide (60 pts lower); this property's tenant base skews higher-income than the district average.
- Market conditions: 138 active listings in the ZIP; 10 units permitted in Haskell County in 2024 (0 in 5+ unit buildings).
Forward outlook
- In year one you build about $4k of equity ($684 loan paydown + $4k appreciation (3.8% local appreciation)).
- Haskell County population projected at -10% by 2050 — secular population decline; favor cash flow + early exit over multi-decade hold.
- At projected returns (3.8% appreciation + 3.0% rent growth), your $28k cash investment doubles in ~4 years — after that, you're playing with house money.
- By year 8, paydown + projected appreciation supports a ~$33k cash-out refi (75% LTV) — recoverable capital for the next deal without selling this one.
Negotiation context
- It's been on market 104 days — a 9% lower offer ($90k) is reasonable based on typical stale-listing flexibility.
- Current owner paid $72k; 38% above their basis — modest negotiation headroom, anchor on the comps not their cost.
Risks & watch-outs
- Climate carrying-cost: moderate wildfire risk; extreme-heat days projected 7→19/yr by 2055 (HVAC capex compounding) — expect insurance premiums to compound above CPI over the hold.
Questions for the listing agent
- It's been on market 104 days. Have you received any prior offers? Is the seller open to a 9% concession, seller financing, or rate buy-down credit?
- Built in 1968 — when were the roof, HVAC, electrical panel, plumbing, and water heater last replaced?
- Why hasn't it sold? Are there any deal-killer items the seller is aware of (foundation, flood, title, zoning, code violations)?
- Is there a deadline driving the sale (1031 exchange, divorce, estate, relocation)? That informs how much negotiation room exists.
- Schools are F-rated, which usually means shorter tenancies and higher turnover. Who's the typical renter profile here, and what's been the actual vacancy rate?
- What's the average days-on-market for RENTAL listings here right now (not sales)? A rising rental-DOM trend means longer vacancies and softer asking-rent achievability than the comps imply.
- What's the recent tenant-quality profile in this submarket — average credit score on applications, eviction rate, late-payment / NSF rate, and stable-employment percentage? A property-management company in the area should have these aggregated.
- How much new for-sale + rental construction is in the pipeline within 1–3 miles? Heavy new supply typically softens prices + rents 12–24 months out; constrained supply supports both.
Investment metrics
- 1% rule
- 1.01% ✓
- Cap rate
- 8.61%
- Cash-on-cash
- 8.28%
- DSCR
- 1.37
- GRM
- 8.3
CMA / ARV
- ARV (on-the-fly)
- $126,144
- Comps found
- 7
Show comp detail 7 sales within ~0.75 mi
| Address | Dist | Beds/Ba | Sqft | Sold | Price | $/sf | Match |
|---|---|---|---|---|---|---|---|
| 303 NW J St | 0.21mi | 3/2.0 | 1,215 (+4%) | 5mo | $128,000 | $105 | 75 |
| 1101 NW 9th St | 0.28mi | 3/1.5 | 1,248 (+7%) | 2mo | $149,000 | $119 | 72 |
| 503 NW K St | 0.16mi | 3/2.0 | 1,300 (+11%) | 16mo | $140,000 | $108 | 56 |
| 503 NE 4th St | 0.62mi | 3/1.5 | 1,118 (-4%) | 9mo | $104,900 | $94 | 55 |
| 1102 NW H. St | 0.34mi | 2/1.0 (-1) | 1,053 (-10%) | 20mo | $120,000 | $114 | 46 |
| 504 NE Tilden St | 0.74mi | 3/1.0 | 1,128 (-3%) | 23mo | $137,500 | $122 | 41 |
| 311 N Broadway St | 0.48mi | 2/1.0 (-1) | 1,008 (-14%) | 11mo | $48,500 | $48 | 40 |
Match score weights: distance 35% · size 25% · config 20% · recency 20%. Top-matched comps best support the ARV.
Projected returns pro-forma
3.83% appreciation · 3.0% rent growth · sell at horizon
- IRR
- 17.2%
- Equity multiple
- 2.03×
- Total profit
- $28,479
- Equity at exit
- $49,214
- IRR
- 18.1%
- Equity multiple
- 3.85×
- Total profit
- $79,007
- Equity at exit
- $79,721
Cash invested: $27,720 (down + closing). Projections, not guarantees.
Landlord ↔ Tenant lean methodology
- Overall (STATE)
- 83 Strongly Landlord-Friendly
- State Oklahoma
- 83 Strongly Landlord-Friendly · R+20
- County
- — inherits STATE
- City
- — inherits STATE
ZIP-level market 74462
- Home prices YoY
- 1.9%
- Active inventory
- 138
- Price-to-rent
- 8.3×
Monthly cashflow live
- Estimated rent
- $996 medium interval (Pro) →
- Mortgage (P&I)
- −$519
- Tax from tax record
- −$35 /mo · $420/yr
- Insurance
- −$41
- HOA
- −$0
- Vacancy / Maint / Mgmt
- −$209
- Net cashflow
- $191
Break-even live
Sensitivity live
| Price | -10% $247 | -5% $219 | +0% $191 | +5% $163 | +10% $135 |
|---|---|---|---|---|---|
| Rent | -10% $113 | -5% $152 | +0% $191 | +5% $230 | +10% $270 |
| Rate | -1.0pp $241 | -0.5pp $216 | base $191 | +0.5pp $166 | +1.0pp $139 |
UW: 25.0% down · 7.5% · 30yr · 1.5% tax · 5.0% vac · 8.0% maint · 8.0% mgmt
Financing live
Cash to close
- Down payment
- $24,750
- Closing costs
- $2,970
- Reserves months
- —
- Total cash needed
- —
Loan-product check · same deal, 3 products live
Conventional
25% down · 7.5% · 30yr
- Down + closing
- —
- Monthly P&I
- —
- Monthly cashflow
- —
- DSCR
- —
- Eligible?
- —
Personal DTI + credit; lowest rate.
DSCR
20% down · 8.5% · 30yr
- Down + closing
- —
- Monthly P&I
- —
- Monthly cashflow
- —
- DSCR
- —
- Eligible?
- —
No personal income docs; deal must DSCR.
Hard money
10% down · 12.0% · 12mo
- Down + closing
- —
- Monthly P&I
- —
- Monthly cashflow
- —
- DSCR
- —
- Eligible?
- —
Short-term bridge; refi at stabilization.
Listing history 10 events
-
2026-06-02days on market $99,000 Active 104 DOM
-
2026-06-01days on market $99,000 Active 103 DOM
-
2026-05-31days on market $99,000 Active 102 DOM
-
2026-05-03price $99,000
-
2026-04-11price $115,001
-
2026-04-06price $134,901
-
2026-03-09price $137,400
-
2026-02-16$139,900 Active
-
2009-04-21soldstatus $72,000
-
2007-06-26soldstatus $72,000
ⓘ Source: listings_history table (triggers on properties + properties_extension) + one-shot
backfill from property_details.listing_events for pre-trigger history.
Tax reassessment forecast OK · Resets to sale price
- Current annual tax
- $420 · $35/mo
- Projected year-2 tax
- $891 · $74/mo
- Expected delta
- +$471/yr (+$39/mo · 112.1%)
ⓘ Screening estimate from a state-policy table — verify with the county assessor before closing.
Climate risk First Street
- Flood 1/10 Low FEMA zone X (unshaded) · 0% chance over 30 yrs
- Wildfire 5/10 Major
- Heat 6/10 Major 7 d/yr ≥111°F today · 19 d/yr by 30 yrs out
- Wind 3/10 Moderate 7% chance of damaging wind over 30 yrs
- Air quality 2/10 Low 1 unhealthy d/yr today · 1 by 30 yrs out
Nearby sold comps map
Loading sold comps map…
Walkable amenities ~0.75 mi
Loading nearby amenities…
Taxation est. · year 1
- Rental income
- $11,948
- − Mortgage interest
- −$5,546
- − Property taxes
- −$420
- − Insurance
- −$495
- − Repairs & maintenance
- −$956
- − Management
- −$956
- − Depreciation
- −$2,880
- Taxable income
- $696
- Est. tax owed @ 24.0%
- −$167
- After-tax cash flow
- $2,127/yr
For passive investors: Depreciation is non-cash, so a rental often shows a tax loss while cash-flowing — sheltering income. Rental losses are passive: they offset passive income freely, and up to $25,000/yr can offset ordinary (W-2) income if you actively participate and your MAGI is under $100k (phasing out to $0 by $150k); unused losses carry forward. On sale, claimed depreciation is recaptured at up to 25%, and gains may owe capital-gains tax (a 1031 exchange can defer both). Figures are a year-1 estimate at your 24.0% rate — not tax advice; consult a CPA.
Schools (NCES district)
- District
- Stigler
- NCES district ID
- 4028650
- Math proficiency
- 20% ▼ -13.00%
- Reading proficiency
- 25% ▼ -6.00%
- Median HH income
- $37,379
- Composite
- 18.77/100
- National rank
- #8874
- State rank
- #151 of 270 in OK
Livability — Stigler
- Score
- 65/100
- State rank
- #159
- US rank
- #13589
Category grades
Schools grade is shown separately in the Schools card above.
Census & demographics
- Census place
- Stigler, OK
- Population (ZIP)
- 7,096
Population outlook (Haskell County) Hauer SSP2
- Today (2025)
- 12,670 people
- By 2030
- 12,462 · -1.6%
- By 2040
- 11,962 · -5.6%
- By 2050
- 11,354 · -10.4%
- By 2075
- 9,621 · -24.1%
- By 2100
- 7,478 · -41.0%
Race, ethnicity, and origin ACS 2023
- Neighborhood character
- Predominantly White (70%)
- Race & ethnicity
- White 70% Native American 13% Two or more races 13% Hispanic / Latino 6%
- Hispanic origin (detail)
- Mexican 6%
- Common ancestry
- Scotch-Irish 1% Slovak 1% Italian 1%
- Foreign-born
- 3% · Canada
- Languages at home
- 95% English-only · Spanish 4% Russian/Polish/Slavic 1%
Political lean MEDSL · Haskell
- 2024 margin
- Solid R (+69.7) · D 14.6% · R 84.2% · Other 1.3%
- 2008→2024 swing
- -32.6pp toward R · 2008: -37.0pp · 2024: -69.7pp
- All cycles
- 2024: R+69.7 2020: R+67.5 2016: R+59.5 2012: R+44.6 2008: R+37.0
Not yet ingested
- Civics
- —
Market trends
- HPI YoY
- ▲ 3.83%
- Current HPI
- 201.74
- Rent YoY
- —
- Metro
- —
- State GDP YoY
- ▲ 1.55%
- F500 in state
- 6
Industry mix (Fortune 500 HQ in OK)
| Industry | F500 HQs | Revenue |
|---|---|---|
| Energy | 3 | $48B |
|
||
Price history
+37.5% since first listed7 events — show timeline
- 2026-05-03 Price Changed $99,000 WRVBOR
- 2026-04-11 Price Changed $115,001 WRVBOR
- 2026-04-06 Price Changed $134,901 WRVBOR
- 2026-03-09 Price Changed $137,400 WRVBOR
- 2026-02-16 Listed $139,900 WRVBOR
- 2009-04-21 Sold (Public Records) $72,000 Public Records
- 2007-06-26 Sold (Public Records) $72,000 Public Records
Property tax history
-2.1%/yrLatest (2025): $420 · +0.0% YoY. Source: county tax records.
Cash-flow waterfall
monthlySold comps — $/sqft
last 12 mo · ≤1 miLoading sold comps…