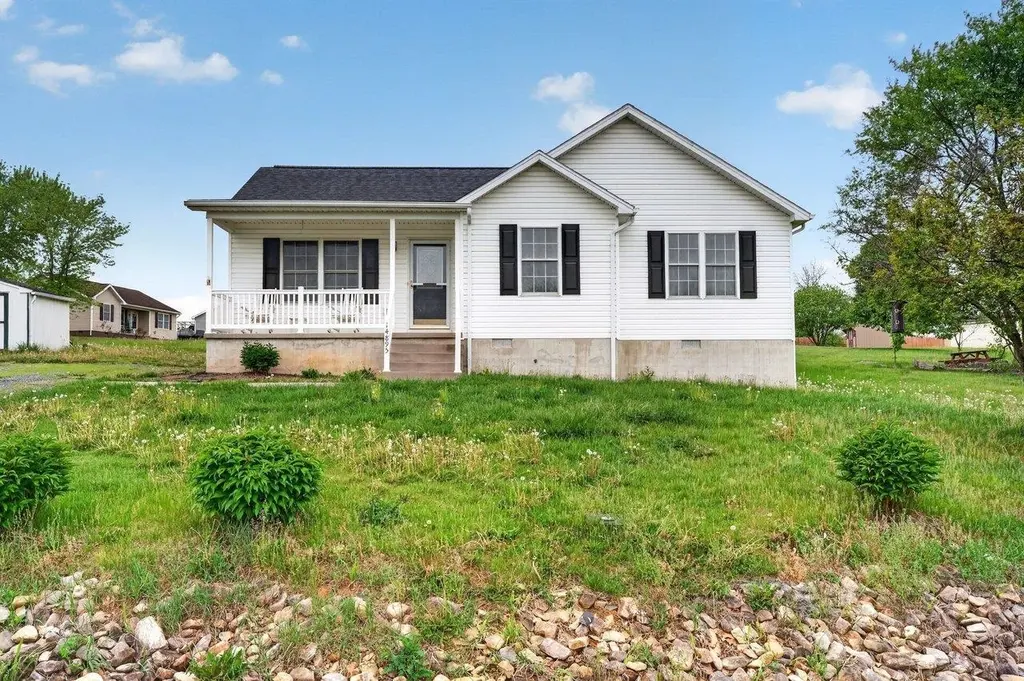
14895 Woodcreek Ln · Timberville, VA
Flood risk 1/10 · Minimal
- FEMA flood zone
- X (unshaded)
- Chance of flooding over 30 yrs
- 0.0%
- Est. flood insurance / yr
- $507 – $1,088
Fire risk 4/10 · Minor
- Est. fire insurance / yr
- $666 – $1,236
Heat risk 5/10 · Moderate
- Hot days now (above 101°F)
- 7 days/yr
- Hot days in 30 yrs
- 18 days/yr
Wind risk 2/10 · Minimal
- Chance of severe wind over 30 yrs
- 1.0%
Air-quality risk 1/10 · Minimal
- Unhealthy air days now
- 0 days/yr
- Unhealthy air days in 30 yrs
- 0 days/yr
Risk factors via First Street. Map © Google.
Why this score? — see what drove the D- grade
The composite is a weighted blend of 9 inputs, each scored 0–100. Each bar is that input's sub-score; the figure is the points it added to the 100-point composite (weight × sub-score).
- ARV discount +12.7/15.0
- Cash flow +7.9/30.0
- Schools +4.8/10.0
- Livability +3.4/5.0
- Rent growth +2.5/5.0
- Condition / age +2.5/5.0
- DSCR +1.9/10.0
- 1% rule +1.4/10.0
- Appreciation +0.0/10.0
$250,000
🖨 Deal sheet (PDF) 📄 Offer letter ✓ Due diligence
Listing remarks MLS
Gorgeous, one owner home!! The owner has taken great care of this 3 bedroom 2 bathroom home. Enjoy updated hardwood floors in the kitchen. When the warm weather arrives, grab the rocking chair and move outside on the front porch. Until then enjoy the finished sunroom with recessed lighting and relax in peace. The master bedroom features a walk in closet and attached master bathroom. All three bedrooms recently painted. HVAC has a brand new compressor!! All of this at an affordable price on a cornet lot.
Key facts
- New hvac
- Storage buildings
- Corner lot
Tags
Property features AI
Exterior
- Utilities: Public water; Public sewer; Cable available
- Home design: Detached single-family home; One story
- Construction: Built with stick-built construction; Block foundation
- Exterior features: Lot approximately 0.36 acres
Interior
- Bathrooms: 2 full bathrooms
- Heating & cooling: Central heating and heat pump; Central air conditioning
- Interior features: Primary bedroom on the main floor
Neighborhood map
What this means for you Summary
Snapshot
- This is a 3-bed/2.0-bath single-family listed at $250k.
Deal economics
- At list price, monthly cash flow is $-269 ($-3k/yr) — negative.
- To cash-flow at today's rent, offer at most $202k (19.0% below list).
- To meet the 1% rule (rent ≥ 1% of price), the offer needs to be $160k (36.2% below list).
- Recommended offer: $160k (36.2% below list) — sets the bar for 1% rule.
Location & tenants
- Location reads 67/100 on livability (#283 in VA) — a middle-class / working-renter tenant base. Strengths: crime A+, cost of living A+, housing A+; Watch: amenities F, commute F, health & safety D-.
- Rockingham County Public School District (rural): math 47% / reading 64% proficiency, ranked #77 of 131 in VA (top 59%) — acceptable for families but not a draw, mixed tenant base, ~2y average lease.
- Zoned schools: Plains Elementary (math 27% / reading 42%, grade F, #966 of 1,108 statewide, top 89%, 456 students, 65% FRL); J. Frank Hillyard Middle (math 51% / reading 59%, grade B-, #189 of 342 statewide, top 56%, 665 students, 49% FRL); Broadway High (math 68% / reading 79%, grade B+, #124 of 319 statewide, top 40%, 923 students, 42% FRL) — zoned schools average 52% FRL vs 32% district-wide (21 pts higher); higher-poverty schools than district average — tighter screening recommended.
- Market conditions: 22 active listings in the ZIP; 1 comparable units currently listed for rent nearby; 683 units permitted in Rockingham County in 2024 (0 in 5+ unit buildings).
Forward outlook
- Local home prices are declining (-3.0%/yr); year-one equity from $2k of loan paydown is wiped out by about $8k of value loss. Plan a longer hold.
- Rockingham County population projected at +6% by 2050 — modest demand growth; plan on rents tracking national, not racing it.
Negotiation context
- Only 5 days on market — expect competitive offers; lowballing is unlikely to land.
- 2 sale attempts since 6y ago with the ask held roughly flat each time — persistent listings suggest the price (not the market) is what's stuck; bring a comps-based counter.
Risks & watch-outs
- Climate carrying-cost: extreme-heat days projected 7→18/yr by 2055 (HVAC capex compounding) — expect insurance premiums to compound above CPI over the hold.
Questions for the listing agent
- What do current leases actually rent for vs. the listed asking? Can we see a recent rent roll and the last 12 months of T-12 income?
- Is there a deadline driving the sale (1031 exchange, divorce, estate, relocation)? That informs how much negotiation room exists.
- The area grade is low — what's the realistic commute time and amenity access for the typical tenant pool here? Any planned neighborhood developments (good or bad) we should know about?
- What's the average days-on-market for RENTAL listings here right now (not sales)? A rising rental-DOM trend means longer vacancies and softer asking-rent achievability than the comps imply.
- What's the recent tenant-quality profile in this submarket — average credit score on applications, eviction rate, late-payment / NSF rate, and stable-employment percentage? A property-management company in the area should have these aggregated.
- How much new for-sale + rental construction is in the pipeline within 1–3 miles? Heavy new supply typically softens prices + rents 12–24 months out; constrained supply supports both.
Investment metrics
- 1% rule
- 0.64% ✗
- Cap rate
- 5.00%
- Cash-on-cash
- -4.61%
- DSCR
- 0.79
- GRM
- 13.1
CMA / ARV
- ARV (median comp)
- $282,571
- List price
- $250,000
- Delta
- -11.53%
- Verdict
- UNDERPRICED
- Comps
- 20 within 1.0 mi
Show comp detail 11 sales within ~0.75 mi
| Address | Dist | Beds/Ba | Sqft | Sold | Price | $/sf | Match |
|---|---|---|---|---|---|---|---|
| 5079 Orchard Dr | 0.14mi | 3/2.0 | 1,176 (+5%) | 3mo | $282,000 | $240 | 83 |
| 14960 Woodcreek Ln | 0.05mi | 3/2.0 | 1,160 (+4%) | 14mo | $315,000 | $272 | 80 |
| 14975 Woodcreek Ln | 0.04mi | 3/2.0 | 1,196 (+7%) | 9mo | $286,000 | $239 | 79 |
| 181 Bellevue St | 0.53mi | 3/1.0 | 1,156 (+3%) | 2mo | $243,000 | $210 | 64 |
| 120 Bellevue St | 0.42mi | 3/1.0 | 1,160 (+4%) | 14mo | $250,000 | $216 | 59 |
| 145 Memorial Park Dr | 0.65mi | 3/2.0 | 1,120 (+0%) | 15mo | $300,000 | $268 | 57 |
| 457 North Main St | 0.51mi | 3/1.0 | 1,286 (+15%) | 5mo | $254,000 | $198 | 44 |
| 296 Cherry St | 0.46mi | 3/1.5 | 980 (-12%) | 20mo | $260,000 | $265 | 40 |
| 153 Riverside Dr E | 0.52mi | 3/2.0 | 992 (-11%) | 23mo | $265,000 | $267 | 38 |
| 300 Montevideo St | 0.52mi | 3/2.0 | 1,278 (+14%) | 20mo | $277,000 | $217 | 35 |
| 317 2nd Ave | 0.74mi | 3/2.0 | 1,223 (+9%) | 22mo | $210,000 | $172 | 32 |
Match score weights: distance 35% · size 25% · config 20% · recency 20%. Top-matched comps best support the ARV.
Projected returns pro-forma
-3.0% appreciation · 3.0% rent growth · sell at horizon
- IRR
- -24.2%
- Equity multiple
- 0.18×
- Total profit
- $-57,748
- Equity at exit
- $37,276
- IRR
- -19.6%
- Equity multiple
- -0.04×
- Total profit
- $-72,753
- Equity at exit
- $21,615
Cash invested: $70,000 (down + closing). Projections, not guarantees.
Landlord ↔ Tenant lean methodology
- Overall (STATE)
- 55 Moderately Landlord-Leaning
- State Virginia
- 55 Moderately Landlord-Leaning · D+2
- County
- — inherits STATE
- City
- — inherits STATE
ZIP-level market 22853
- Home prices YoY
- -22.6%
- Active inventory
- 22
- Price-to-rent
- 13.1×
Monthly cashflow live
- Estimated rent
- $1,595 medium interval (Pro) →
- Mortgage (P&I)
- −$1,311
- Tax from tax record
- −$114 /mo · $1,367/yr
- Insurance
- −$104
- HOA
- −$0
- Vacancy / Maint / Mgmt
- −$335
- Net cashflow
- $-269
Break-even live
Sensitivity live
| Price | -10% $-128 | -5% $-198 | +0% $-269 | +5% $-340 | +10% $-411 |
|---|---|---|---|---|---|
| Rent | -10% $-395 | -5% $-332 | +0% $-269 | +5% $-206 | +10% $-143 |
| Rate | -1.0pp $-143 | -0.5pp $-206 | base $-269 | +0.5pp $-334 | +1.0pp $-400 |
UW: 25.0% down · 7.5% · 30yr · 1.5% tax · 5.0% vac · 8.0% maint · 8.0% mgmt
Financing live
Cash to close
- Down payment
- $62,500
- Closing costs
- $7,500
- Reserves months
- —
- Total cash needed
- —
Loan-product check · same deal, 3 products live
Conventional
25% down · 7.5% · 30yr
- Down + closing
- —
- Monthly P&I
- —
- Monthly cashflow
- —
- DSCR
- —
- Eligible?
- —
Personal DTI + credit; lowest rate.
DSCR
20% down · 8.5% · 30yr
- Down + closing
- —
- Monthly P&I
- —
- Monthly cashflow
- —
- DSCR
- —
- Eligible?
- —
No personal income docs; deal must DSCR.
Hard money
10% down · 12.0% · 12mo
- Down + closing
- —
- Monthly P&I
- —
- Monthly cashflow
- —
- DSCR
- —
- Eligible?
- —
Short-term bridge; refi at stabilization.
Rent comps 1 comps
| Address | Beds | Baths | Sqft | Rent | $/sqft | DOM | Units | Dist |
|---|---|---|---|---|---|---|---|---|
| 5473 Orchard Dr Timberville, VA | 2.0 | 1.0 | 850 | $1,595 | $1.88 | 23d | 1 | 0.43mi |
Listing history 6 events
-
2026-05-06status Pending 340-char remark
-
2026-05-01$250,000 Active 340-char remark
-
2020-05-15soldstatus $192,000 510-char remark
Show marketing remark (510 chars)
Gorgeous, one owner home!! The owner has taken great care of this 3 bedroom 2 bathroom home. Enjoy updated hardwood floors in the kitchen. When the warm weather arrives, grab the rocking chair and move outside on the front porch. Until then enjoy the finished sunroom with recessed lighting and relax in peace. The master bedroom features a walk in closet and attached master bathroom. All three bedrooms recently painted. HVAC has a brand new compressor!! All of this at an affordable price on a cornet lot.
-
2020-05-15soldstatus $192,000
Show marketing remark (510 chars)
Gorgeous, one owner home!! The owner has taken great care of this 3 bedroom 2 bathroom home. Enjoy updated hardwood floors in the kitchen. When the warm weather arrives, grab the rocking chair and move outside on the front porch. Until then enjoy the finished sunroom with recessed lighting and relax in peace. The master bedroom features a walk in closet and attached master bathroom. All three bedrooms recently painted. HVAC has a brand new compressor!! All of this at an affordable price on a cornet lot.
-
2020-02-17$194,900 510-char remark
Show marketing remark (510 chars)
Gorgeous, one owner home!! The owner has taken great care of this 3 bedroom 2 bathroom home. Enjoy updated hardwood floors in the kitchen. When the warm weather arrives, grab the rocking chair and move outside on the front porch. Until then enjoy the finished sunroom with recessed lighting and relax in peace. The master bedroom features a walk in closet and attached master bathroom. All three bedrooms recently painted. HVAC has a brand new compressor!! All of this at an affordable price on a cornet lot.
-
2002-06-13soldstatus $39,000
ⓘ Source: listings_history table (triggers on properties + properties_extension) + one-shot
backfill from property_details.listing_events for pre-trigger history.
Tax reassessment forecast VA · Resets to sale price
- Current annual tax
- $1,367 · $114/mo
- Projected year-2 tax
- $2,050 · $171/mo
- Expected delta
- +$683/yr (+$57/mo · 49.9%)
ⓘ Screening estimate from a state-policy table — verify with the county assessor before closing.
Climate risk First Street
- Flood 1/10 Low FEMA zone X (unshaded) · 0% chance over 30 yrs
- Wildfire 4/10 Moderate
- Heat 5/10 Major 7 d/yr ≥101°F today · 18 d/yr by 30 yrs out
- Wind 2/10 Low 100% chance of damaging wind over 30 yrs
- Air quality 1/10 Low 0 unhealthy d/yr today · 0 by 30 yrs out
Nearby sold comps map
Loading sold comps map…
Walkable amenities ~0.75 mi
Loading nearby amenities…
Taxation est. · year 1
- Rental income
- $19,140
- − Mortgage interest
- −$14,004
- − Property taxes
- −$1,367
- − Insurance
- −$1,250
- − Repairs & maintenance
- −$1,531
- − Management
- −$1,531
- − Depreciation
- −$7,273
- Taxable loss
- −$7,816
- Est. tax savings @ 24.0%
- +$1,876
- After-tax cash flow
- $-1,353/yr
For passive investors: Depreciation is non-cash, so a rental often shows a tax loss while cash-flowing — sheltering income. Rental losses are passive: they offset passive income freely, and up to $25,000/yr can offset ordinary (W-2) income if you actively participate and your MAGI is under $100k (phasing out to $0 by $150k); unused losses carry forward. On sale, claimed depreciation is recaptured at up to 25%, and gains may owe capital-gains tax (a 1031 exchange can defer both). Figures are a year-1 estimate at your 24.0% rate — not tax advice; consult a CPA.
Schools (NCES district)
- District
- Rockingham County Public School District
- NCES district ID
- 5103390
- Math proficiency
- 47% ▼ -36.00%
- Reading proficiency
- 64% ▼ -12.00%
- Median HH income
- $53,178
- Composite
- 47.58/100
- National rank
- #2264
- State rank
- #77 of 131 in VA
Livability — Timberville
- Score
- 67/100
- State rank
- #283
- US rank
- #10125
Category grades
Schools grade is shown separately in the Schools card above.
Census & demographics
- Census place
- Timberville, VA
- Population (ZIP)
- 4,876
Population outlook (Rockingham County) Hauer SSP2
- Today (2025)
- 83,435 people
- By 2030
- 85,223 · +2.1%
- By 2040
- 87,667 · +5.1%
- By 2050
- 88,550 · +6.1%
- By 2075
- 90,331 · +8.3%
- By 2100
- 85,122 · +2.0%
Race, ethnicity, and origin ACS 2023
- Neighborhood character
- Predominantly White (87%)
- Race & ethnicity
- White 87% Hispanic / Latino 10% Two or more races 5% Black 1%
- Hispanic origin (detail)
- Mexican 5% Puerto Rican 2%
- Common ancestry
- Serbian 6% Italian 2% Slovak 1%
- Foreign-born
- 5% · Canada
- Languages at home
- 87% English-only · Spanish 12% Russian/Polish/Slavic 1%
Political lean MEDSL · Rockingham
- 2024 margin
- Solid R (+37.0) · D 30.9% · R 68.0% · Other 1.1%
- 2008→2024 swing
- -1.0pp toward R · 2008: -36.0pp · 2024: -37.0pp
- All cycles
- 2024: R+37.0 2020: R+40.4 2016: R+43.5 2012: R+40.6 2008: R+36.0
Not yet ingested
- Civics
- —
Market trends
- HPI YoY
- ▼ -55.44%
- Current HPI
- 189.9975
- Rent YoY
- —
- Metro
- —
- State GDP YoY
- ▲ 2.40%
- F500 in state
- 50
Industry mix (Fortune 500 HQ in VA)
| Industry | F500 HQs | Revenue |
|---|---|---|
| Aerospace / Defense | 4 | $236B |
|
||
| Technology / Defense | 3 | $32B |
|
||
| Financial Services | 2 | $176B |
|
||
| Utilities | 2 | $27B |
|
||
| Insurance | 2 | $25B |
|
||
| Technology | 2 | $15B |
|
||
Price history
+552.3% since first listed7 events — show timeline
- 2026-06-17 Sold (MLS) $254,400 HRAR
- 2026-05-06 Pending — HRAR
- 2026-05-01 Listed $250,000 HRAR
- 2020-05-15 Sold (Public Records) $192,000 Public Records
- 2020-05-15 Sold (MLS) $192,000 HRAR
- 2020-02-17 Listed $194,900 HRAR
- 2002-06-13 Sold (Public Records) $39,000 Public Records
Property tax history
+4.8%/yrLatest (2025): $1,367 · +0.0% YoY. Source: county tax records.
Cash-flow waterfall
monthlySold comps — $/sqft
last 12 mo · ≤1 miLoading sold comps…