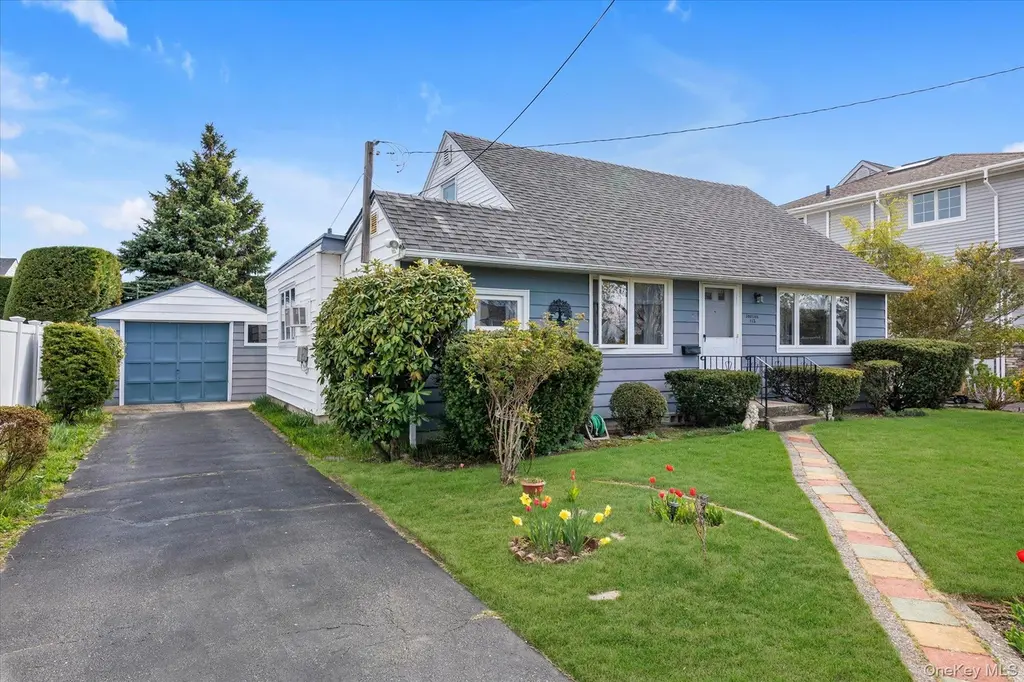
112 Harrison Pl · Massapequa, NY
Flood risk 9/10 · Severe
- FEMA flood zone
- AE
- Chance of flooding over 30 yrs
- 0.99%
- Est. flood insurance / yr
- $1,737 – $8,500
Fire risk 1/10 · Minimal
- Est. fire insurance / yr
- $691 – $1,283
Heat risk 6/10 · Moderate
- Hot days now (above 94°F)
- 7 days/yr
- Hot days in 30 yrs
- 17 days/yr
Wind risk 6/10 · Moderate
- Chance of severe wind over 30 yrs
- 75.0%
Air-quality risk 4/10 · Minor
- Unhealthy air days now
- 3 days/yr
- Unhealthy air days in 30 yrs
- 5 days/yr
Risk factors via First Street. Map © Google.
Why this score? — see what drove the C grade
The composite is a weighted blend of 9 inputs, each scored 0–100. Each bar is that input's sub-score; the figure is the points it added to the 100-point composite (weight × sub-score).
- Cash flow +15.9/30.0
- ARV discount +15.0/15.0
- Schools +7.4/10.0
- DSCR +4.9/10.0
- Livability +4.1/5.0
- 1% rule +3.5/10.0
- Rent growth +2.5/5.0
- Condition / age +2.5/5.0
- Appreciation +0.0/10.0
$649,000
🖨 Deal sheet 📄 Offer letter ✓ Due diligence
Listing remarks MLS
Welcome to your home in Massapequa Shores! Nestled on a beautiful, quiet residential street, this expanded cape offers incredible space and versatility on a generous 60x100 lot. Proudly owned by the original owners, this home has been well-maintained and lovingly cared-for. The first floor features three bedrooms, a full hallway bathroom, and a thoughtfully designed extension with a powder room and separate rear egress—ideal for extended family, guests, or flexible living arrangements. The extension also offers the potential for a sixth bedroom or private suite. The second floor includes two additional bedrooms and a full bathroom, providing ample room for comfortable living. The first floor was fully renovated following Superstorm Sandy, with updates including a newer boiler, upgraded electric service, flooring, and a new electrical panel. Conveniently located near shopping, dining, and everyday amenities, this home presents a fantastic opportunity for first-time buyers or those looking to establish themselves in the highly sought-after Massapequa Shores community.
Key facts
- Separate rear egress
- Fully renovated
- Generous lot
Tags
Neighborhood map
What this means for you Summary
Snapshot
- This is a 5-bed/2.5-bath single-family listed at $649k.
Deal economics
- At list price, monthly cash flow is $-121 ($-1k/yr) — negative.
- To cash-flow at today's rent, offer at most $628k (3.3% below list).
- To meet the 1% rule (rent ≥ 1% of price), the offer needs to be $550k (15.3% below list).
- Recommended offer: $550k (15.3% below list) — sets the bar for 1% rule.
- Cap rate 6.9% vs local median 2.5% in Massapequa — top-decile yield for the area; either an underpriced asset or a hidden risk that comps aren't pricing in. Stress-test before assuming the spread holds.
Location & tenants
- Location reads 82/100 on livability (#82 in NY, #1,242 nationally) — a professional / high-income tenant draw. Strengths: schools A+, commute A+, employment A+; Watch: amenities D, cost of living F.
- Massapequa Union Free School District (suburban): math 76% / reading 83% proficiency, ranked #39 of 590 in NY (top 7%) — strong family-tenant draw, lease renewals of 3-5y typical; only 4% free/reduced lunch — higher-income household profile.
- Market conditions: 267 active listings in the ZIP; 1 comparable units currently listed for rent nearby; 824 units permitted in Nassau County in 2024 (153 in 5+ unit buildings).
Forward outlook
- Local home prices are declining (-3.0%/yr); year-one equity from $4k of loan paydown is wiped out by about $19k of value loss. Plan a longer hold.
- Nassau County population projected at +7% by 2050 — modest demand growth; plan on rents tracking national, not racing it.
Negotiation context
- It's been on market 23 days — a 2% lower offer ($639k) is reasonable based on typical stale-listing flexibility.
Risks & watch-outs
- Watch-outs: flood insurance adds $427/mo; built in 1951 — expect roof / HVAC / electrical / plumbing capex.
- Climate carrying-cost: in FEMA flood zone AE (mandatory federal flood insurance); major wind risk, 75% chance of damaging wind over 30y; extreme-heat days projected 7→17/yr by 2055 (HVAC capex compounding) — expect insurance premiums to compound above CPI over the hold.
Questions for the listing agent
- What do current leases actually rent for vs. the listed asking? Can we see a recent rent roll and the last 12 months of T-12 income?
- Built in 1951 — when were the roof, HVAC, electrical panel, plumbing, and water heater last replaced?
- What's the actual annual flood-insurance premium (NFIP or private), and is the property in a SFHA with mandatory coverage?
- Is there a deadline driving the sale (1031 exchange, divorce, estate, relocation)? That informs how much negotiation room exists.
- Schools are A-rated — typically a magnet for longer-tenancy family renters. What's the average tenant stay here, and is there a school-zone premium baked into asking?
- What's the average days-on-market for RENTAL listings here right now (not sales)? A rising rental-DOM trend means longer vacancies and softer asking-rent achievability than the comps imply.
- What's the recent tenant-quality profile in this submarket — average credit score on applications, eviction rate, late-payment / NSF rate, and stable-employment percentage? A property-management company in the area should have these aggregated.
- How much new for-sale + rental construction is in the pipeline within 1–3 miles? Heavy new supply typically softens prices + rents 12–24 months out; constrained supply supports both.
Investment metrics
- 1% rule
- 0.85% ✗
- Cap rate
- 6.86%
- Cash-on-cash
- 2.02%
- DSCR
- 1.09
- GRM
- 9.8
CMA / ARV
- ARV (median comp)
- $856,070
- List price
- $649,000
- Delta
- -24.19%
- Verdict
- UNDERPRICED
- Comps
- 20 within 1.0 mi
Show comp detail 12 sales within ~0.75 mi
| Address | Dist | Beds/Ba | Sqft | Sold | Price | $/sf | Match |
|---|---|---|---|---|---|---|---|
| 3806 Tiana St | 0.60mi | 4/2.0 (-1) | 1,467 (-2%) | 0mo | $800,000 | $545 | 61 |
| 225 Seaford Ave | 0.18mi | 5/2.0 | 1,702 (+14%) | 10mo | $782,000 | $459 | 58 |
| 60 Cherry St | 0.65mi | 4/3.0 (-1) | 1,533 (+2%) | 2mo | $760,000 | $496 | 58 |
| 243 Seaford Ave | 0.17mi | 4/1.0 (-1) | 1,300 (-13%) | 4mo | $685,000 | $527 | 55 |
| 2346 S Seamans Neck Rd | 0.50mi | 4/2.0 (-1) | 1,488 (-1%) | 18mo | $642,000 | $431 | 54 |
| 45 Sycamore St | 0.61mi | 4/2.0 (-1) | 1,581 (+6%) | 8mo | $915,000 | $579 | 48 |
| 94 Alhambra Rd | 0.44mi | 4/2.0 (-1) | 1,316 (-12%) | 7mo | $765,000 | $581 | 47 |
| 14 Roxbury Ln | 0.44mi | 4/2.0 (-1) | 1,644 (+10%) | 18mo | $692,500 | $421 | 41 |
| 10 Frankel Rd | 0.73mi | 4/1.5 (-1) | 1,573 (+5%) | 10mo | $800,000 | $509 | 40 |
| 2325 Narraganset Ave | 0.72mi | 4/2.0 (-1) | 1,600 (+7%) | 12mo | $650,000 | $406 | 38 |
| 396 Seaford Ave | 0.75mi | 5/2.0 | 1,604 (+7%) | 18mo | $635,000 | $396 | 36 |
| 6 Fairview Rd W | 0.71mi | 4/2.0 (-1) | 1,677 (+12%) | 4mo | $900,000 | $537 | 36 |
Match score weights: distance 35% · size 25% · config 20% · recency 20%. Top-matched comps best support the ARV.
Projected returns pro-forma
-3.0% appreciation · 3.0% rent growth · sell at horizon
- IRR
- -17.6%
- Equity multiple
- 0.38×
- Total profit
- $-112,820
- Equity at exit
- $96,768
- IRR
- -9.7%
- Equity multiple
- 0.41×
- Total profit
- $-107,899
- Equity at exit
- $56,114
Cash invested: $181,720 (down + closing). Projections, not guarantees.
Landlord ↔ Tenant lean methodology
- Overall (STATE)
- 15 Strongly Tenant-Friendly
- State New York
- 15 Strongly Tenant-Friendly · D+10
- County
- — inherits STATE
- City
- — inherits STATE
ZIP-level market 11758
- Active inventory
- 267
- Price-to-rent
- 9.8×
Monthly cashflow live
- Estimated rent
- $5,500 medium interval (Pro) →
- Mortgage (P&I)
- −$3,403
- Tax from tax record
- −$366 /mo · $4,391/yr
- Insurance
- −$270
- Flood insurance flood zone
- −$427 /mo · $5,118/yr
- HOA
- −$0
- Vacancy / Maint / Mgmt
- −$1,155
- Net cashflow
- $-121
Break-even live
UW: 25.0% down · 7.5% · 30yr · 1.5% tax · 5.0% vac · 8.0% maint · 8.0% mgmt
Financing live
Cash to close
- Down payment
- $162,250
- Closing costs
- $19,470
- Reserves months
- —
- Total cash needed
- —
Loan-product check · same deal, 3 products live
Conventional
25% down · 7.5% · 30yr
- Down + closing
- —
- Monthly P&I
- —
- Monthly cashflow
- —
- DSCR
- —
- Eligible?
- —
Personal DTI + credit; lowest rate.
DSCR
20% down · 8.5% · 30yr
- Down + closing
- —
- Monthly P&I
- —
- Monthly cashflow
- —
- DSCR
- —
- Eligible?
- —
No personal income docs; deal must DSCR.
Hard money
10% down · 12.0% · 12mo
- Down + closing
- —
- Monthly P&I
- —
- Monthly cashflow
- —
- DSCR
- —
- Eligible?
- —
Short-term bridge; refi at stabilization.
Rent comps 1 comps
| Address | Beds | Baths | Sqft | Rent | $/sqft | DOM | Units | Dist |
|---|---|---|---|---|---|---|---|---|
| 3883 Franklin Ave Seaford, NY | 4.0 | 2.0 | 1593 | $5,500 | $3.45 | 43d | 1 | 1.29mi |
Listing history 2 events
-
2026-05-15status Pending 1088-char remark
Show marketing remark (1088 chars)
Welcome to your home in Massapequa Shores! Nestled on a beautiful, quiet residential street, this expanded cape offers incredible space and versatility on a generous 60x100 lot. Proudly owned by the original owners, this home has been well-maintained and lovingly cared-for. The first floor features three bedrooms, a full hallway bathroom, and a thoughtfully designed extension with a powder room and separate rear egress—ideal for extended family, guests, or flexible living arrangements. The extension also offers the potential for a sixth bedroom or private suite. The second floor includes two additional bedrooms and a full bathroom, providing ample room for comfortable living. The first floor was fully renovated following Superstorm Sandy, with updates including a newer boiler, upgraded electric service, flooring, and a new electrical panel. Conveniently located near shopping, dining, and everyday amenities, this home presents a fantastic opportunity for first-time buyers or those looking to establish themselves in the highly sought-after Massapequa Shores community.
-
2026-04-14$649,000 Active 1088-char remark
Show marketing remark (1088 chars)
Welcome to your home in Massapequa Shores! Nestled on a beautiful, quiet residential street, this expanded cape offers incredible space and versatility on a generous 60x100 lot. Proudly owned by the original owners, this home has been well-maintained and lovingly cared-for. The first floor features three bedrooms, a full hallway bathroom, and a thoughtfully designed extension with a powder room and separate rear egress—ideal for extended family, guests, or flexible living arrangements. The extension also offers the potential for a sixth bedroom or private suite. The second floor includes two additional bedrooms and a full bathroom, providing ample room for comfortable living. The first floor was fully renovated following Superstorm Sandy, with updates including a newer boiler, upgraded electric service, flooring, and a new electrical panel. Conveniently located near shopping, dining, and everyday amenities, this home presents a fantastic opportunity for first-time buyers or those looking to establish themselves in the highly sought-after Massapequa Shores community.
ⓘ Source: listings_history table (triggers on properties + properties_extension) + one-shot
backfill from property_details.listing_events for pre-trigger history.
Tax reassessment forecast NY · Partial reset (capped growth)
- Current annual tax
- $4,391 · $366/mo
- Projected year-2 tax
- $7,679 · $640/mo
- Expected delta
- +$3,289/yr (+$274/mo · 74.9%)
ⓘ Screening estimate from a state-policy table — verify with the county assessor before closing.
Climate risk First Street
- Flood 9/10 Extreme FEMA zone AE · 99% chance over 30 yrs
- Wildfire 1/10 Low
- Heat 6/10 Major 7 d/yr ≥94°F today · 17 d/yr by 30 yrs out
- Wind 6/10 Major 75% chance of damaging wind over 30 yrs
- Air quality 4/10 Moderate 3 unhealthy d/yr today · 5 by 30 yrs out
Nearby sold comps map
Loading sold comps map…
Walkable amenities ~0.75 mi
Loading nearby amenities…
Taxation est. · year 1
- Rental income
- $66,000
- − Mortgage interest
- −$36,354
- − Property taxes
- −$4,391
- − Insurance
- −$8,364
- − Repairs & maintenance
- −$5,280
- − Management
- −$5,280
- − Depreciation
- −$18,880
- Taxable loss
- −$12,548
- Est. tax savings @ 24.0%
- +$3,012
- After-tax cash flow
- $1,556/yr
For passive investors: Depreciation is non-cash, so a rental often shows a tax loss while cash-flowing — sheltering income. Rental losses are passive: they offset passive income freely, and up to $25,000/yr can offset ordinary (W-2) income if you actively participate and your MAGI is under $100k (phasing out to $0 by $150k); unused losses carry forward. On sale, claimed depreciation is recaptured at up to 25%, and gains may owe capital-gains tax (a 1031 exchange can defer both). Figures are a year-1 estimate at your 24.0% rate — not tax advice; consult a CPA.
Schools (NCES district)
- District
- Massapequa Union Free School District
- NCES district ID
- 3618630
- Math proficiency
- 76% ▼ -3.00%
- Reading proficiency
- 83% ▲ 12.00%
- Median HH income
- $116,173
- Composite
- 73.55/100
- National rank
- #178
- State rank
- #39 of 590 in NY
Livability — Massapequa
- Score
- 82/100
- State rank
- #82
- US rank
- #1242
Category grades
Schools grade is shown separately in the Schools card above.
Census & demographics
- Census place
- Massapequa, NY
- City population
- 54,741
- Population (ZIP)
- 54,741
Population outlook (Nassau County) Hauer SSP2
- Today (2025)
- 1,409,302 people
- By 2030
- 1,431,482 · +1.6%
- By 2040
- 1,471,607 · +4.4%
- By 2050
- 1,502,845 · +6.6%
- By 2075
- 1,575,403 · +11.8%
- By 2100
- 1,554,356 · +10.3%
Race, ethnicity, and origin ACS 2023
- Neighborhood character
- Predominantly White (80%)
- Race & ethnicity
- White 80% Hispanic / Latino 11% Two or more races 7% Black 6% Asian 2%
- Hispanic origin (detail)
- Puerto Rican 4% Dominican 1%
- Common ancestry
- Romanian 4% Scotch-Irish 2% Italian 1%
- Foreign-born
- 8% · Canada, China
- Languages at home
- 89% English-only · Spanish 6% Other Indo-European 3% Russian/Polish/Slavic 1%
Political lean MEDSL · Nassau
- 2024 margin
- Toss-up / Even · D 47.9% · R 52.1%
- 2008→2024 swing
- -12.6pp toward R · 2008: 8.4pp · 2024: -4.2pp
- All cycles
- 2024: R+4.2 2020: D+9.5 2016: D+5.3 2012: D+6.7 2008: D+8.4
Not yet ingested
- Civics
- —
Market trends
- HPI YoY
- ▼ -765.19%
- Current HPI
- 287.8085
- Rent YoY
- —
- Metro
- —
- State GDP YoY
- ▲ 2.60%
- F500 in state
- 92
Industry mix (Fortune 500 HQ in NY)
| Industry | F500 HQs | Revenue |
|---|---|---|
| Financial Services | 10 | $950B |
|
||
| Consumer Goods | 9 | $162B |
|
||
| Insurance | 4 | $225B |
|
||
| Telecommunications | 2 | $144B |
|
||
| Pharmaceuticals | 2 | $112B |
|
||
| Media / Entertainment | 2 | $69B |
|
||
Price history
2 events — show timeline
- 2026-05-15 Pending — OneKey® MLS as Distributed by MLS Grid
- 2026-04-14 Listed $649,000 OneKey® MLS as Distributed by MLS Grid
Property tax history
+1.4%/yrLatest (2024): $4,391 · -3.8% YoY. Source: county tax records.
Cash-flow waterfall
monthlySold comps — $/sqft
last 12 mo · ≤1 miLoading sold comps…