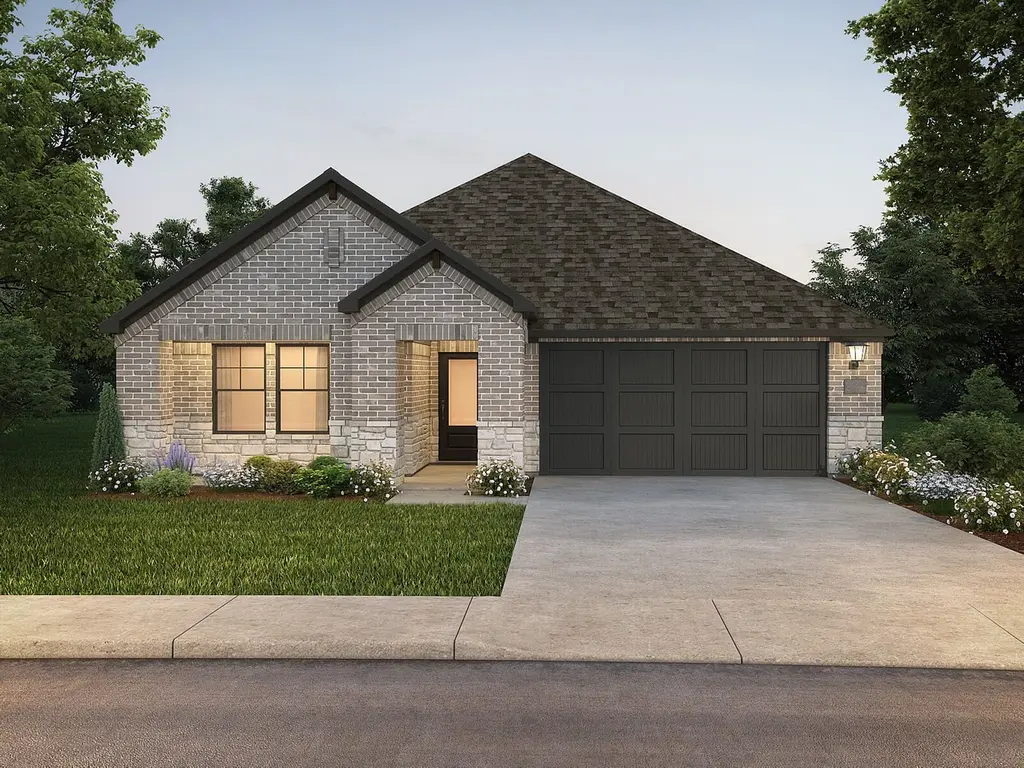
1009 Angel St · Josephine, TX
Flood risk 1/10 · Minimal
- FEMA flood zone
- X (unshaded)
- Chance of flooding over 30 yrs
- 0.0%
- Est. flood insurance / yr
- $507 – $1,088
Fire risk 3/10 · Minor
- Est. fire insurance / yr
- $1,222 – $2,270
Heat risk 8/10 · Major
- Hot days now (above 110°F)
- 7 days/yr
- Hot days in 30 yrs
- 23 days/yr
Wind risk 6/10 · Moderate
- Chance of severe wind over 30 yrs
- 27.0%
Air-quality risk 2/10 · Minimal
- Unhealthy air days now
- 1 days/yr
- Unhealthy air days in 30 yrs
- 1 days/yr
Risk factors via First Street. Map © Google.
Why this score? — see what drove the D- grade
The composite is a weighted blend of 9 inputs, each scored 0–100. Each bar is that input's sub-score; the figure is the points it added to the 100-point composite (weight × sub-score).
- Appreciation +10.0/10.0
- Cash flow +8.3/30.0
- Condition / age +4.0/5.0
- ARV discount +3.9/15.0
- Schools +3.2/10.0
- Livability +3.0/5.0
- 1% rule +2.8/10.0
- Rent growth +2.5/5.0
- DSCR +2.3/10.0
$275,156
🖨 Deal sheet (PDF) 📄 Offer letter ✓ Due diligence
Listing remarks MLS
Fix dinner at the Greenville's sprawling kitchen island without missing any of the action in the family room. White cabinets with veined white quartz countertops, tan tone EVP flooring with beige textured carpet.
Key facts
- Whole home blinds
- White cabinets
- Pool
Tags
Property features AI
Finance
- Other: Property is in Morgan Farms subdivision; Directions available
- HOA & community: Mandatory association; Annual association fee of 600; Association covers grounds maintenance and management fees; HOA management: Alamo Management
Exterior
- Parking: Attached 2-car garage with garage door opener; 2 covered parking spaces
- Utilities: City water; City sewer; Low-flow water fixtures
- Home design: Single family residence; New construction (incomplete); New home smart features included
- Construction: Brick and rock/stone exterior; Composition roof; Slab foundation; Year built: 2026
- Exterior features: Wood fencing; Community pool; Playground
Interior
- Kitchen: Dishwasher; Disposal; Gas cooktop; Gas oven; Microwave; Refrigerator
- Bedrooms: Primary bedroom (15 x 14) on main level; Bedroom (14 x 13) on main level; Bedroom (11 x 13) on main level
- Flooring: Carpet; Ceramic tile; Luxury vinyl plank
- Bathrooms: 2 full bathrooms
- Heating & cooling: Electric heating; Heat pump; ENERGY STAR qualified equipment
- Interior features: Cable TV available; High-speed internet available; 5 total rooms; One living area; One dining area; Levels: One
- Laundry & utility: Washer; Dryer
Neighborhood map
What this means for you Summary
Snapshot
- This is a 3-bed/2.0-bath single-family listed at $275k. Condition is rated good.
Deal economics
- At list price, monthly cash flow is $-250 ($-3k/yr) — negative.
- To cash-flow at today's rent, offer at most $239k (13.1% below list).
- To meet the 1% rule (rent ≥ 1% of price), the offer needs to be $215k (21.7% below list).
- Recommended offer: $215k (21.7% below list) — sets the bar for 1% rule.
Location & tenants
- Location reads 60/100 on livability (#1,076 in TX) — a middle-class / working-renter tenant base. Strengths: cost of living A+, housing A+, crime A-; Watch: amenities F, commute F, health & safety F.
- Community ISD (rural): math 30% / reading 38% proficiency, ranked #479 of 826 in TX (top 58%) — families likely to look elsewhere, expect single-tenant / working-renter base with shorter leases.
- Zoned schools: John & Barbara Roderick El (678 students, 52% FRL) — zoned schools average 52% FRL vs 36% district-wide (16 pts higher); higher-poverty schools than district average — tighter screening recommended.
- Market conditions: 421 active listings in the ZIP; 10 comparable units currently listed for rent nearby; rentals at typical pace (median 16d on market — plan ~3-4 weeks tenant-placement turnaround); 19,194 units permitted in Collin County in 2024 (3,988 in 5+ unit buildings).
Forward outlook
- In year one you build about $29k of equity ($2k loan paydown + $28k appreciation (10.0% local appreciation)).
- Collin County population projected at +60% by 2050 — long-run rental-demand tailwind backs the buy-and-hold thesis.
- By year 2, paydown + projected appreciation supports a ~$47k cash-out refi (75% LTV) — recoverable capital for the next deal without selling this one.
Negotiation context
- It's been on market 17 days — a 2% lower offer ($271k) is reasonable based on typical stale-listing flexibility.
- 2 sale attempts; this cycle's ask has dropped $20k (7%) from the opening price — seller is motivated, your offer sets the floor, not the list.
Risks & watch-outs
- Climate carrying-cost: major wind risk, 27% chance of damaging wind over 30y; extreme-heat days projected 7→23/yr by 2055 (HVAC capex compounding) — expect insurance premiums to compound above CPI over the hold.
Questions for the listing agent
- What do current leases actually rent for vs. the listed asking? Can we see a recent rent roll and the last 12 months of T-12 income?
- What does the HOA fee cover, when was the last increase, and are there any pending special assessments or reserve-fund shortfalls?
- Is there a deadline driving the sale (1031 exchange, divorce, estate, relocation)? That informs how much negotiation room exists.
- Schools are F-rated, which usually means shorter tenancies and higher turnover. Who's the typical renter profile here, and what's been the actual vacancy rate?
- The area grade is low — what's the realistic commute time and amenity access for the typical tenant pool here? Any planned neighborhood developments (good or bad) we should know about?
- What's the average days-on-market for RENTAL listings here right now (not sales)? A rising rental-DOM trend means longer vacancies and softer asking-rent achievability than the comps imply.
- What's the recent tenant-quality profile in this submarket — average credit score on applications, eviction rate, late-payment / NSF rate, and stable-employment percentage? A property-management company in the area should have these aggregated.
- How much new for-sale + rental construction is in the pipeline within 1–3 miles? Heavy new supply typically softens prices + rents 12–24 months out; constrained supply supports both.
Investment metrics
- 1% rule
- 0.78% ✗
- Cap rate
- 5.20%
- Cash-on-cash
- -3.89%
- DSCR
- 0.83
- GRM
- 10.6
CMA / ARV
- ARV (median comp)
- $254,548
- List price
- $275,156
- Delta
- 15.95%
- Verdict
- OVERPRICED
- Comps
- 20 within 1.0 mi
Show comp detail 12 sales within ~0.75 mi
| Address | Dist | Beds/Ba | Sqft | Sold | Price | $/sf | Match |
|---|---|---|---|---|---|---|---|
| 1402 Centerline Dr | 0.58mi | 3/2.0 | 1,620 (-2%) | 2mo | $309,990 | $191 | 68 |
| 817 Lexington | 0.61mi | 3/2.0 | 1,636 (-1%) | 12mo | $255,990 | $156 | 59 |
| 828 Lexington Ln | 0.58mi | 3/2.0 | 1,589 (-4%) | 15mo | $270,000 | $170 | 53 |
| 806 Lexington | 0.64mi | 3/2.0 | 1,589 (-4%) | 12mo | $261,990 | $165 | 53 |
| 835 Lexington | 0.53mi | 4/2.0 (+1) | 1,721 (+4%) | 16mo | $305,990 | $178 | 50 |
| 904 Lexington Ln | 0.53mi | 4/2.0 (+1) | 1,721 (+4%) | 19mo | $289,990 | $169 | 48 |
| 913 W Cook St | 0.73mi | 3/2.0 | 1,527 (-8%) | 7mo | $525,000 | $344 | 46 |
| 610 Savanna Dr | 0.75mi | 3/2.0 | 1,755 (+6%) | 15mo | $272,500 | $155 | 43 |
| 806 Independence | 0.56mi | 3/2.0 | 1,420 (-14%) | 9mo | $245,000 | $173 | 42 |
| 900 Lexington Ln | 0.55mi | 4/2.0 (+1) | 1,827 (+10%) | 17mo | $254,990 | $140 | 38 |
| 808 Lexington | 0.61mi | 3/2.0 | 1,420 (-14%) | 14mo | $286,500 | $202 | 36 |
| 492 Milton St | 0.72mi | 3/2.5 | 1,454 (-12%) | 14mo | $275,000 | $189 | 32 |
Match score weights: distance 35% · size 25% · config 20% · recency 20%. Top-matched comps best support the ARV.
Projected returns pro-forma
10.0% appreciation · 3.0% rent growth · sell at horizon
- IRR
- 21.5%
- Equity multiple
- 2.74×
- Total profit
- $133,997
- Equity at exit
- $247,882
- IRR
- 19.4%
- Equity multiple
- 6.29×
- Total profit
- $407,248
- Equity at exit
- $534,568
Cash invested: $77,044 (down + closing). Projections, not guarantees.
Landlord ↔ Tenant lean methodology
- Overall (STATE)
- 87 Strongly Landlord-Friendly
- State Texas
- 87 Strongly Landlord-Friendly · R+5
- County
- — inherits STATE
- City
- — inherits STATE
ZIP-level market 75173
- Home prices YoY
- 3.1%
- Active inventory
- 421
- Price-to-rent
- 10.6×
Monthly cashflow live
- Estimated rent
- $2,154 high interval (Pro) →
- Mortgage (P&I)
- −$1,443
- Tax est. 1.5%
- −$344 /mo · $4,127/yr
- Insurance
- −$115
- HOA
- −$50
- Vacancy / Maint / Mgmt
- −$452
- Net cashflow
- $-250
Break-even live
Sensitivity live
| Price | -10% $-60 | -5% $-155 | +0% $-250 | +5% $-345 | +10% $-440 |
|---|---|---|---|---|---|
| Rent | -10% $-420 | -5% $-335 | +0% $-250 | +5% $-165 | +10% $-80 |
| Rate | -1.0pp $-111 | -0.5pp $-180 | base $-250 | +0.5pp $-321 | +1.0pp $-394 |
UW: 25.0% down · 7.5% · 30yr · 1.5% tax · 5.0% vac · 8.0% maint · 8.0% mgmt
Financing live
Cash to close
- Down payment
- $68,789
- Closing costs
- $8,255
- Reserves months
- —
- Total cash needed
- —
Loan-product check · same deal, 3 products live
Conventional
25% down · 7.5% · 30yr
- Down + closing
- —
- Monthly P&I
- —
- Monthly cashflow
- —
- DSCR
- —
- Eligible?
- —
Personal DTI + credit; lowest rate.
DSCR
20% down · 8.5% · 30yr
- Down + closing
- —
- Monthly P&I
- —
- Monthly cashflow
- —
- DSCR
- —
- Eligible?
- —
No personal income docs; deal must DSCR.
Hard money
10% down · 12.0% · 12mo
- Down + closing
- —
- Monthly P&I
- —
- Monthly cashflow
- —
- DSCR
- —
- Eligible?
- —
Short-term bridge; refi at stabilization.
Rent comps 10 comps
| Address | Beds | Baths | Sqft | Rent | $/sqft | DOM | Units | Dist |
|---|---|---|---|---|---|---|---|---|
| 6135 FM 547 Farmersville, TX | 4.0 | 2.5 | 1771 | $2,295 | $1.30 | 24d | 1 | 0.87mi |
| 464 N Greenville St Farmersville, TX | 3.0 | 2.0 | 2000 | $3,000 | $1.50 | 1d | 1 | 1.02mi |
| 319 Plum Dr Nevada, TX | 4.0 | 2.0 | 1587 | $1,899 | $1.20 | 10d | 1 | 1.04mi |
| 504 Saddle Blanket Dr Nevada, TX | 4.0 | 2.0 | 1649 | $1,925 | $1.17 | 6d | 1 | 1.32mi |
| 504 Saddle Blanket Dr Nevada, TX | 4.0 | 2.0 | 1649 | $1,949 | $1.18 | 15d | 1 | 1.32mi |
| 306 E Cook St Josephine, TX | 3.0 | 2.0 | 1817 | $2,100 | $1.16 | 1d | 1 | 1.32mi |
| 503 Saddle Blanket Dr Nevada, TX | 4.0 | 3.0 | 2077 | $2,190 | $1.05 | 44d | 1 | 1.35mi |
| 315 Pine Hollow Way Josephine, TX | 4.0 | 3.0 | 2212 | $2,300 | $1.04 | 7d | 1 | 1.47mi |
| 214 Crooked Field Dr Royse City, TX | 3.0 | 2.0 | 1398 | $1,900 | $1.36 | 25d | 1 | 1.48mi |
| 802 Turnbuckle Ct Royse City, TX | 4.0 | 2.0 | 1577 | $1,849 | $1.17 | 44d | 1 | 1.49mi |
HOA detail
- Monthly dues
- $50 · $600/yr
Listing history 16 events
-
2026-06-18days on market $275,156 Active 17 DOM
-
2026-06-17days on market $275,156 Active 16 DOM
-
2026-06-16days on market $275,156 Active 15 DOM
-
2026-06-15days on market $275,156 Active 14 DOM
-
2026-06-13days on market $275,156 Active 12 DOM
-
2026-06-13days on market $275,156 Active 11 DOM
-
2026-06-09days on market $275,156 Active 8 DOM
-
2026-06-08days on market $275,156 Active 7 DOM
-
2026-06-07days on market $275,156 Active 6 DOM
-
2026-06-04days on market $275,156 Active 3 DOM
-
2026-06-03days on market $275,156 Active 2 DOM
-
2026-06-02remarks 604-char remark
Show marketing remark (212 chars)
Fix dinner at the Greenville's sprawling kitchen island without missing any of the action in the family room. White cabinets with veined white quartz countertops, tan tone EVP flooring with beige textured carpet.
-
2026-06-02pricedays on market $275,156 Active 1 DOM
Show marketing remark (212 chars)
Fix dinner at the Greenville's sprawling kitchen island without missing any of the action in the family room. White cabinets with veined white quartz countertops, tan tone EVP flooring with beige textured carpet.
-
2026-06-01days on market $295,156 Active 18 DOM
-
2026-05-31days on market $295,156 Active 17 DOM
-
2026-05-14$295,156 Active 212-char remark
Show marketing remark (212 chars)
Fix dinner at the Greenville's sprawling kitchen island without missing any of the action in the family room. White cabinets with veined white quartz countertops, tan tone EVP flooring with beige textured carpet.
ⓘ Source: listings_history table (triggers on properties + properties_extension) + one-shot
backfill from property_details.listing_events for pre-trigger history.
Climate risk First Street
- Flood 1/10 Low FEMA zone X (unshaded) · 0% chance over 30 yrs
- Wildfire 3/10 Moderate
- Heat 8/10 Severe 7 d/yr ≥110°F today · 23 d/yr by 30 yrs out
- Wind 6/10 Major 27% chance of damaging wind over 30 yrs
- Air quality 2/10 Low 1 unhealthy d/yr today · 1 by 30 yrs out
Nearby sold comps map
Loading sold comps map…
Walkable amenities ~0.75 mi
Loading nearby amenities…
Taxation est. · year 1
- Rental income
- $25,846
- − Mortgage interest
- −$15,413
- − Property taxes
- −$4,127
- − Insurance
- −$1,376
- − Repairs & maintenance
- −$2,068
- − Management
- −$2,068
- − HOA
- −$600
- − Depreciation
- −$8,005
- Taxable loss
- −$7,810
- Est. tax savings @ 24.0%
- +$1,874
- After-tax cash flow
- $-1,126/yr
For passive investors: Depreciation is non-cash, so a rental often shows a tax loss while cash-flowing — sheltering income. Rental losses are passive: they offset passive income freely, and up to $25,000/yr can offset ordinary (W-2) income if you actively participate and your MAGI is under $100k (phasing out to $0 by $150k); unused losses carry forward. On sale, claimed depreciation is recaptured at up to 25%, and gains may owe capital-gains tax (a 1031 exchange can defer both). Figures are a year-1 estimate at your 24.0% rate — not tax advice; consult a CPA.
Condition & rehab AI · 1 photo
This single-family home is in good condition with a good condition score of 80. It is move-in ready with minimal cosmetic updates needed to enhance its resale and rental value.
Value-add opportunities
- Both Paint interior walls and trim — Fresh paint enhances curb appeal and interior aesthetics
- Both Replace carpet with hardwood or tile flooring in bathrooms — Hardwood or tile flooring is more durable and easier to maintain
- Both Install smart home devices for energy efficiency and convenience — Smart home devices can improve energy efficiency and add value to the home
Renovation cost estimate screening
Value-add ROI direction
- Both Paint interior walls and trim — Fresh paint enhances curb appeal and interior aesthetics ↑
- Both Replace carpet with hardwood or tile flooring in bathrooms — Hardwood or tile flooring is more durable and easier to maintain ↑
- Both Install smart home devices for energy efficiency and convenience — Smart home devices can improve energy efficiency and add value to the home ↑
ⓘ Cost ranges are severity-bucket heuristics (US national rule-of-thumb). Get contractor quotes + a written scope before underwriting a rehab budget.
Schools (NCES district)
- District
- Community ISD
- NCES district ID
- 4814850
- Math proficiency
- 30% ▼ -23.00%
- Reading proficiency
- 38% ▼ -11.00%
- Median HH income
- $71,841
- Composite
- 31.58/100
- National rank
- #5951
- State rank
- #479 of 826 in TX
Livability — Josephine
- Score
- 60/100
- State rank
- #1076
- US rank
- #19105
Category grades
Schools grade is shown separately in the Schools card above.
Census & demographics
- Population (ZIP)
- 9,284
Population outlook (Collin County) Hauer SSP2
- Today (2025)
- 1,210,074 people
- By 2030
- 1,358,201 · +12.2%
- By 2040
- 1,654,061 · +36.7%
- By 2050
- 1,937,359 · +60.1%
- By 2075
- 2,567,039 · +112.1%
- By 2100
- 2,952,048 · +144.0%
Race, ethnicity, and origin ACS 2023
- Neighborhood character
- Majority White (65%)
- Race & ethnicity
- White 65% Hispanic / Latino 28% Two or more races 15% Black 2% Native American 1%
- Hispanic origin (detail)
- Mexican 26%
- Common ancestry
- Slovak 2% Serbian 1% Iranian 1%
- Foreign-born
- 17% · Canada, Jamaica
- Languages at home
- 74% English-only · Spanish 24% Arabic 1%
Political lean MEDSL · Collin
- 2024 margin
- R (+11.1) · D 43.1% · R 54.3% · Other 2.6%
- 2008→2024 swing
- +14.4pp toward D · 2008: -25.6pp · 2024: -11.1pp
- All cycles
- 2024: R+11.1 2020: R+4.3 2016: R+17.0 2012: R+31.6 2008: R+25.6
Not yet ingested
- Civics
- —
Market trends
- HPI YoY
- ▲ 10.09%
- Current HPI
- 331.12
- Rent YoY
- —
- Metro
- —
- State GDP YoY
- ▲ 3.95%
- F500 in state
- 110
Industry mix (Fortune 500 HQ in TX)
| Industry | F500 HQs | Revenue |
|---|---|---|
| Energy | 16 | $1,198B |
|
||
| Technology | 5 | $198B |
|
||
| Engineering / Construction | 4 | $72B |
|
||
| Energy Services | 3 | $60B |
|
||
| Utilities | 3 | $41B |
|
||
| Healthcare | 2 | $330B |
|
||
Price history
+0.0% since first listed3 events — show timeline
- 2026-06-02 Price Changed $275,156 Zillow
- 2026-05-14 Listed $295,156 Zillow
- 2026-05-07 Listed $275,156 NTREIS
Cash-flow waterfall
monthlySold comps — $/sqft
last 12 mo · ≤1 miLoading sold comps…