 Fourplex
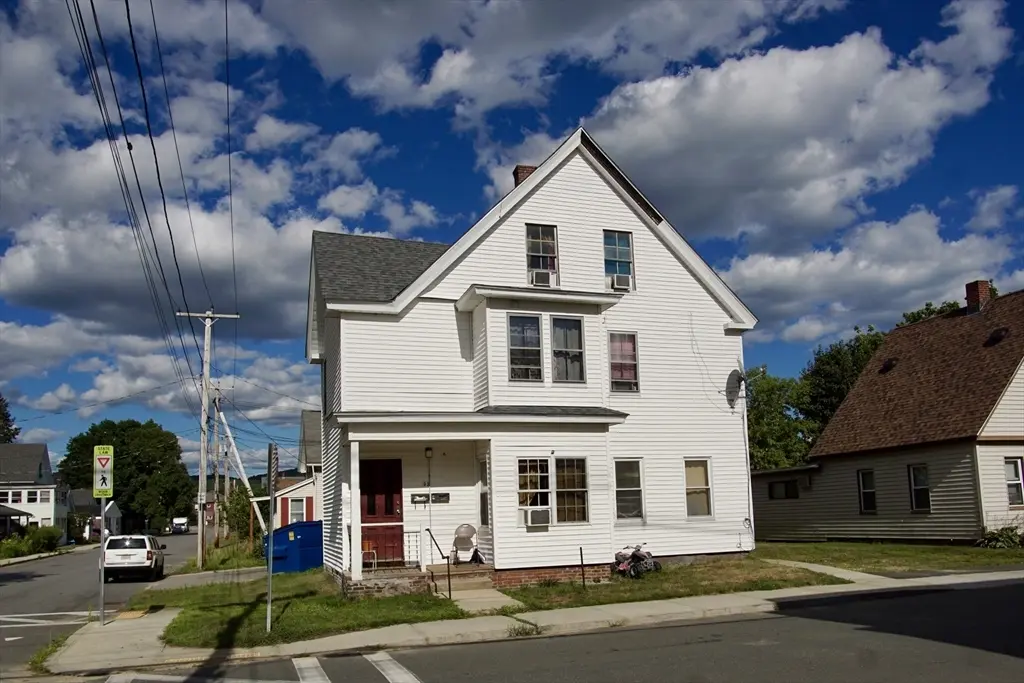
53 Union St · Athol, MA
Flood risk 3/10 · Minor
- FEMA flood zone
- —
- Chance of flooding over 30 yrs
- 0.12%
- Est. flood insurance / yr
- —
Fire risk 3/10 · Minor
- Est. fire insurance / yr
- $915 – $1,699
Heat risk 4/10 · Minor
- Hot days now (above 93°F)
- 8 days/yr
- Hot days in 30 yrs
- 18 days/yr
Wind risk 4/10 · Minor
- Chance of severe wind over 30 yrs
- 19.0%
Air-quality risk 2/10 · Minimal
- Unhealthy air days now
- 1 days/yr
- Unhealthy air days in 30 yrs
- 1 days/yr
Risk factors via First Street. Map © Google.
Why this score? — see what drove the C+ grade
The composite is a weighted blend of 9 inputs, each scored 0–100. Each bar is that input's sub-score; the figure is the points it added to the 100-point composite (weight × sub-score).
- Cash flow +30.0/30.0
- DSCR +10.0/10.0
- 1% rule +9.3/10.0
- Livability +3.7/5.0
- Rent growth +2.5/5.0
- Condition / age +2.5/5.0
- Schools +2.4/10.0
- ARV discount +0.0/15.0
- Appreciation +0.0/10.0
$425,000
🖨 Deal sheet 📄 Offer letter ✓ Due diligence
Multi-family units
County records classify this as Multi-Family (5+ Unit). Listing-text estimate: 4 units. estimate disagrees with records
5+ unit building — per-unit beds/baths from public records are typically unavailable; the breakdown below (if shown) is an estimate from the listing text.
Listing remarks MLS
4-Family home close to park and conveniences.
Key facts
- Separate utilities
- Off street parking
- Newer roof
Tags
Property features AI
Finance
- HOA & community: Nearby public transportation and shopping
Exterior
- Parking: Four off-street parking spaces
- Utilities: Public water; Public sewer
- Home design: Four-family property; Four stories total; Approximately 3,250 total building area
- Construction: Frame construction; Stone foundation; Shingle roof; Year built as approximate (from public records)
- Exterior features: Corner lot; Public road frontage
Interior
- Kitchen: Kitchen included
- Flooring: Varied flooring
- Bathrooms: Four full bathrooms
- Heating & cooling: Wall unit cooling
- Interior features: Total of 13 rooms; Kitchen
Neighborhood map
What this means for you Summary
Snapshot
- This is a 3×1bd/1ba + 1×2bd/1ba units multifamily listed at $425k.
Deal economics
- At list price, monthly cash flow is $2k ($25k/yr) — positive. Per door: $521/mo.
- The deal already cash-flows at list — no discount required.
- Meets the 1% rule at list price ($6k rent vs $425k).
- Recommended offer: $412k (3.0% below list) — sets the bar for market timing.
- Cap rate 12.2% vs local median 4.0% in Athol — top-decile yield for the area; either an underpriced asset or a hidden risk that comps aren't pricing in. Stress-test before assuming the spread holds.
Location & tenants
- Location reads 74/100 on livability (#84 in MA, #4,383 nationally) — a middle-class / working-renter tenant base. Strengths: housing A+, health & safety A+, cost of living A-; Watch: employment D, schools F, amenities F.
- Athol-Royalston (town): math 22% / reading 33% proficiency, ranked #265 of 302 in MA (top 88%) — low school quality limits family demand, transient renter base, plan for 1-2y turnover.
- Market conditions: 42 active listings in the ZIP; 2,293 units permitted in Worcester County in 2024 (1,205 in 5+ unit buildings).
Forward outlook
- Local home prices are declining (-3.0%/yr); year-one equity from $3k of loan paydown is wiped out by about $13k of value loss. Plan a longer hold.
- At projected returns (-3.0% appreciation + 3.0% rent growth), your $119k cash investment doubles in ~6 years — after that, you're playing with house money.
Negotiation context
- It's been on market 34 days — a 3% lower offer ($412k) is reasonable based on typical stale-listing flexibility.
- 9 sale attempts since 14y ago with the ask held roughly flat each time — persistent listings suggest the price (not the market) is what's stuck; bring a comps-based counter.
- Current owner paid $65k; list at $425k implies a 554% gain — meaningful room to come down on a strong offer.
Risks & watch-outs
- Watch-outs: built in 1920 — expect roof / HVAC / electrical / plumbing capex.
Questions for the listing agent
- It's been on market 34 days. Have you received any prior offers? Is the seller open to a 3% concession, seller financing, or rate buy-down credit?
- Can we see the unit-by-unit rent roll, current vacancy, and any below-market leases? What's the average tenancy length?
- What capital expenditures (roof, boiler, parking lot, exteriors) have been made in the last 5 years, and what's planned in the next 2?
- Built in 1920 — when were the roof, HVAC, electrical panel, plumbing, and water heater last replaced?
- Is there a deadline driving the sale (1031 exchange, divorce, estate, relocation)? That informs how much negotiation room exists.
- Schools are F-rated, which usually means shorter tenancies and higher turnover. Who's the typical renter profile here, and what's been the actual vacancy rate?
- What's the average days-on-market for RENTAL listings here right now (not sales)? A rising rental-DOM trend means longer vacancies and softer asking-rent achievability than the comps imply.
- What's the recent tenant-quality profile in this submarket — average credit score on applications, eviction rate, late-payment / NSF rate, and stable-employment percentage? A property-management company in the area should have these aggregated.
- How much new apartment / multifamily construction is in the pipeline within 1–3 miles? Heavy new supply (>2% of stock underway) typically softens rents 12–24 months out; light construction supports rent growth.
Investment metrics
- 1% rule
- 1.43% ✓
- Cap rate
- 12.18%
- Cash-on-cash
- 21.02%
- DSCR
- 1.94
- GRM
- 5.8
CMA / ARV
- ARV (median comp)
- $326,464
- List price
- $425,000
- Delta
- 30.18%
- Verdict
- OVERPRICED
- Comps
- 20 within 1.0 mi
Show comp detail 7 sales within ~0.75 mi
| Address | Dist | Beds/Ba | Sqft | Sold | Price | $/sf | Match |
|---|---|---|---|---|---|---|---|
| 129 Union St | 0.07mi | 6/2.0 (+1) | 3,248 (-0%) | 16mo | $440,000 | $135 | 67 |
| 57-59 Cottage St | 0.42mi | 5/2.0 | 3,090 (-5%) | 5mo | $440,000 | $142 | 56 |
| 71-73 Sanders St | 0.36mi | 6/4.0 (+1) | 3,113 (-4%) | 23mo | $400,000 | $128 | 48 |
| 227 Riverbend St | 0.64mi | 6/2.5 (+1) | 3,002 (-8%) | 1mo | $449,998 | $150 | 41 |
| 22 Allen St | 0.59mi | 6/3.0 (+1) | 2,868 (-12%) | 2mo | $320,000 | $112 | 38 |
| 64 Prospect St | 0.50mi | 6/3.0 (+1) | 3,727 (+15%) | 22mo | $349,900 | $94 | 21 |
| 138 Cottage St | 0.45mi | 4/2.0 (-1) | 2,763 (-15%) | 23mo | $308,000 | $111 | 18 |
Match score weights: distance 35% · size 25% · config 20% · recency 20%. Top-matched comps best support the ARV.
Projected returns pro-forma
-3.0% appreciation · 3.0% rent growth · sell at horizon
- IRR
- 13.5%
- Equity multiple
- 1.54×
- Total profit
- $63,860
- Equity at exit
- $63,369
- IRR
- 22.3%
- Equity multiple
- 2.90×
- Total profit
- $226,409
- Equity at exit
- $36,746
Cash invested: $119,000 (down + closing). Projections, not guarantees.
Landlord ↔ Tenant lean methodology
- Overall (STATE)
- 20 Strongly Tenant-Friendly
- State Massachusetts
- 20 Strongly Tenant-Friendly · D+15
- County
- — inherits STATE
- City
- — inherits STATE
ZIP-level market 01331
- Home prices YoY
- -9.9%
- Active inventory
- 42
- Price-to-rent
- 23.5×
Monthly cashflow live
- Estimated rent
- $6,087 high interval (Pro) →
- Mortgage (P&I)
- −$2,229
- Tax from tax record
- −$318 /mo · $3,820/yr
- Insurance
- −$177
- HOA
- −$0
- Vacancy / Maint / Mgmt
- −$1,278
- Net cashflow
- $2,085
Break-even live
4-unit breakdown (identical units grouped — click to expand)
| Units | Beds | Baths | Est. rent |
|---|---|---|---|
| 3× units | 1 | 1 | $4,518 |
| #1 | 1 | 1 | $1,506 |
| #2 | 1 | 1 | $1,506 |
| #3 | 1 | 1 | $1,506 |
| 1× unit | 2 | 1 | $1,568 |
| Total (4 units) | $6,087 | ||
UW: 25.0% down · 7.5% · 30yr · 1.5% tax · 5.0% vac · 8.0% maint · 8.0% mgmt
Financing live
Cash to close
- Down payment
- $106,250
- Closing costs
- $12,750
- Reserves months
- —
- Total cash needed
- —
Loan-product check · same deal, 3 products live
Conventional
25% down · 7.5% · 30yr
- Down + closing
- —
- Monthly P&I
- —
- Monthly cashflow
- —
- DSCR
- —
- Eligible?
- —
Personal DTI + credit; lowest rate.
DSCR
20% down · 8.5% · 30yr
- Down + closing
- —
- Monthly P&I
- —
- Monthly cashflow
- —
- DSCR
- —
- Eligible?
- —
No personal income docs; deal must DSCR.
Hard money
10% down · 12.0% · 12mo
- Down + closing
- —
- Monthly P&I
- —
- Monthly cashflow
- —
- DSCR
- —
- Eligible?
- —
Short-term bridge; refi at stabilization.
Listing history 41 events
-
2026-06-18days on market $425,000 Active 34 DOM
-
2026-06-17days on market $425,000 Active 33 DOM
-
2026-06-16days on market $425,000 Active 32 DOM
-
2026-06-15days on market $425,000 Active 31 DOM
-
2026-06-13days on market $425,000 Active 29 DOM
-
2026-06-12days on market $425,000 Active 28 DOM
-
2026-06-09days on market $425,000 Active 25 DOM
-
2026-06-08days on market $425,000 Active 24 DOM
-
2026-06-07days on market $425,000 Active 23 DOM
-
2026-06-07days on market $425,000 Active 22 DOM
-
2026-06-04days on market $425,000 Active 19 DOM
-
2026-06-02days on market $425,000 Active 18 DOM
-
2026-06-01days on market $425,000 Active 17 DOM
-
2026-05-31days on market $425,000 Active 16 DOM
-
2026-05-31days on market $425,000 Active 15 DOM
-
2026-05-15$425,000 New 642-char remark
-
2014-05-13soldstatus $65,000 Sold 45-char remark
Show marketing remark (45 chars)
4-Family home close to park and conveniences.
-
2014-04-16status Under Agreement 45-char remark
Show marketing remark (45 chars)
4-Family home close to park and conveniences.
-
2014-04-16historical 45-char remark
Show marketing remark (45 chars)
4-Family home close to park and conveniences.
-
2014-04-05historical Contingent 45-char remark
Show marketing remark (45 chars)
4-Family home close to park and conveniences.
-
2014-03-31price $69,900 Back On Market 45-char remark
Show marketing remark (45 chars)
4-Family home close to park and conveniences.
-
2014-03-31status Back On Market 45-char remark
Show marketing remark (45 chars)
4-Family home close to park and conveniences.
-
2014-03-27historical 45-char remark
Show marketing remark (45 chars)
4-Family home close to park and conveniences.
-
2014-03-24price $55,500 Price Changed 45-char remark
Show marketing remark (45 chars)
4-Family home close to park and conveniences.
-
2014-03-19price $82,500 Price Changed 45-char remark
Show marketing remark (45 chars)
4-Family home close to park and conveniences.
-
2014-01-16status Reactivated 45-char remark
Show marketing remark (45 chars)
4-Family home close to park and conveniences.
-
2014-01-16historical 45-char remark
Show marketing remark (45 chars)
4-Family home close to park and conveniences.
-
2013-11-19price $89,900 Price Changed 45-char remark
Show marketing remark (45 chars)
4-Family home close to park and conveniences.
-
2013-11-16status Reactivated 45-char remark
Show marketing remark (45 chars)
4-Family home close to park and conveniences.
-
2013-11-16historical 45-char remark
Show marketing remark (45 chars)
4-Family home close to park and conveniences.
-
2013-09-17price $97,500 Price Changed 45-char remark
Show marketing remark (45 chars)
4-Family home close to park and conveniences.
-
2013-05-22status Reactivated 45-char remark
Show marketing remark (45 chars)
4-Family home close to park and conveniences.
-
2013-03-28historical 45-char remark
Show marketing remark (45 chars)
4-Family home close to park and conveniences.
-
2013-02-18status Reactivated 45-char remark
Show marketing remark (45 chars)
4-Family home close to park and conveniences.
-
2013-02-16historical 45-char remark
Show marketing remark (45 chars)
4-Family home close to park and conveniences.
-
2012-12-06price $101,000 Price Changed 45-char remark
Show marketing remark (45 chars)
4-Family home close to park and conveniences.
-
2012-10-24price $121,000 Price Changed 45-char remark
Show marketing remark (45 chars)
4-Family home close to park and conveniences.
-
2012-10-17status Reactivated 45-char remark
Show marketing remark (45 chars)
4-Family home close to park and conveniences.
-
2012-10-16historical 45-char remark
Show marketing remark (45 chars)
4-Family home close to park and conveniences.
-
2012-04-26price $131,000 Price Changed 45-char remark
Show marketing remark (45 chars)
4-Family home close to park and conveniences.
-
2012-03-16$159,900 New 45-char remark
Show marketing remark (45 chars)
4-Family home close to park and conveniences.
ⓘ Source: listings_history table (triggers on properties + properties_extension) + one-shot
backfill from property_details.listing_events for pre-trigger history.
Tax reassessment forecast MA · Partial reset (capped growth)
- Current annual tax
- $3,820 · $318/mo
- Projected year-2 tax
- $4,524 · $377/mo
- Expected delta
- +$704/yr (+$59/mo · 18.4%)
ⓘ Screening estimate from a state-policy table — verify with the county assessor before closing.
Climate risk First Street
- Flood 3/10 Moderate 12% chance over 30 yrs
- Wildfire 3/10 Moderate
- Heat 4/10 Moderate 8 d/yr ≥93°F today · 18 d/yr by 30 yrs out
- Wind 4/10 Moderate 19% chance of damaging wind over 30 yrs
- Air quality 2/10 Low 1 unhealthy d/yr today · 1 by 30 yrs out
Nearby sold comps map
Loading sold comps map…
Walkable amenities ~0.75 mi
Loading nearby amenities…
Taxation est. · year 1
- Rental income
- $73,044
- − Mortgage interest
- −$23,807
- − Property taxes
- −$3,820
- − Insurance
- −$2,125
- − Repairs & maintenance
- −$5,844
- − Management
- −$5,844
- − Depreciation
- −$12,364
- Taxable income
- $19,242
- Est. tax owed @ 24.0%
- −$4,618
- After-tax cash flow
- $20,397/yr
For passive investors: Depreciation is non-cash, so a rental often shows a tax loss while cash-flowing — sheltering income. Rental losses are passive: they offset passive income freely, and up to $25,000/yr can offset ordinary (W-2) income if you actively participate and your MAGI is under $100k (phasing out to $0 by $150k); unused losses carry forward. On sale, claimed depreciation is recaptured at up to 25%, and gains may owe capital-gains tax (a 1031 exchange can defer both). Figures are a year-1 estimate at your 24.0% rate — not tax advice; consult a CPA.
Schools (NCES district)
- District
- Athol-Royalston
- NCES district ID
- 2502160
- Math proficiency
- 22% ▼ -14.00%
- Reading proficiency
- 33% ▼ -5.00%
- Median HH income
- $49,570
- Composite
- 24.05/100
- National rank
- #7764
- State rank
- #265 of 302 in MA
Livability — Athol
- Score
- 74/100
- State rank
- #84
- US rank
- #4383
Category grades
Schools grade is shown separately in the Schools card above.
Census & demographics
- Census place
- Athol, MA
- Population (ZIP)
- 13,865
Population outlook (Worcester County) Hauer SSP2
- Today (2025)
- 850,858 people
- By 2030
- 860,403 · +1.1%
- By 2040
- 869,902 · +2.2%
- By 2050
- 869,110 · +2.1%
- By 2075
- 870,120 · +2.3%
- By 2100
- 829,703 · -2.5%
Race, ethnicity, and origin ACS 2023
- Neighborhood character
- Predominantly White (89%)
- Race & ethnicity
- White 89% Hispanic / Latino 5% Two or more races 4% Black 2%
- Hispanic origin (detail)
- Puerto Rican 4%
- Common ancestry
- Lithuanian 14% Romanian 6% Slovak 2%
- Foreign-born
- 3% · Canada
- Languages at home
- 94% English-only · Spanish 2% French/Haitian/Cajun 2% German/W. Germanic 1%
Political lean MEDSL · Worcester
- 2024 margin
- D (+10.0) · D 53.9% · R 43.9% · Other 2.2%
- 2008→2024 swing
- -3.8pp toward R · 2008: 13.8pp · 2024: 10.0pp
- All cycles
- 2024: D+10.0 2020: D+17.8 2016: D+10.5 2012: D+9.2 2008: D+13.8
Not yet ingested
- Civics
- —
Market trends
- HPI YoY
- ▼ -37.02%
- Current HPI
- 336.1238
- Rent YoY
- —
- Metro
- —
- State GDP YoY
- ▲ 2.28%
- F500 in state
- 38
Industry mix (Fortune 500 HQ in MA)
| Industry | F500 HQs | Revenue |
|---|---|---|
| Technology | 3 | $17B |
|
||
| Insurance | 2 | $84B |
|
||
| Retail | 2 | $76B |
|
||
| Life Sciences | 1 | $43B |
|
||
| Energy Technology | 1 | $31B |
|
||
| Aerospace / Defense | 1 | $18B |
|
||
Price history
+165.8% since first listed26 events — show timeline
- 2026-05-15 Listed $425,000 MLS PIN
- 2014-05-13 Sold (MLS) $65,000 MLS PIN
- 2014-04-16 Relisted — MLS PIN
- 2014-04-16 Listing Removed — MLS PIN
- 2014-04-05 Contingent — MLS PIN
- 2014-03-31 Relisted — MLS PIN
- 2014-03-31 Price Changed $69,900 MLS PIN
- 2014-03-27 Listing Removed — MLS PIN
- 2014-03-24 Price Changed $55,500 MLS PIN
- 2014-03-19 Price Changed $82,500 MLS PIN
- 2014-01-16 Relisted — MLS PIN
- 2014-01-16 Listing Removed — MLS PIN
- 2013-11-19 Price Changed $89,900 MLS PIN
- 2013-11-16 Relisted — MLS PIN
- 2013-11-16 Listing Removed — MLS PIN
- 2013-09-17 Price Changed $97,500 MLS PIN
- 2013-05-22 Relisted — MLS PIN
- 2013-03-28 Listing Removed — MLS PIN
- 2013-02-18 Relisted — MLS PIN
- 2013-02-16 Listing Removed — MLS PIN
- 2012-12-06 Price Changed $101,000 MLS PIN
- 2012-10-24 Price Changed $121,000 MLS PIN
- 2012-10-17 Relisted — MLS PIN
- 2012-10-16 Listing Removed — MLS PIN
- 2012-04-26 Price Changed $131,000 MLS PIN
- 2012-03-16 Listed $159,900 MLS PIN
Property tax history
+3.9%/yrLatest (2023): $3,820 · +47.4% YoY. Source: county tax records.
Cash-flow waterfall
monthlySold comps — $/sqft
last 12 mo · ≤1 miLoading sold comps…