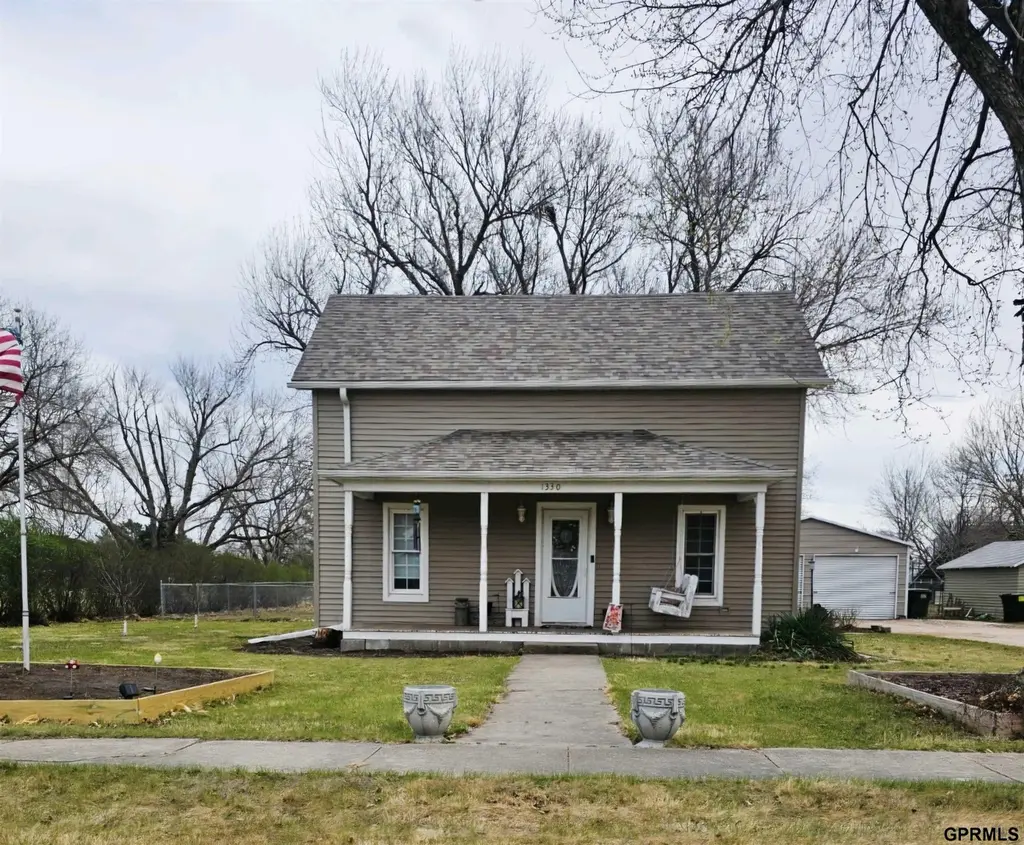
1330 N Main St · Henderson, NE
Flood risk 1/10 · Minimal
- FEMA flood zone
- X (unshaded)
- Chance of flooding over 30 yrs
- 0.0%
- Est. flood insurance / yr
- $507 – $1,088
Fire risk 1/10 · Minimal
- Est. fire insurance / yr
- $1,161 – $2,155
Heat risk 3/10 · Minor
- Hot days now (above 103°F)
- 7 days/yr
- Hot days in 30 yrs
- 16 days/yr
Wind risk 2/10 · Minimal
- Chance of severe wind over 30 yrs
- —
Air-quality risk 1/10 · Minimal
- Unhealthy air days now
- 0 days/yr
- Unhealthy air days in 30 yrs
- 0 days/yr
Risk factors via First Street. Map © Google.
Why this score? — see what drove the C- grade
The composite is a weighted blend of 9 inputs, each scored 0–100. Each bar is that input's sub-score; the figure is the points it added to the 100-point composite (weight × sub-score).
- ARV discount +15.0/15.0
- Appreciation +10.0/10.0
- Cash flow +7.7/30.0
- Schools +5.7/10.0
- Livability +3.9/5.0
- Rent growth +2.5/5.0
- Condition / age +2.5/5.0
- DSCR +1.8/10.0
- 1% rule +1.7/10.0
$189,000
🖨 Deal sheet (PDF) 📄 Offer letter ✓ Due diligence
Listing remarks MLS
Property has a pending contract. Adorable, move in ready home. Wood floors have been refinished and is so inviting. Easy access kitchen, dining and living room give lots of space on the main floor. Main floor bedroom and laundry is a bonus! Upper bedrooms are all roomy and bright. Back yard is fenced and allows lots of yard space while enjoying the large deck. Pull into the newer steel garage for your car or truck. Extra space for parking your RV or boat!
Key facts
- Large garage shop
- Fully fenced yard
- Main floor bedrooms
Tags
Property features AI
Exterior
- Parking: Detached garage; Two covered parking spaces (2 total)
- Utilities: Public water; Public sewer; Cable available
- Home design: Single-family residence; 1.75-story home; Not new (originally built 1914)
- Construction: Vinyl siding; Composition roof; Other foundation; Built in 1914
- Exterior features: Porch; Deck; Chain link fencing; Lot over 1/2 up to 1 acre (about 0.57 acre); Lot dimensions approximately 100 x 250
Interior
- Kitchen: Range; Refrigerator; Dishwasher
- Bedrooms: Primary bedroom on the main floor; Additional bedrooms on the second floor
- Bathrooms: Two bathrooms total — one full bath and one three-quarter bath
- Heating & cooling: Natural gas forced-air heating; Central air conditioning
- Interior features: Ceiling fan(s); Formal dining room; Unfinished basement with egress window
- Laundry & utility: Washer; Dryer
Neighborhood map
What this means for you Summary
Snapshot
- This is a 4-bed/2.0-bath single-family listed at $189k.
Deal economics
- At list price, monthly cash flow is $-221 ($-3k/yr) — negative.
- To cash-flow at today's rent, offer at most $150k (20.7% below list).
- To meet the 1% rule (rent ≥ 1% of price), the offer needs to be $127k (32.8% below list).
- Recommended offer: $127k (32.8% below list) — sets the bar for 1% rule.
Location & tenants
- Location reads 77/100 on livability (#66 in NE, #2,981 nationally) — a middle-class / working-renter tenant base. Strengths: cost of living A+, housing A+, health & safety A+; Watch: amenities F, commute F.
- Heartland Community Schools (rural): math 70% / reading 60% proficiency, ranked #30 of 245 in NE (top 12%) — acceptable for families but not a draw, mixed tenant base, ~2y average lease; only 18% free/reduced lunch — higher-income household profile.
- Zoned schools: Heartland Community Elementary (math 52% / reading 62%, grade C+, #136 of 502 statewide, top 31%, 197 students, 36% FRL); Heartland Community High Sch (math 72% / reading 57%, grade B-, #25 of 261 statewide, top 13%, 156 students, 29% FRL).
- Market conditions: 9 active listings in the ZIP; 29 units permitted in York County in 2024 (0 in 5+ unit buildings).
Forward outlook
- In year one you build about $20k of equity ($1k loan paydown + $19k appreciation (10.0% local appreciation)).
- York County population projected at +8% by 2050 — modest demand growth; plan on rents tracking national, not racing it.
- By year 2, paydown + projected appreciation supports a ~$32k cash-out refi (75% LTV) — recoverable capital for the next deal without selling this one.
Negotiation context
- It's been on market 24 days — a 2% lower offer ($186k) is reasonable based on typical stale-listing flexibility.
- 2 sale attempts since 6y ago with the ask held roughly flat each time — persistent listings suggest the price (not the market) is what's stuck; bring a comps-based counter.
Risks & watch-outs
- Watch-outs: built in 1914 — expect roof / HVAC / electrical / plumbing capex.
Questions for the listing agent
- What do current leases actually rent for vs. the listed asking? Can we see a recent rent roll and the last 12 months of T-12 income?
- Built in 1914 — when were the roof, HVAC, electrical panel, plumbing, and water heater last replaced?
- Is there a deadline driving the sale (1031 exchange, divorce, estate, relocation)? That informs how much negotiation room exists.
- Schools are A-rated — typically a magnet for longer-tenancy family renters. What's the average tenant stay here, and is there a school-zone premium baked into asking?
- What's the average days-on-market for RENTAL listings here right now (not sales)? A rising rental-DOM trend means longer vacancies and softer asking-rent achievability than the comps imply.
- What's the recent tenant-quality profile in this submarket — average credit score on applications, eviction rate, late-payment / NSF rate, and stable-employment percentage? A property-management company in the area should have these aggregated.
- How much new for-sale + rental construction is in the pipeline within 1–3 miles? Heavy new supply typically softens prices + rents 12–24 months out; constrained supply supports both.
Investment metrics
- 1% rule
- 0.67% ✗
- Cap rate
- 4.89%
- Cash-on-cash
- -5.01%
- DSCR
- 0.78
- GRM
- 12.4
CMA / ARV
- ARV (median comp)
- $233,752
- List price
- $189,000
- Delta
- -19.15%
- Verdict
- UNDERPRICED
- Comps
- 13 within 1.0 mi
Show comp detail 4 sales within ~0.75 mi
| Address | Dist | Beds/Ba | Sqft | Sold | Price | $/sf | Match |
|---|---|---|---|---|---|---|---|
| 1321 N Main St | 0.04mi | 3/2.0 (-1) | 1,837 (+3%) | 1mo | $200,000 | $109 | 88 |
| 1181 18th St | 0.34mi | 4/3.0 | 1,610 (-10%) | 2mo | $365,000 | $227 | 62 |
| 1180 10th St | 0.29mi | 3/1.0 (-1) | 1,600 (-10%) | 6mo | $200,000 | $125 | 55 |
| 920 17th St | 0.50mi | 3/2.5 (-1) | 1,638 (-8%) | 10mo | $235,000 | $143 | 47 |
Match score weights: distance 35% · size 25% · config 20% · recency 20%. Top-matched comps best support the ARV.
Projected returns pro-forma
10.0% appreciation · 3.0% rent growth · sell at horizon
- IRR
- 20.7%
- Equity multiple
- 2.68×
- Total profit
- $88,830
- Equity at exit
- $170,266
- IRR
- 18.8%
- Equity multiple
- 6.15×
- Total profit
- $272,596
- Equity at exit
- $367,185
Cash invested: $52,920 (down + closing). Projections, not guarantees.
Landlord ↔ Tenant lean methodology
- Overall (STATE)
- 83 Strongly Landlord-Friendly
- State Nebraska
- 83 Strongly Landlord-Friendly · R+13
- County
- — inherits STATE
- City
- — inherits STATE
ZIP-level market 68371
- Active inventory
- 9
- Price-to-rent
- 12.4×
Monthly cashflow live
- Estimated rent
- $1,271 medium interval (Pro) →
- Mortgage (P&I)
- −$991
- Tax from tax record
- −$155 /mo · $1,860/yr
- Insurance
- −$79
- HOA
- −$0
- Vacancy / Maint / Mgmt
- −$267
- Net cashflow
- $-221
Break-even live
Sensitivity live
| Price | -10% $-114 | -5% $-167 | +0% $-221 | +5% $-274 | +10% $-328 |
|---|---|---|---|---|---|
| Rent | -10% $-321 | -5% $-271 | +0% $-221 | +5% $-171 | +10% $-121 |
| Rate | -1.0pp $-126 | -0.5pp $-173 | base $-221 | +0.5pp $-270 | +1.0pp $-320 |
UW: 25.0% down · 7.5% · 30yr · 1.5% tax · 5.0% vac · 8.0% maint · 8.0% mgmt
Financing live
Cash to close
- Down payment
- $47,250
- Closing costs
- $5,670
- Reserves months
- —
- Total cash needed
- —
Loan-product check · same deal, 3 products live
Conventional
25% down · 7.5% · 30yr
- Down + closing
- —
- Monthly P&I
- —
- Monthly cashflow
- —
- DSCR
- —
- Eligible?
- —
Personal DTI + credit; lowest rate.
DSCR
20% down · 8.5% · 30yr
- Down + closing
- —
- Monthly P&I
- —
- Monthly cashflow
- —
- DSCR
- —
- Eligible?
- —
No personal income docs; deal must DSCR.
Hard money
10% down · 12.0% · 12mo
- Down + closing
- —
- Monthly P&I
- —
- Monthly cashflow
- —
- DSCR
- —
- Eligible?
- —
Short-term bridge; refi at stabilization.
Listing history 5 events
-
2026-04-28$189,000 New 544-char remark
-
2020-07-24soldstatus $129,900 464-char remark
Show marketing remark (464 chars)
Property has a pending contract. Adorable, move in ready home. Wood floors have been refinished and is so inviting. Easy access kitchen, dining and living room give lots of space on the main floor. Main floor bedroom and laundry is a bonus! Upper bedrooms are all roomy and bright. Back yard is fenced and allows lots of yard space while enjoying the large deck. Pull into the newer steel garage for your car or truck. Extra space for parking your RV or boat!
-
2020-02-12$129,900 464-char remark
Show marketing remark (464 chars)
Property has a pending contract. Adorable, move in ready home. Wood floors have been refinished and is so inviting. Easy access kitchen, dining and living room give lots of space on the main floor. Main floor bedroom and laundry is a bonus! Upper bedrooms are all roomy and bright. Back yard is fenced and allows lots of yard space while enjoying the large deck. Pull into the newer steel garage for your car or truck. Extra space for parking your RV or boat!
-
2017-02-01soldstatus $85,000
-
2001-07-25soldstatus $72,500
ⓘ Source: listings_history table (triggers on properties + properties_extension) + one-shot
backfill from property_details.listing_events for pre-trigger history.
Tax reassessment forecast NE · Resets to sale price
- Current annual tax
- $1,860 · $155/mo
- Projected year-2 tax
- $3,270 · $272/mo
- Expected delta
- +$1,409/yr (+$117/mo · 75.7%)
ⓘ Screening estimate from a state-policy table — verify with the county assessor before closing.
Climate risk First Street
- Flood 1/10 Low FEMA zone X (unshaded) · 0% chance over 30 yrs
- Wildfire 1/10 Low
- Heat 3/10 Moderate 7 d/yr ≥103°F today · 16 d/yr by 30 yrs out
- Wind 2/10 Low
- Air quality 1/10 Low 0 unhealthy d/yr today · 0 by 30 yrs out
Nearby sold comps map
Loading sold comps map…
Walkable amenities ~0.75 mi
Loading nearby amenities…
Taxation est. · year 1
- Rental income
- $15,250
- − Mortgage interest
- −$10,587
- − Property taxes
- −$1,860
- − Insurance
- −$945
- − Repairs & maintenance
- −$1,220
- − Management
- −$1,220
- − Depreciation
- −$5,498
- Taxable loss
- −$6,081
- Est. tax savings @ 24.0%
- +$1,459
- After-tax cash flow
- $-1,192/yr
For passive investors: Depreciation is non-cash, so a rental often shows a tax loss while cash-flowing — sheltering income. Rental losses are passive: they offset passive income freely, and up to $25,000/yr can offset ordinary (W-2) income if you actively participate and your MAGI is under $100k (phasing out to $0 by $150k); unused losses carry forward. On sale, claimed depreciation is recaptured at up to 25%, and gains may owe capital-gains tax (a 1031 exchange can defer both). Figures are a year-1 estimate at your 24.0% rate — not tax advice; consult a CPA.
Schools (NCES district)
- District
- Heartland Community Schools
- NCES district ID
- 3100117
- Math proficiency
- 70% ▲ 5.00%
- Reading proficiency
- 60% ▼ -5.00%
- Median HH income
- $57,754
- Composite
- 57.38/100
- National rank
- #2285
- State rank
- #30 of 245 in NE
Livability — Henderson
- Score
- 77/100
- State rank
- #66
- US rank
- #2981
Category grades
Schools grade is shown separately in the Schools card above.
Census & demographics
- Census place
- Henderson, NE
- Population (ZIP)
- 1,199
Population outlook (York County) Hauer SSP2
- Today (2025)
- 13,976 people
- By 2030
- 14,103 · +0.9%
- By 2040
- 14,490 · +3.7%
- By 2050
- 15,059 · +7.7%
- By 2075
- 18,276 · +30.8%
- By 2100
- 21,449 · +53.5%
Race, ethnicity, and origin ACS 2023
- Neighborhood character
- Predominantly White (93%)
- Race & ethnicity
- White 93% Two or more races 7%
- Common ancestry
- Iranian 5% Lithuanian 5% Scotch-Irish 2%
- Foreign-born
- 2%
- Languages at home
- 94% English-only · German/W. Germanic 3% Arabic 2% Other Indo-European 1%
Political lean MEDSL · York
- 2024 margin
- Solid R (+51.3) · D 23.6% · R 74.9% · Other 1.5%
- 2008→2024 swing
- -2.0pp toward R · 2008: -49.3pp · 2024: -51.3pp
- All cycles
- 2024: R+51.3 2020: R+51.8 2016: R+56.0 2012: R+55.4 2008: R+49.3
Not yet ingested
- Civics
- —
Market trends
- HPI YoY
- ▲ 96.06%
- Current HPI
- 366.36
- Rent YoY
- —
- Metro
- —
- State GDP YoY
- ▲ 0.68%
- F500 in state
- 2
Industry mix (Fortune 500 HQ in NE)
| Industry | F500 HQs | Revenue |
|---|---|---|
| Conglomerate | 1 | $371B |
|
||
Price history
+160.7% since first listed7 events — show timeline
- 2026-06-15 Sold (MLS) $189,000 GPRMLS
- 2026-05-23 Pending — GPRMLS
- 2026-04-28 Listed $189,000 GPRMLS
- 2020-07-24 Sold (MLS) $129,900 GPRMLS
- 2020-02-12 Listed $129,900 GPRMLS
- 2017-02-01 Sold (Public Records) $85,000 Public Records
- 2001-07-25 Sold (Public Records) $72,500 Public Records
Property tax history
+1.5%/yrLatest (2025): $1,860 · +5.2% YoY. Source: county tax records.
Cash-flow waterfall
monthlySold comps — $/sqft
last 12 mo · ≤1 miLoading sold comps…